This function takes a plot or list of plots and writes them to a (multipage) file.
Arguments
- plot
Plot to save, defaults to last plot displayed.
- filename
File name to create on disk.
- width, height
Dimensions of the graphic device to save the plot. Defaults to
NA. In case ofNA, the dimensions are inferred from the incomingplotobject (see Details).- units
Units of length. Defaults to
"mm".- padding
Extra space around the saved plot. Defaults to
0.1meaning 10%.- multiple_files
Whether to save multiple pages as individual files.
- view_plot
Whether to view the plot on screen after saving.
- ...
Other arguments passed on to the graphics device function, as specified by
device.
Details
Handling of file dimensions. Output file dimensions are determined according the the following precedence.
The
widthandheightarguments.Dimensions inferred from the incoming
plotobject with absolute dimensions.System default device dimensions.
Examples
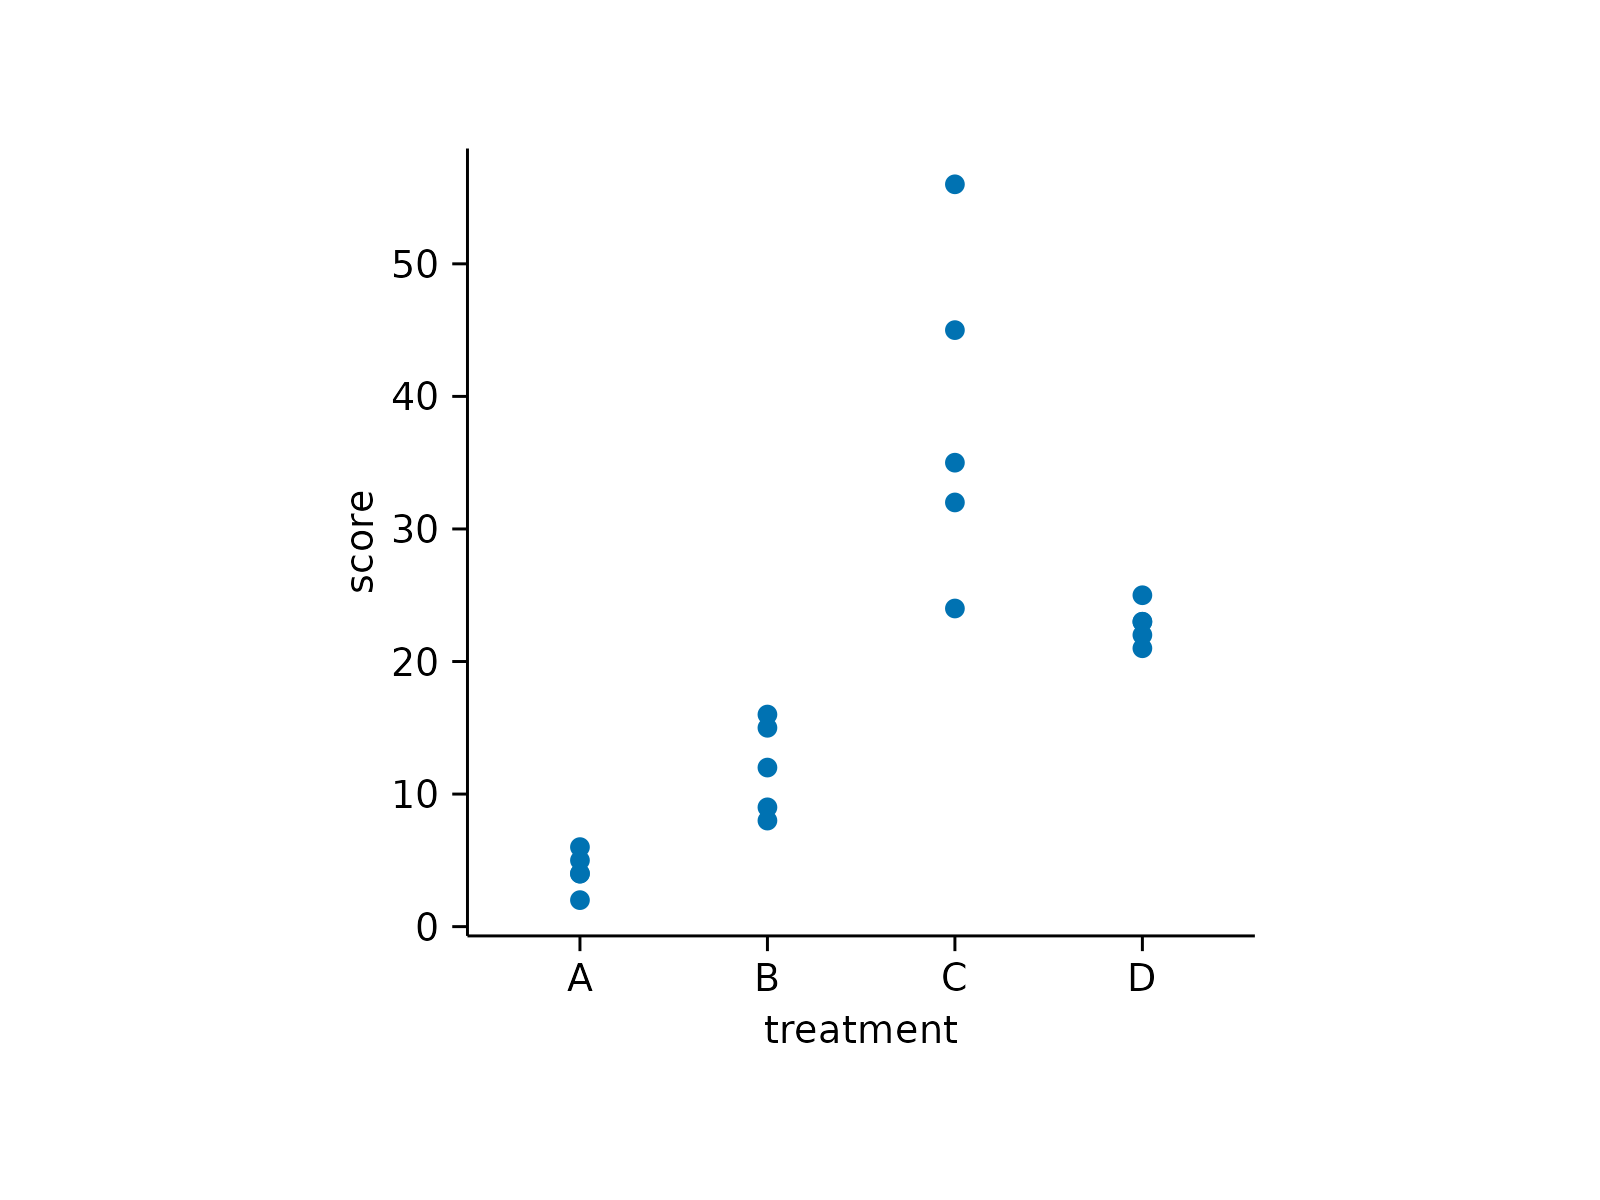
# Save plot to file
study |>
tidyplot(treatment, score) |>
add_data_points() |>
save_plot("single_plot.pdf")
#> ✔ save_plot: saved to single_plot.pdf
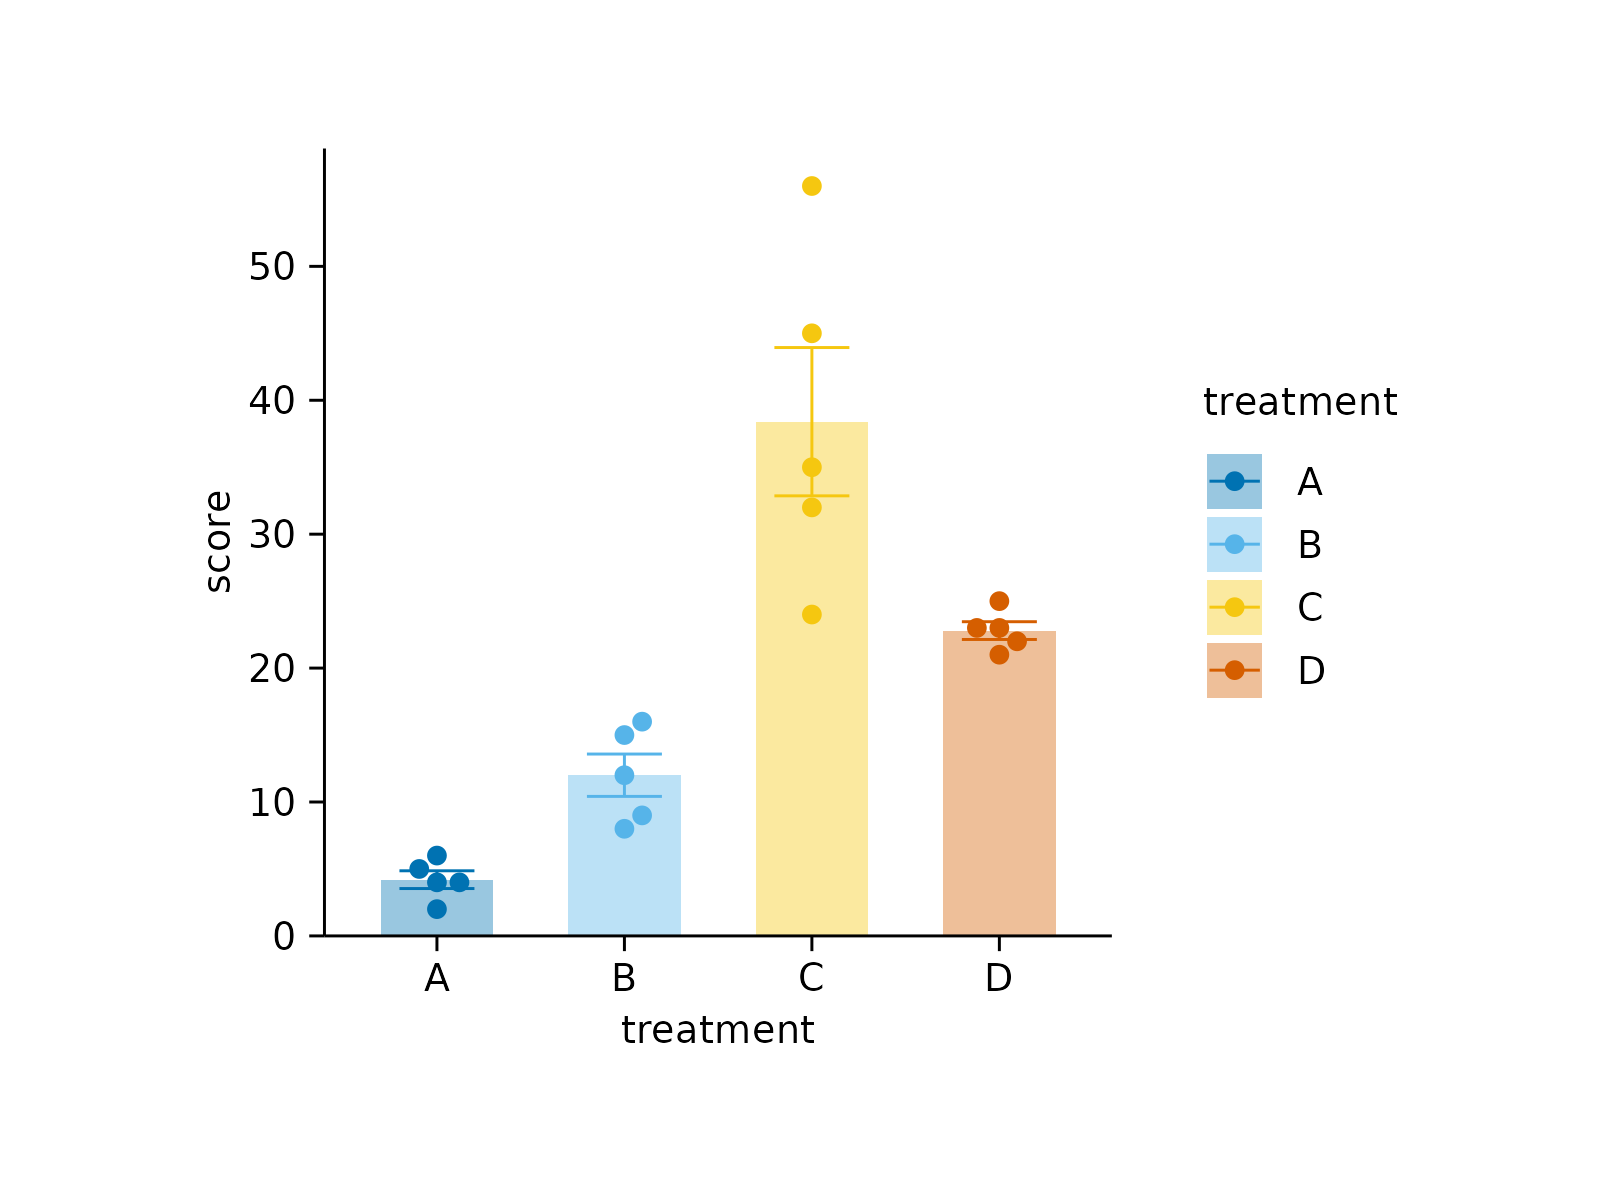
 # Save intermediate stages to file
study |>
tidyplot(x = treatment, y = score, color = treatment) |>
add_mean_bar(alpha = 0.4) |>
add_sem_errorbar() |>
add_data_points_beeswarm() |>
save_plot("before.pdf") |>
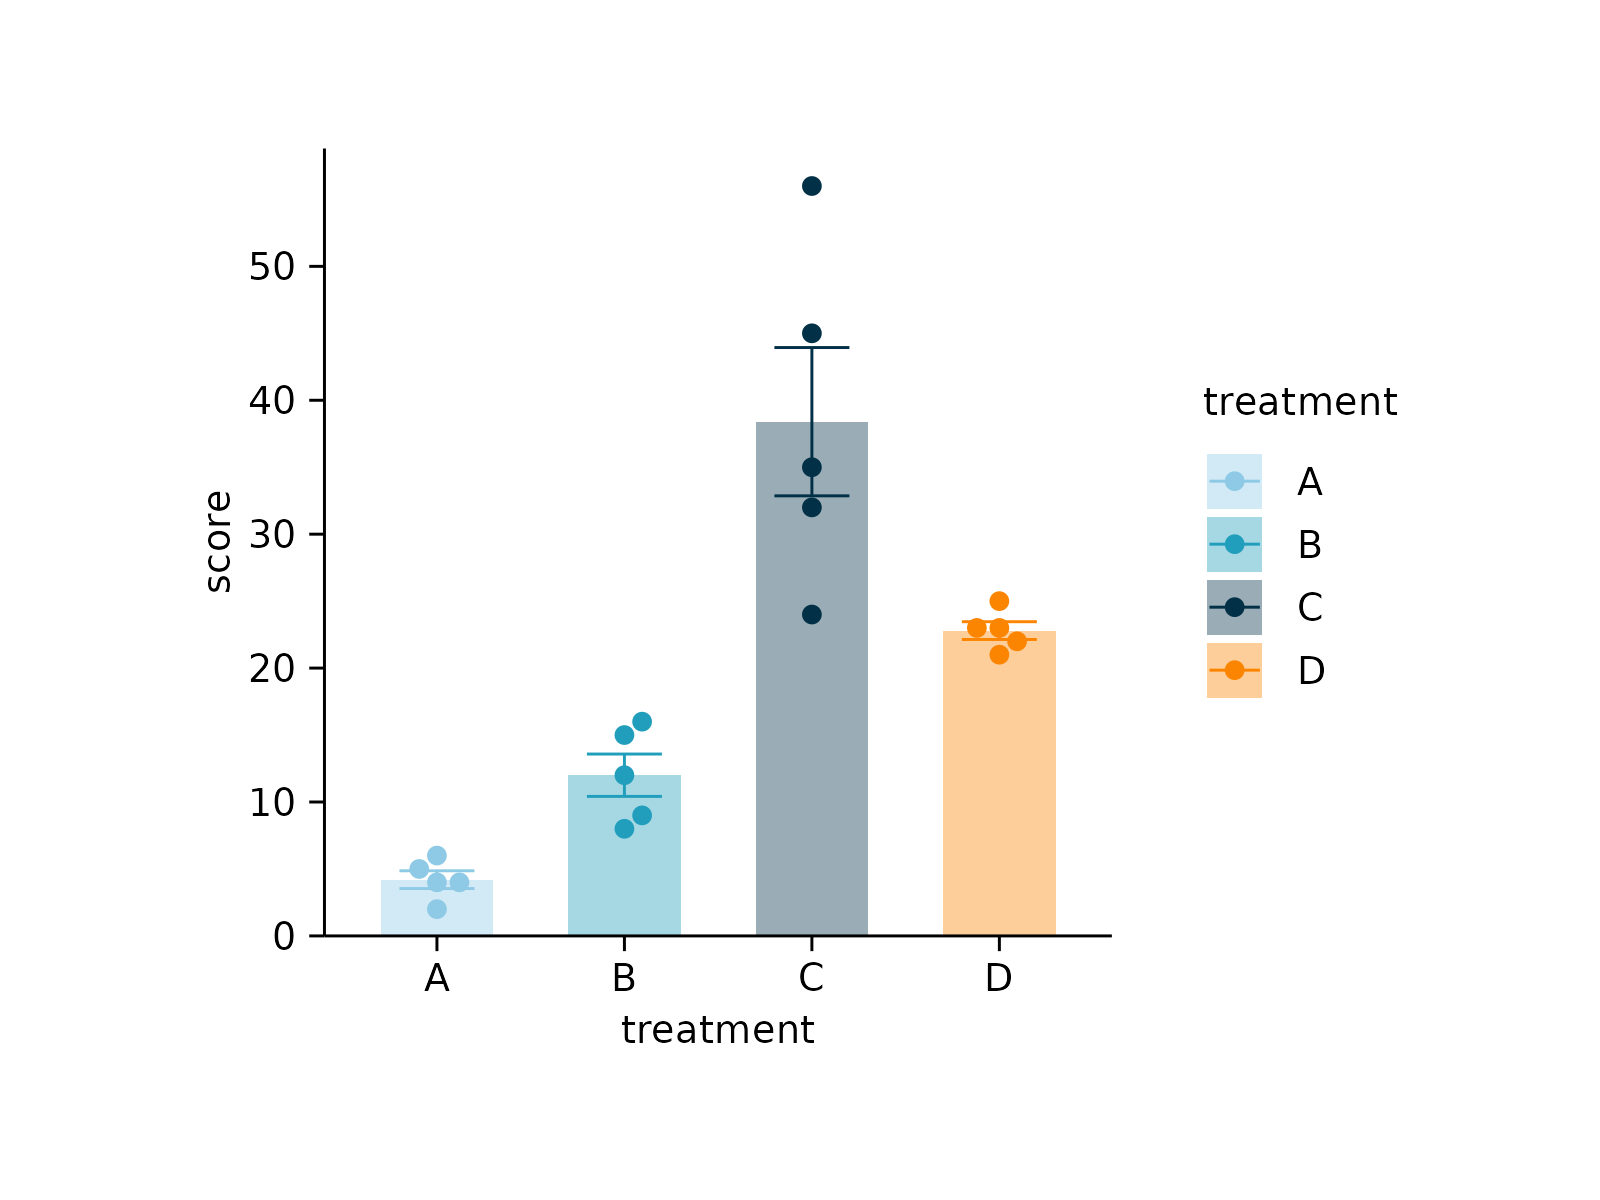
adjust_colors(colors_discrete_seaside) |>
save_plot("after.pdf")
#> ✔ save_plot: saved to before.pdf
# Save intermediate stages to file
study |>
tidyplot(x = treatment, y = score, color = treatment) |>
add_mean_bar(alpha = 0.4) |>
add_sem_errorbar() |>
add_data_points_beeswarm() |>
save_plot("before.pdf") |>
adjust_colors(colors_discrete_seaside) |>
save_plot("after.pdf")
#> ✔ save_plot: saved to before.pdf
 #> ✔ save_plot: saved to after.pdf
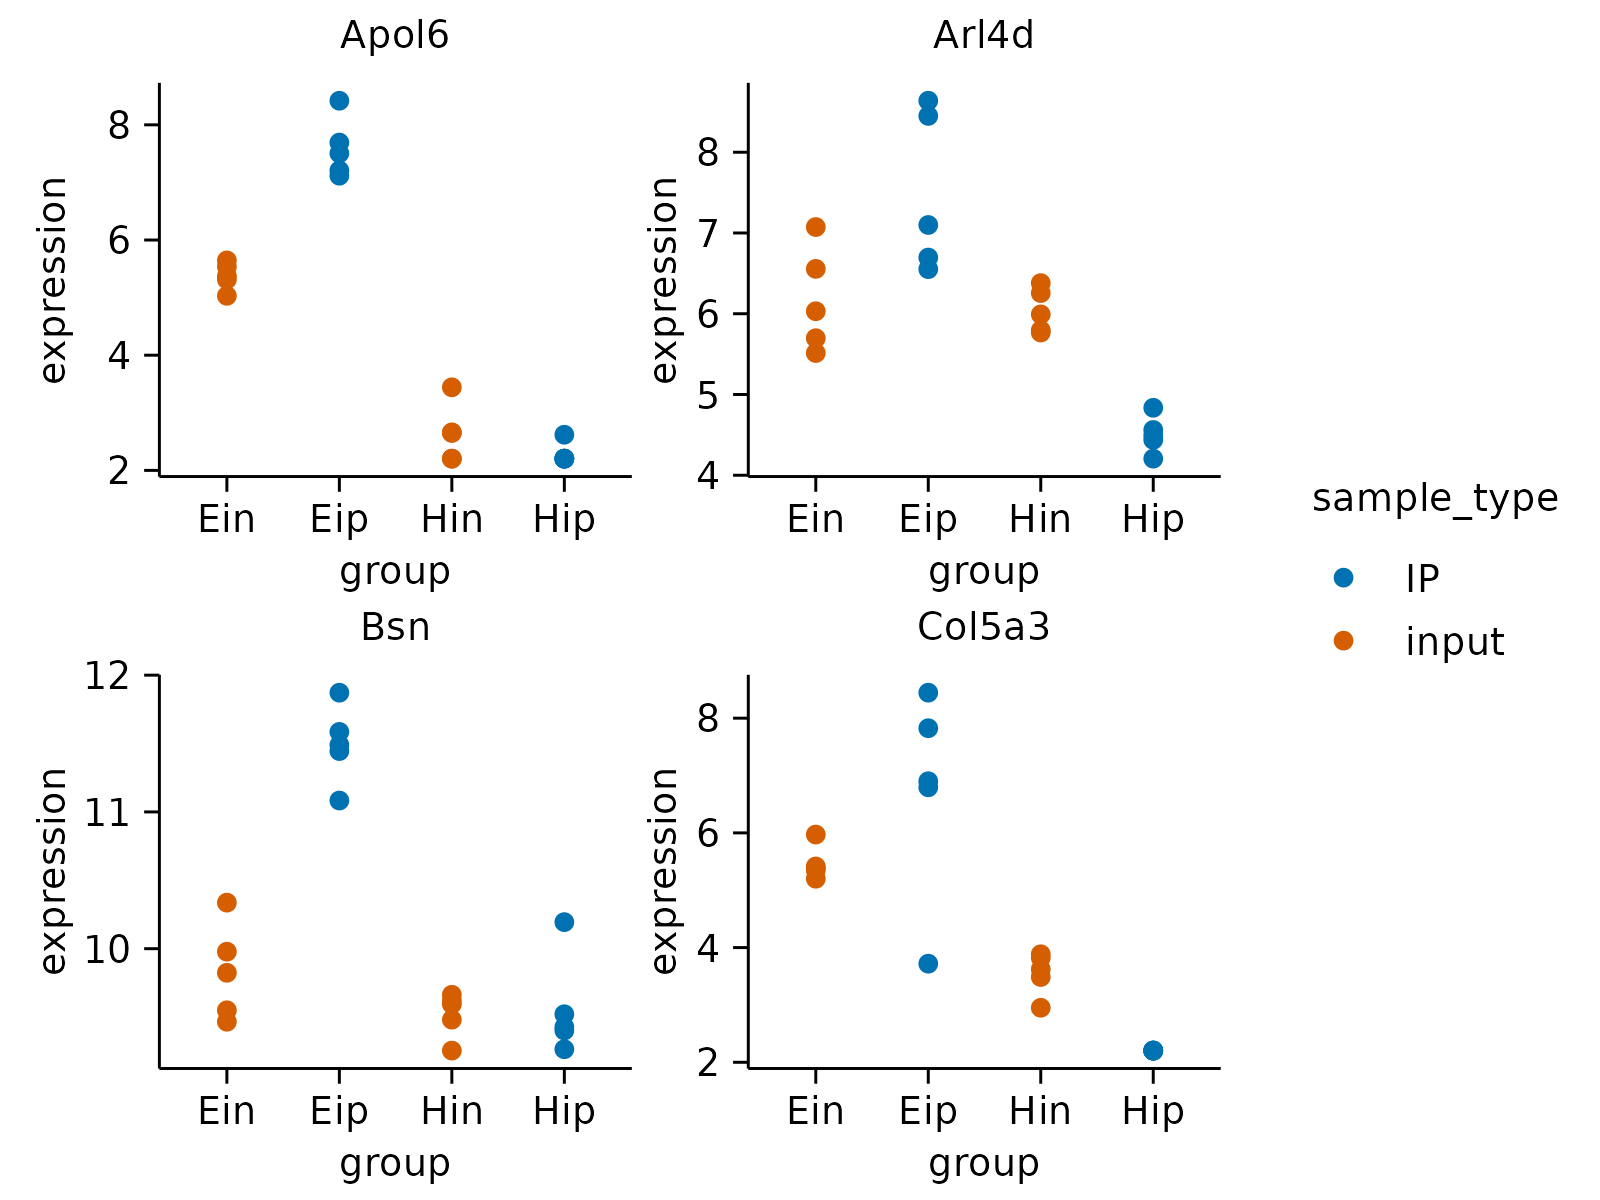
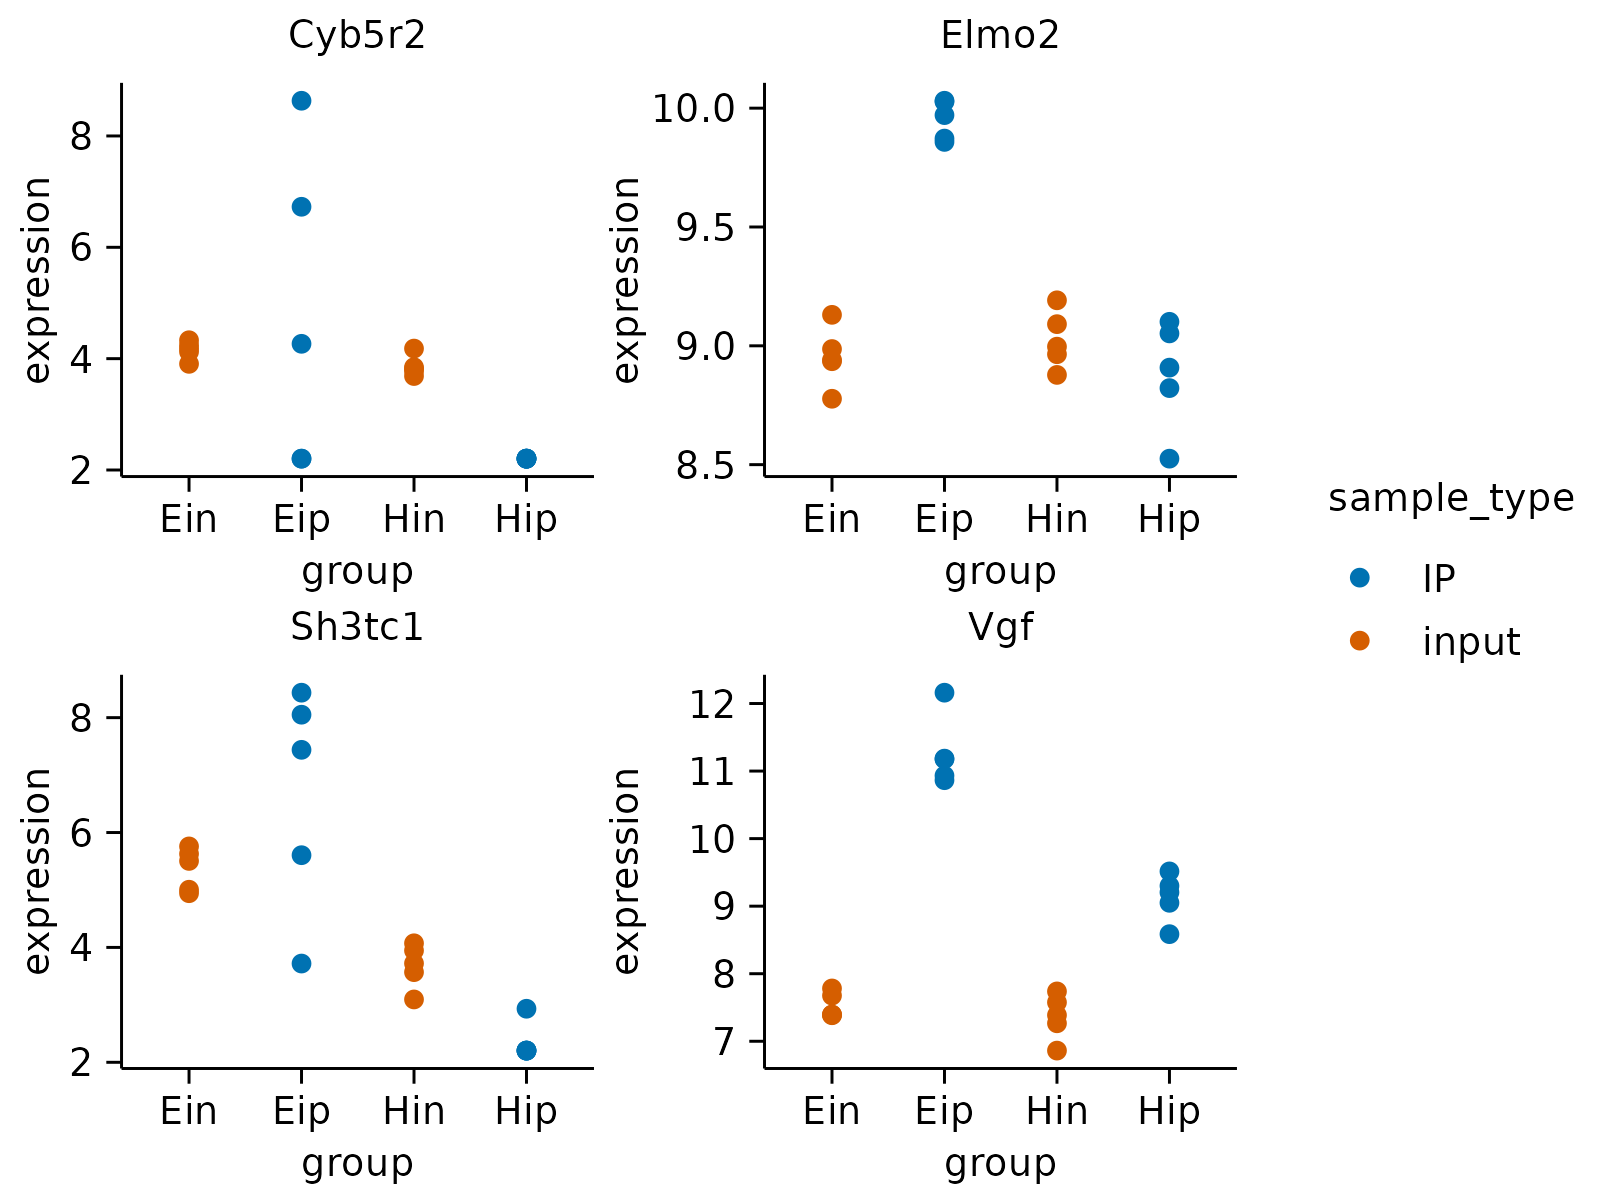
 # \donttest{
# Save multipage PDF file
gene_expression |>
dplyr::slice_head(n = 160) |>
tidyplot(group, expression, color = sample_type) |>
add_data_points() |>
adjust_size(width = 30, height = 25) |>
split_plot(by = external_gene_name, nrow = 2, ncol = 2) |>
save_plot("multipage_plot.pdf")
#> ✔ split_plot: split into 8 plots across 2 pages
#> ✔ save_plot: saved multipage PDF to multipage_plot.pdf
#> [[1]]
# \donttest{
# Save multipage PDF file
gene_expression |>
dplyr::slice_head(n = 160) |>
tidyplot(group, expression, color = sample_type) |>
add_data_points() |>
adjust_size(width = 30, height = 25) |>
split_plot(by = external_gene_name, nrow = 2, ncol = 2) |>
save_plot("multipage_plot.pdf")
#> ✔ split_plot: split into 8 plots across 2 pages
#> ✔ save_plot: saved multipage PDF to multipage_plot.pdf
#> [[1]]
 #>
#> [[2]]
#>
#> [[2]]
 #>
# Save multiple PDF files
gene_expression |>
dplyr::slice_head(n = 160) |>
tidyplot(group, expression, color = sample_type) |>
add_data_points() |>
adjust_size(width = 30, height = 25) |>
split_plot(by = external_gene_name, nrow = 2, ncol = 2) |>
save_plot("plot.pdf", multiple_files = TRUE)
#> ✔ split_plot: split into 8 plots across 2 pages
#> ✔ save_plot: saved multiple plots to plot_1.pdf and plot_2.pdf
#> [[1]]
#>
# Save multiple PDF files
gene_expression |>
dplyr::slice_head(n = 160) |>
tidyplot(group, expression, color = sample_type) |>
add_data_points() |>
adjust_size(width = 30, height = 25) |>
split_plot(by = external_gene_name, nrow = 2, ncol = 2) |>
save_plot("plot.pdf", multiple_files = TRUE)
#> ✔ split_plot: split into 8 plots across 2 pages
#> ✔ save_plot: saved multiple plots to plot_1.pdf and plot_2.pdf
#> [[1]]
 #>
#> [[2]]
#>
#> [[2]]
 #>
# }
#>
# }