Adjust plot area size
Usage
adjust_size(
  plot,
  width = NULL,
  height = NULL,
  unit = NULL,
  overall_width = NULL,
  overall_height = NULL
)
Arguments
- plot
A
tidyplotgenerated with the functiontidyplot().- width, height
Dimensions of the plot area. The default (
NULL) retrieves the setting from the tidyplots options, which defaults to50.NAresults in taking all available space (ggplot2 default).- unit
Unit of the plot area width and height. The default (
NULL) retrieves the setting from the tidyplots options, which defaults to"mm".- overall_width, overall_height
The overall dimensions of a multiplot layout generated with
split_plot().
Examples
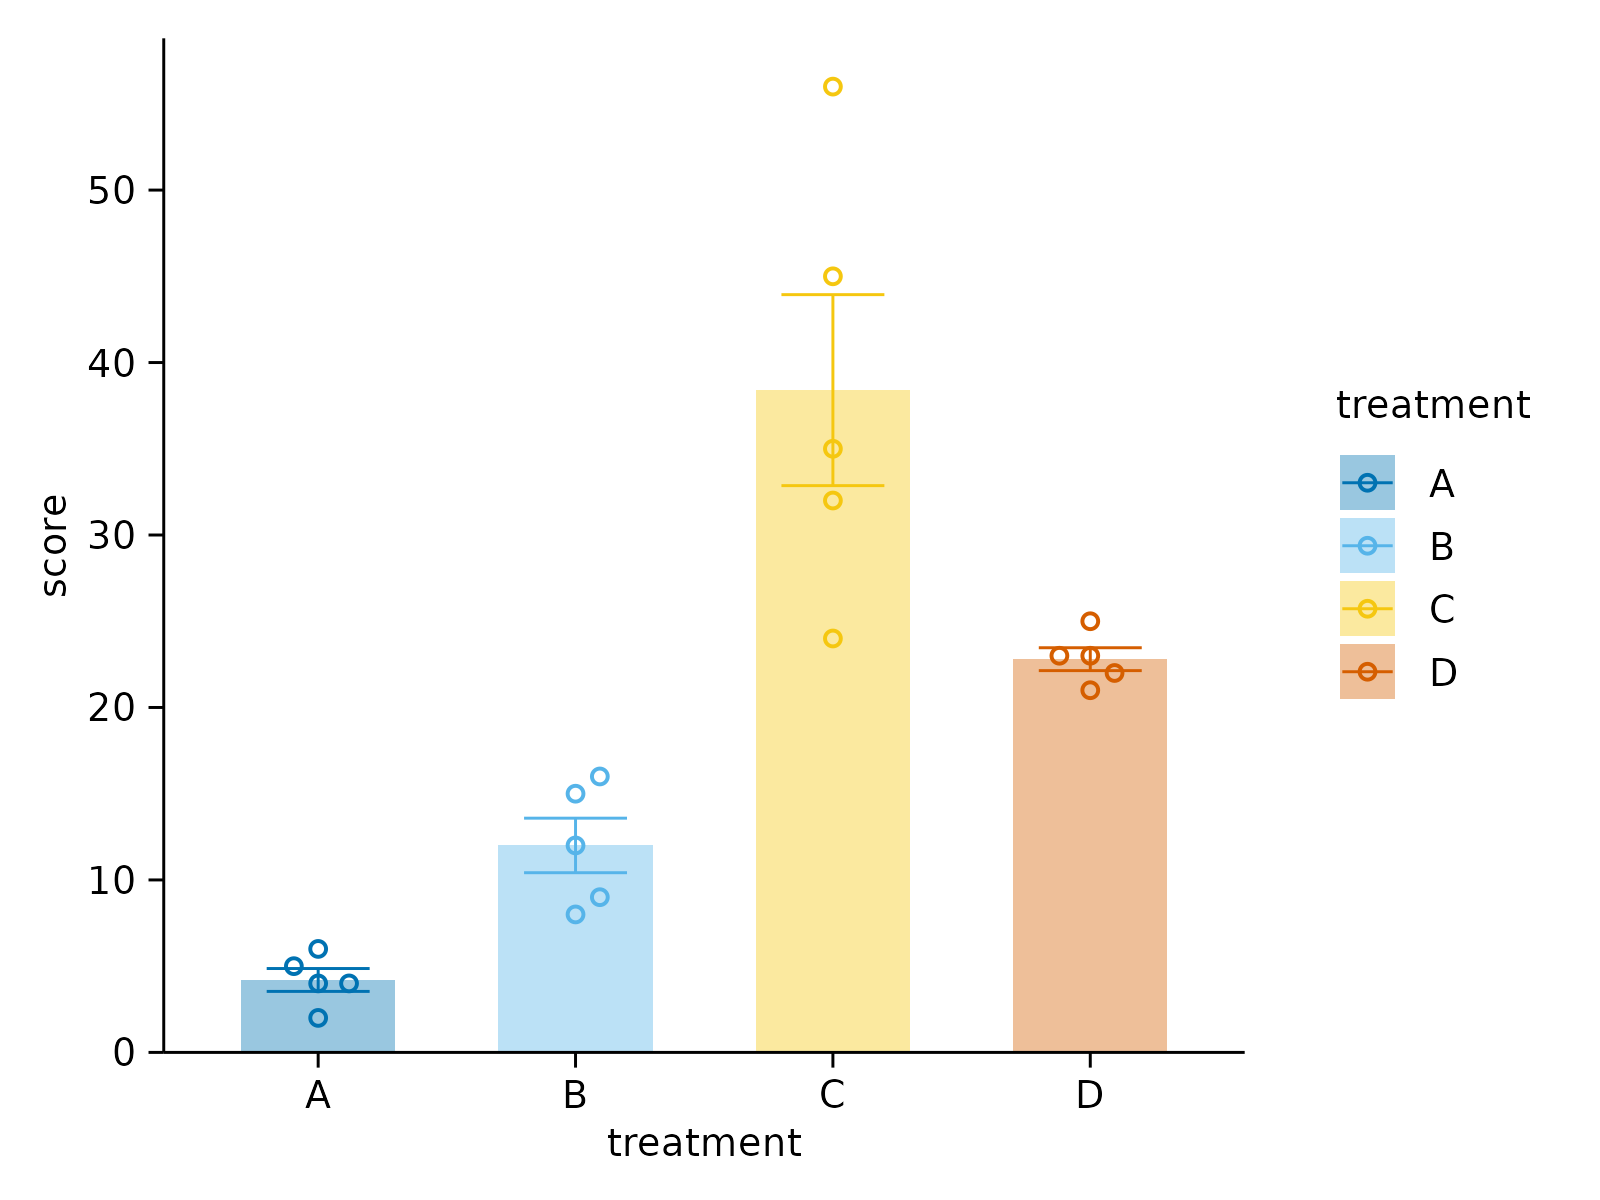
# Plot without adjustments
study |>
tidyplot(x = treatment, y = score, color = treatment) |>
add_data_points_beeswarm(shape = 1) |>
add_mean_bar(alpha = 0.4) |>
add_sem_errorbar()
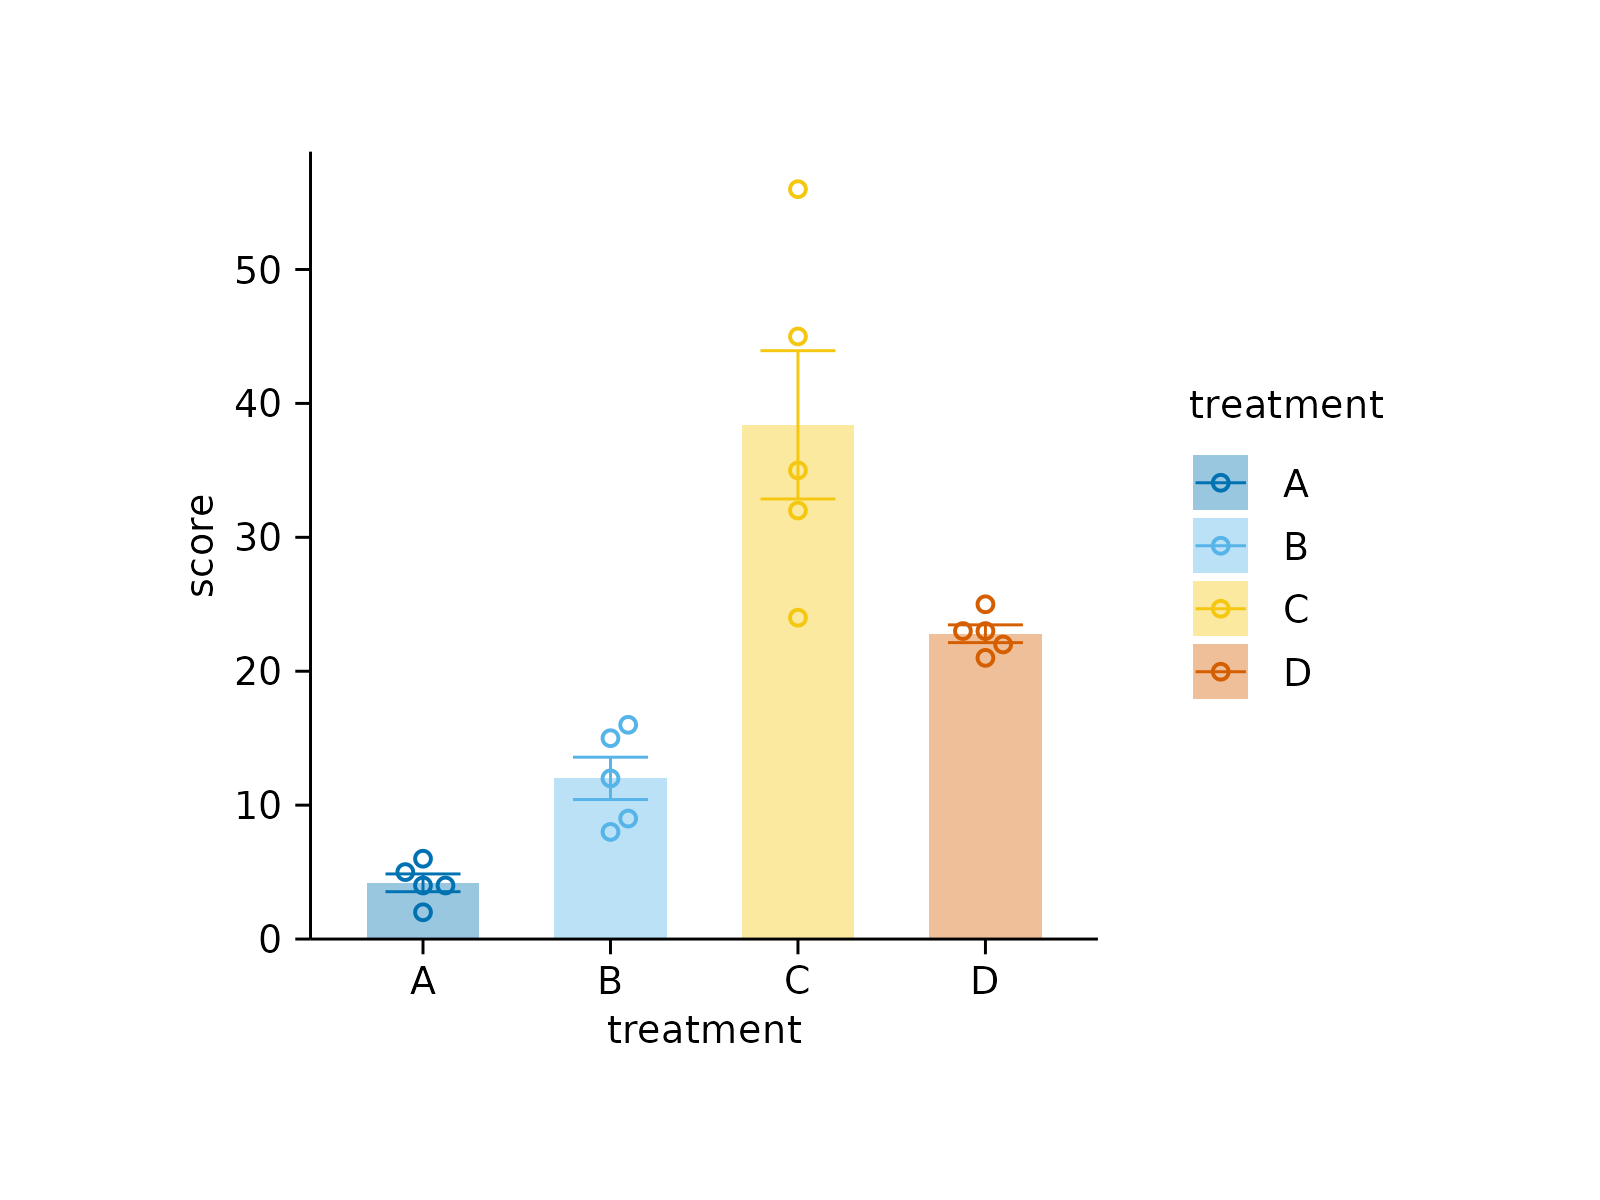 # Resize to 15 x 15 mm
study |>
tidyplot(x = treatment, y = score, color = treatment) |>
add_data_points_beeswarm(shape = 1) |>
add_mean_bar(alpha = 0.4) |>
add_sem_errorbar() |>
adjust_size(width = 15, height = 15)
# Resize to 15 x 15 mm
study |>
tidyplot(x = treatment, y = score, color = treatment) |>
add_data_points_beeswarm(shape = 1) |>
add_mean_bar(alpha = 0.4) |>
add_sem_errorbar() |>
adjust_size(width = 15, height = 15)
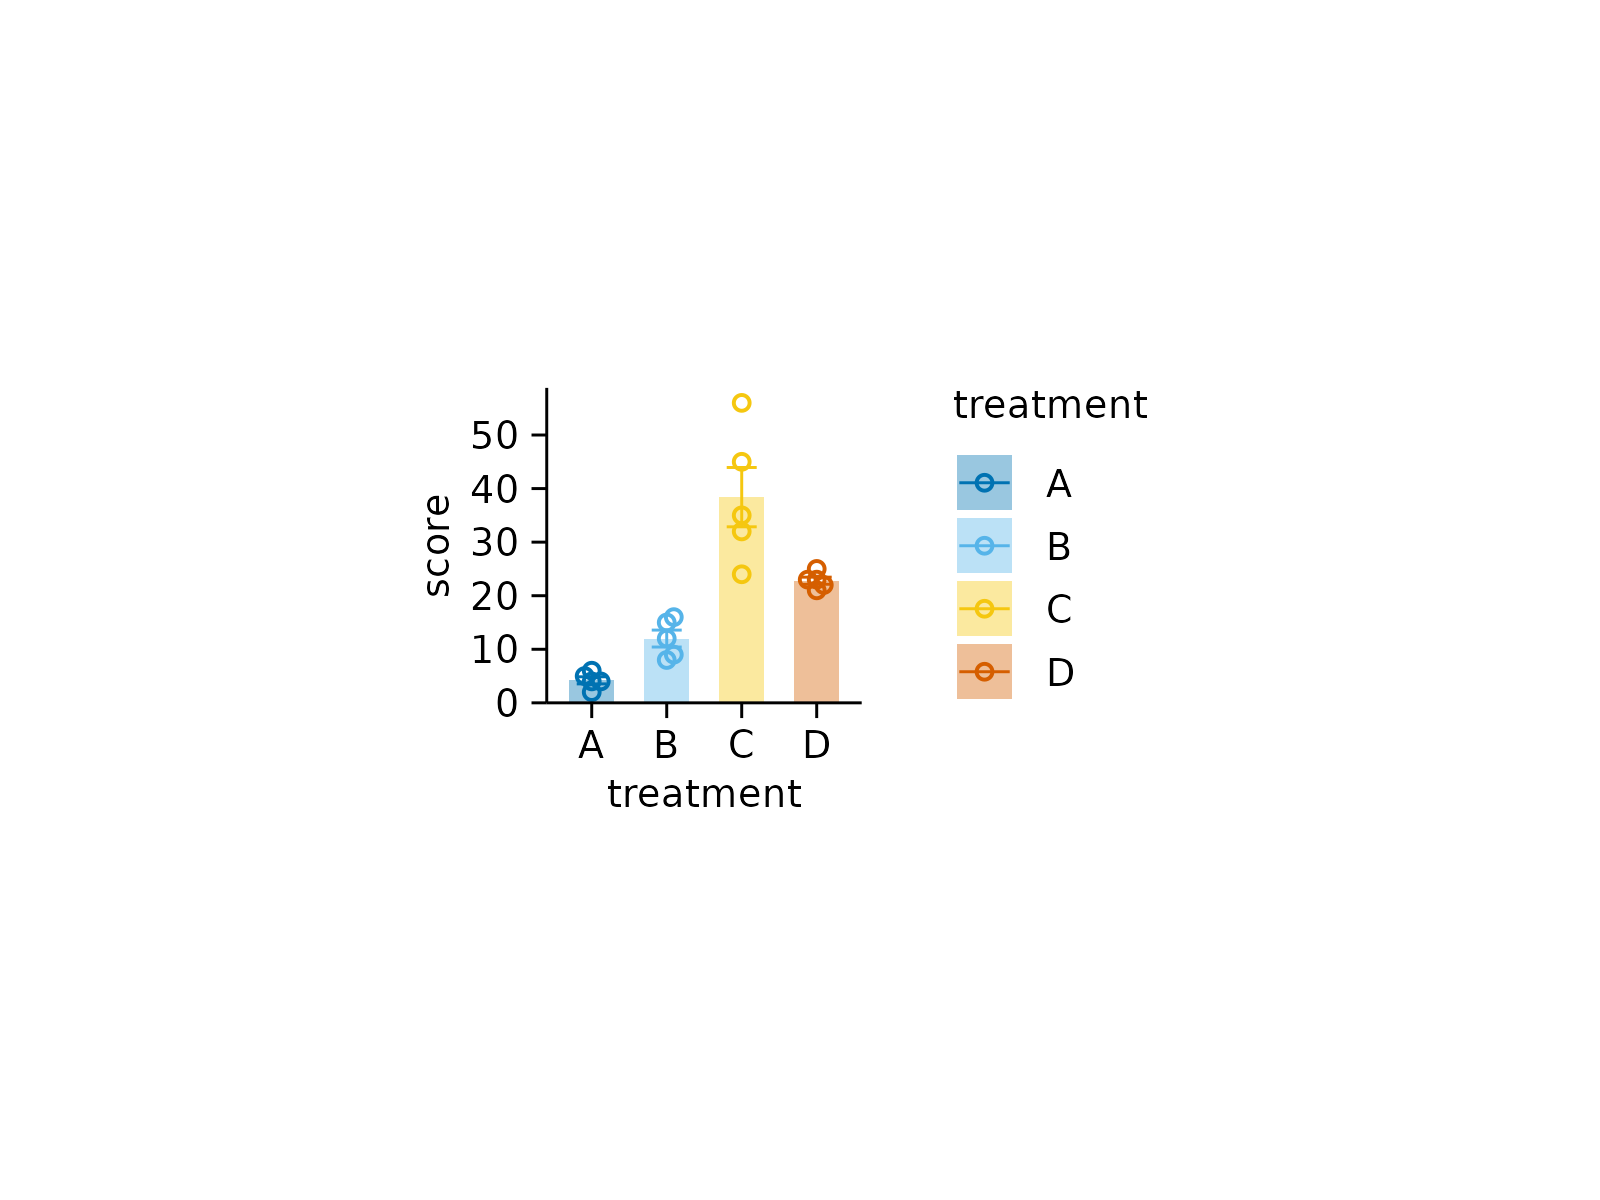 # Resize to 4 x 4 cm
study |>
tidyplot(x = treatment, y = score, color = treatment) |>
add_data_points_beeswarm(shape = 1) |>
add_mean_bar(alpha = 0.4) |>
add_sem_errorbar() |>
adjust_size(width = 4, height = 4, unit = "cm")
# Resize to 4 x 4 cm
study |>
tidyplot(x = treatment, y = score, color = treatment) |>
add_data_points_beeswarm(shape = 1) |>
add_mean_bar(alpha = 0.4) |>
add_sem_errorbar() |>
adjust_size(width = 4, height = 4, unit = "cm")
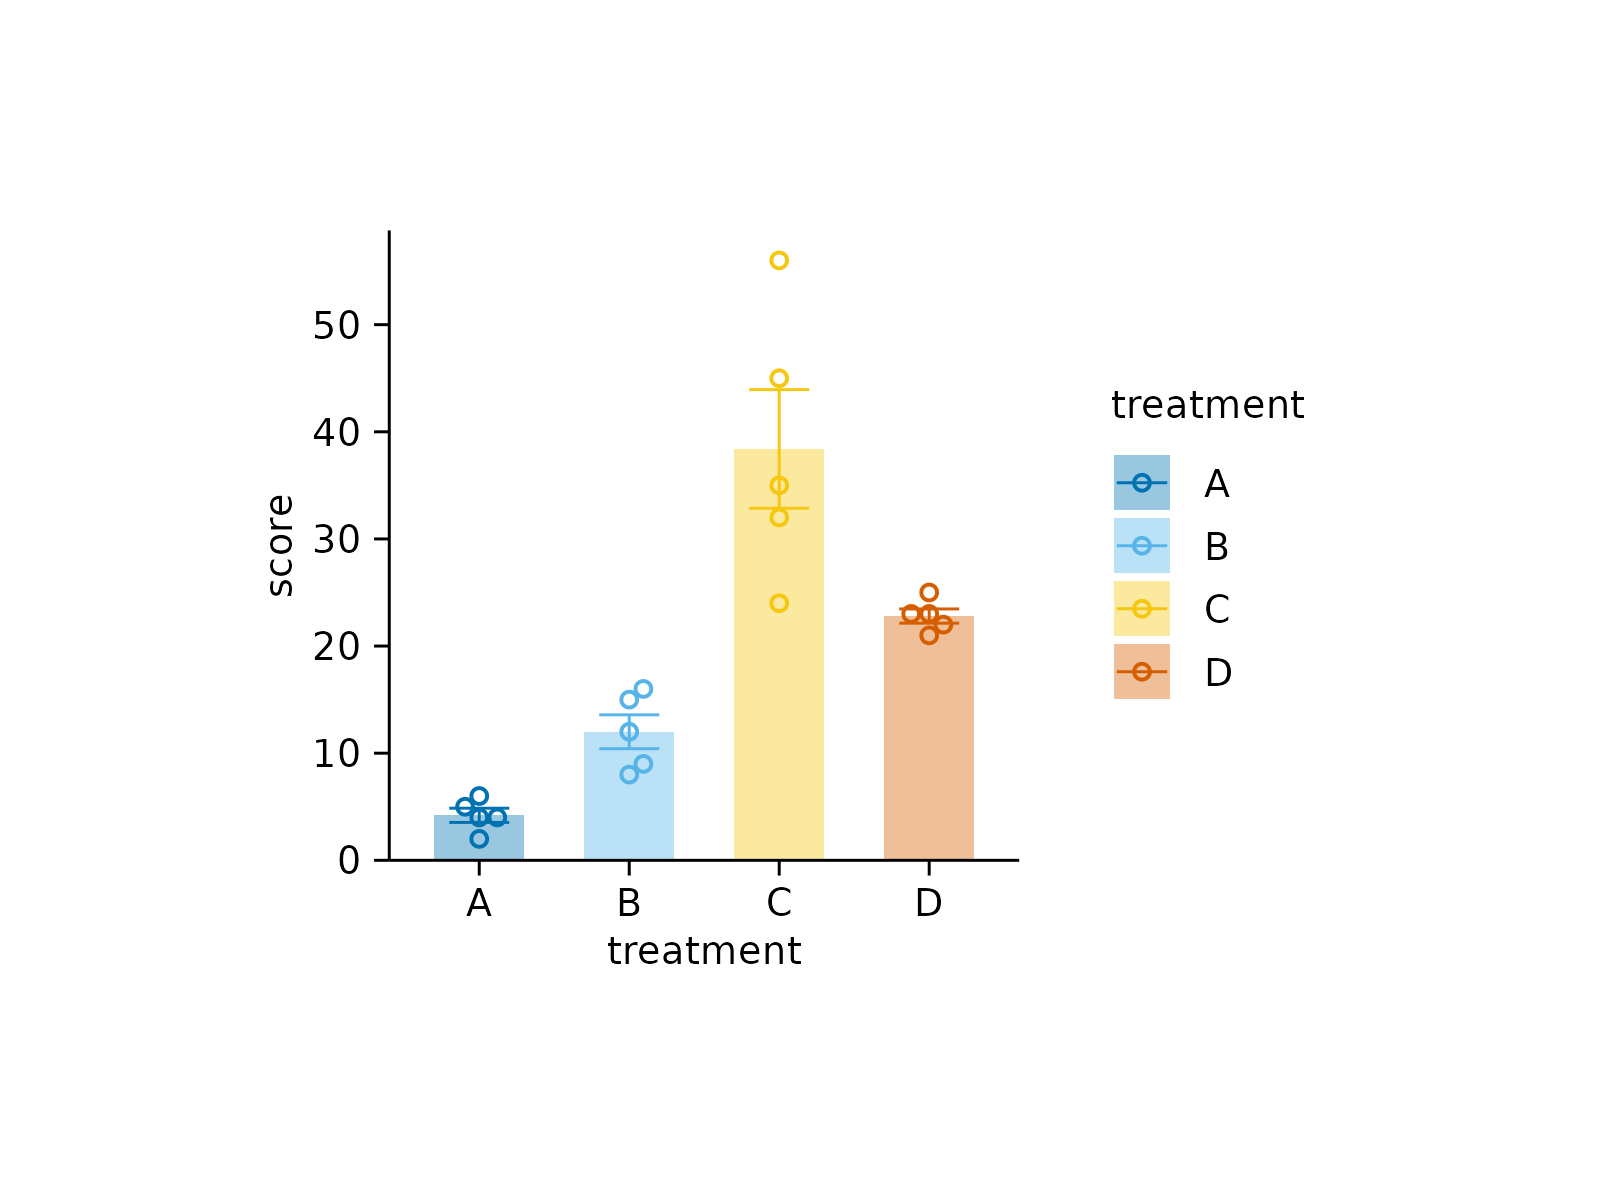 # Remove absolute dimensions and take all available space.
# This is the ggplot2 default.
study |>
tidyplot(x = treatment, y = score, color = treatment) |>
add_data_points_beeswarm(shape = 1) |>
add_mean_bar(alpha = 0.4) |>
add_sem_errorbar() |>
adjust_size(width = NA, height = NA)
# Remove absolute dimensions and take all available space.
# This is the ggplot2 default.
study |>
tidyplot(x = treatment, y = score, color = treatment) |>
add_data_points_beeswarm(shape = 1) |>
add_mean_bar(alpha = 0.4) |>
add_sem_errorbar() |>
adjust_size(width = NA, height = NA)