Add data points
Usage
add_data_points(
  plot,
  data = all_rows(),
  shape = 19,
  size = 1,
  white_border = FALSE,
  dodge_width = NULL,
  preserve = "total",
  rasterize = FALSE,
  rasterize_dpi = 300,
  ...
)

add_data_points_jitter(
  plot,
  data = all_rows(),
  shape = 19,
  size = 1,
  white_border = FALSE,
  dodge_width = NULL,
  jitter_width = 0.2,
  jitter_height = 0,
  preserve = "total",
  rasterize = FALSE,
  rasterize_dpi = 300,
  seed = 42,
  ...
)

add_data_points_beeswarm(
  plot,
  data = all_rows(),
  shape = 19,
  size = 1,
  white_border = FALSE,
  cex = 3,
  corral = "wrap",
  corral.width = 0.5,
  dodge_width = NULL,
  preserve = "total",
  rasterize = FALSE,
  rasterize_dpi = 300,
  ...
)
Arguments
- plot
A
tidyplotgenerated with the functiontidyplot().- data
The data to be displayed in this layer. There are three options:
If
all_rows()(the default) the complete dataset is displayed.A
functionto subset the plot data. Seefilter_rows()and friends.A
data.frameto override the plot data.
- shape
An
integerbetween0and24, representing the shape of the plot symbol.
- size
A
numberrepresenting the size of the plot symbol. Typical values range between1and3.- white_border
Whether to include a white border around data points. Defaults to
FALSE.- dodge_width
For adjusting the distance between grouped objects. Defaults to
0.8for plots with at least one discrete axis and0for plots with two continuous axes.- preserve
Should dodging preserve the
"total"width of all elements at a position, or the width of a"single"element?- rasterize
If
FALSE(the default) the layer will be constructed of vector shapes. IfTRUEthe layer will be rasterized to a pixel image. This can be useful when plotting many individual objects (1,000 or more) compromises the performance of the generated PDF file.- rasterize_dpi
The resolution in dots per inch (dpi) used for rastering the layer if
rasterizeisTRUE. The default is300dpi.- ...
Arguments passed on to the
geomfunction.- jitter_width
Amount of random noise to be added to the horizontal position of the of the data points. This can be useful to deal with overplotting. Typical values range between
0and1.- jitter_height
Amount of random noise to be added to the vertical position of the of the data points. This can be useful to deal with overplotting. Typical values range between
0and1.- seed
Random seed controlling point and label jitter.
- cex
Scaling for adjusting point spacing (see
beeswarm::swarmx()). Values between 1 (default) and 3 tend to work best.- corral
Method used to adjust points that would be placed too wide horizontally. Options are
"none"(default),"gutter","wrap","random", and"omit". See Details below.- corral.width
Width of the corral, if not
"none". Default is0.9.
Details
add_data_points_beeswarm()is based onggbeeswarm::geom_beeswarm(). Check there for additional arguments.add_data_points()and friends support rasterization. See examples and Advanced plotting.add_data_points()and friends support data subsetting. See examples and Advanced plotting.
Examples
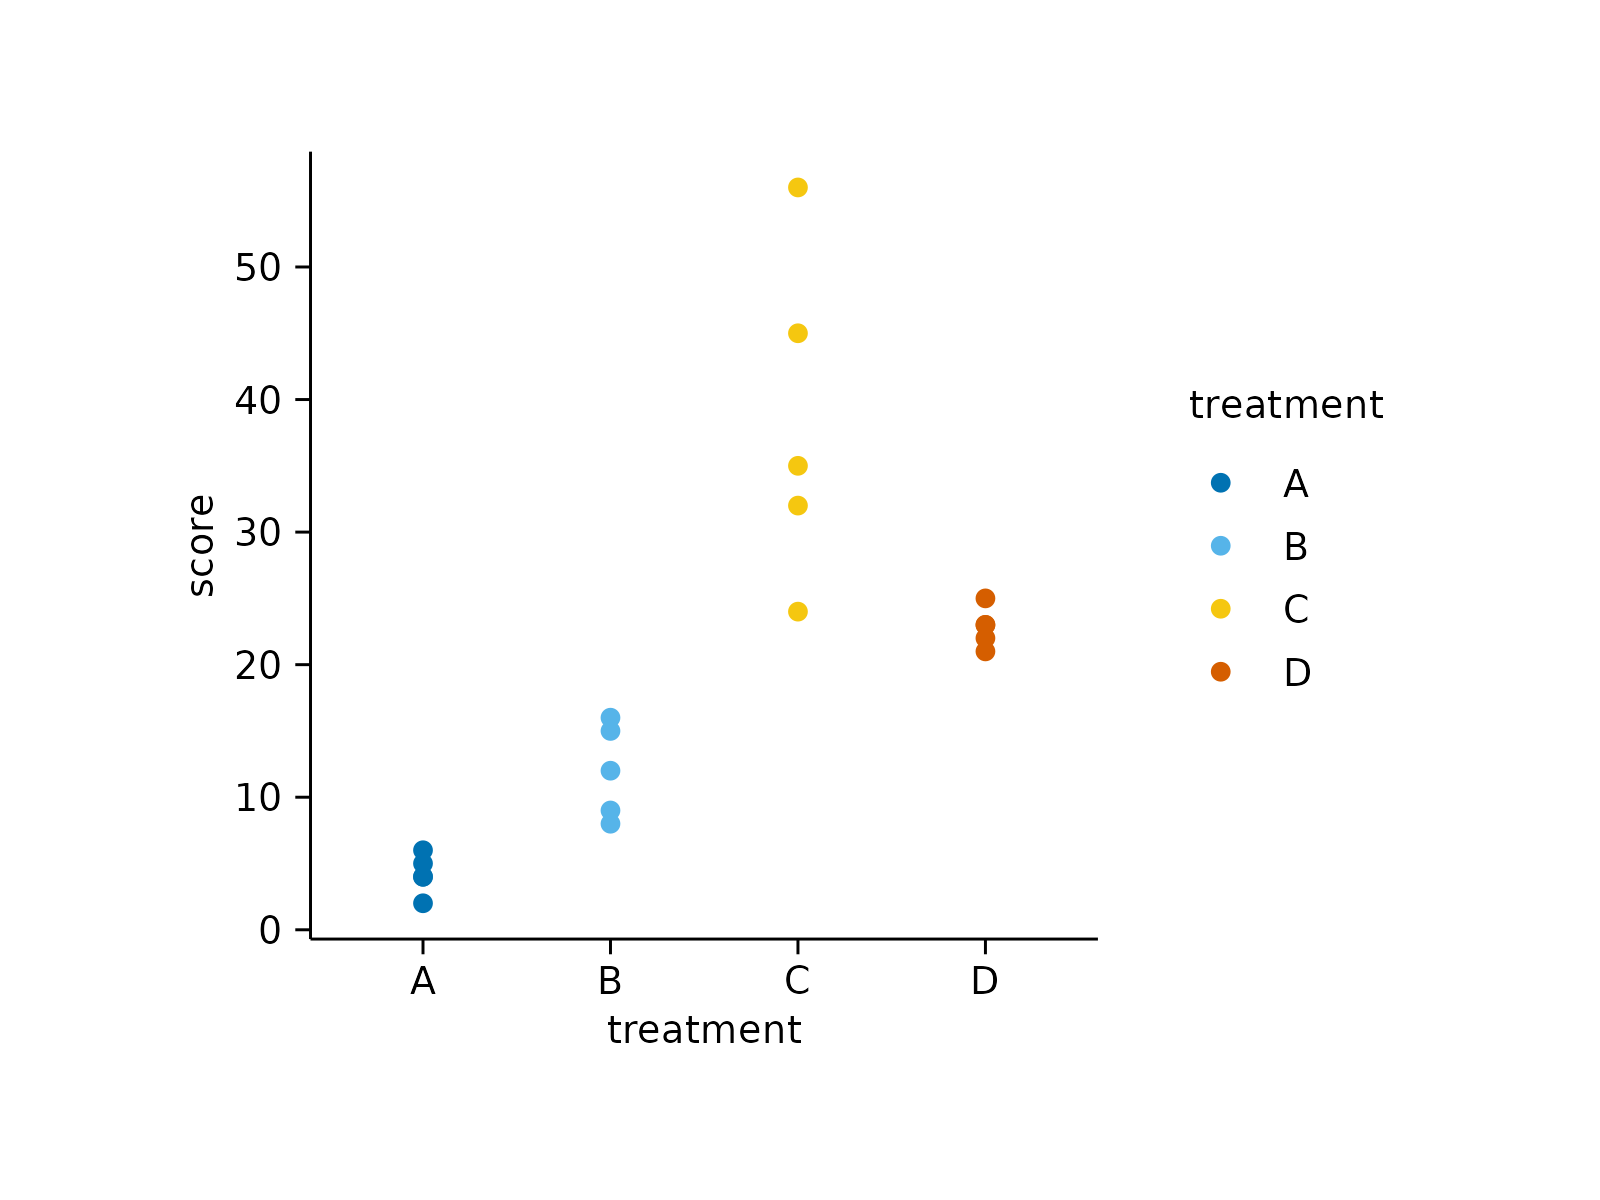
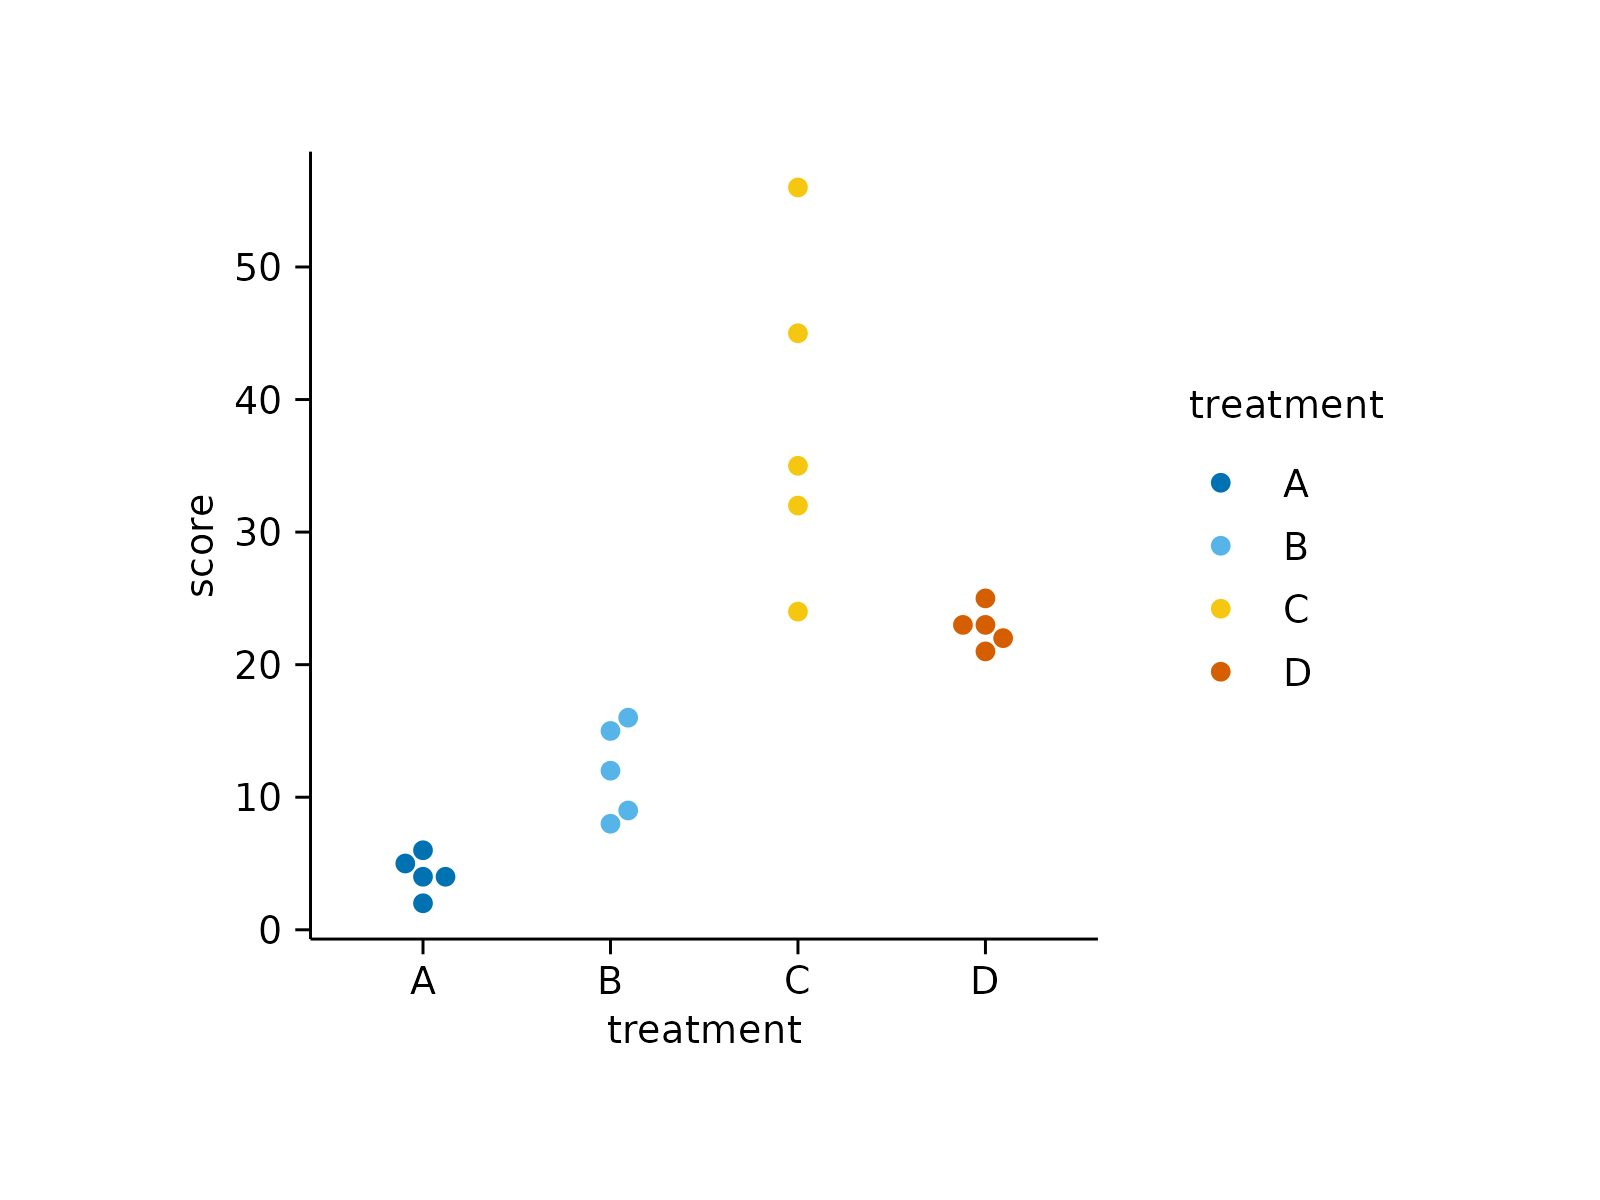
study |>
tidyplot(x = treatment, y = score, color = treatment) |>
add_data_points()
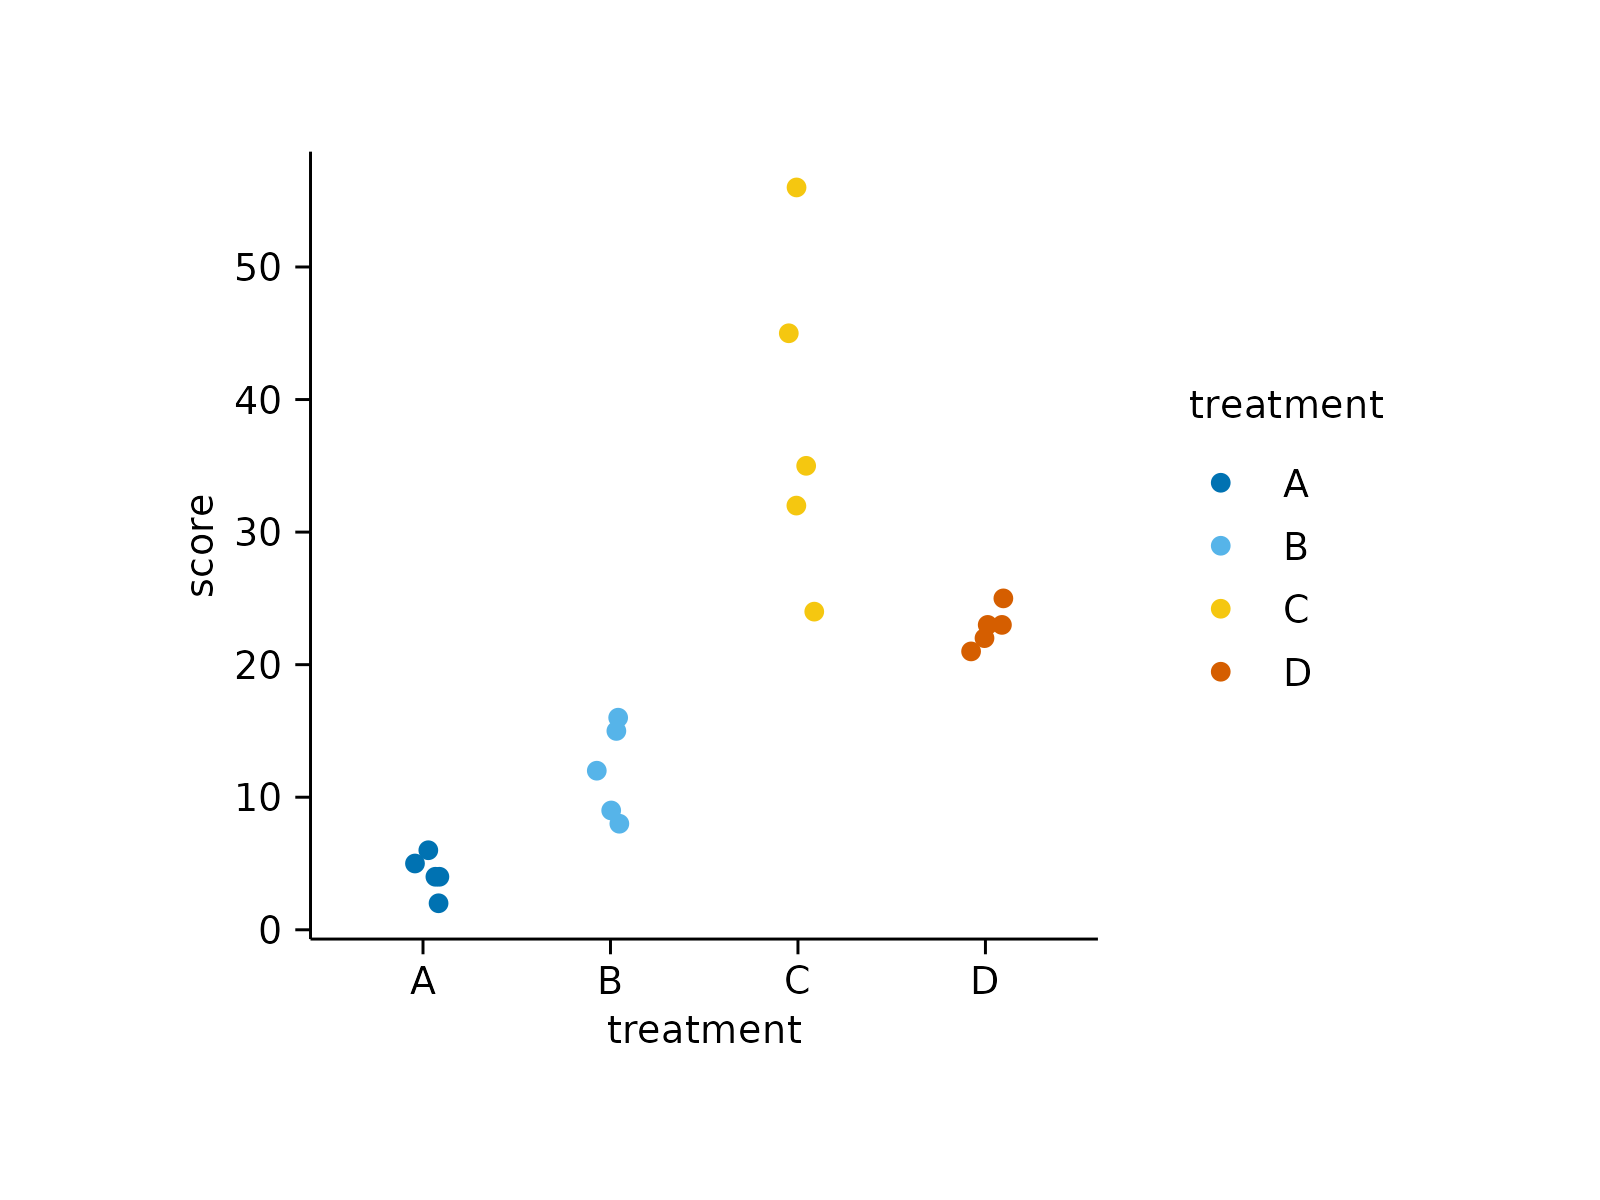
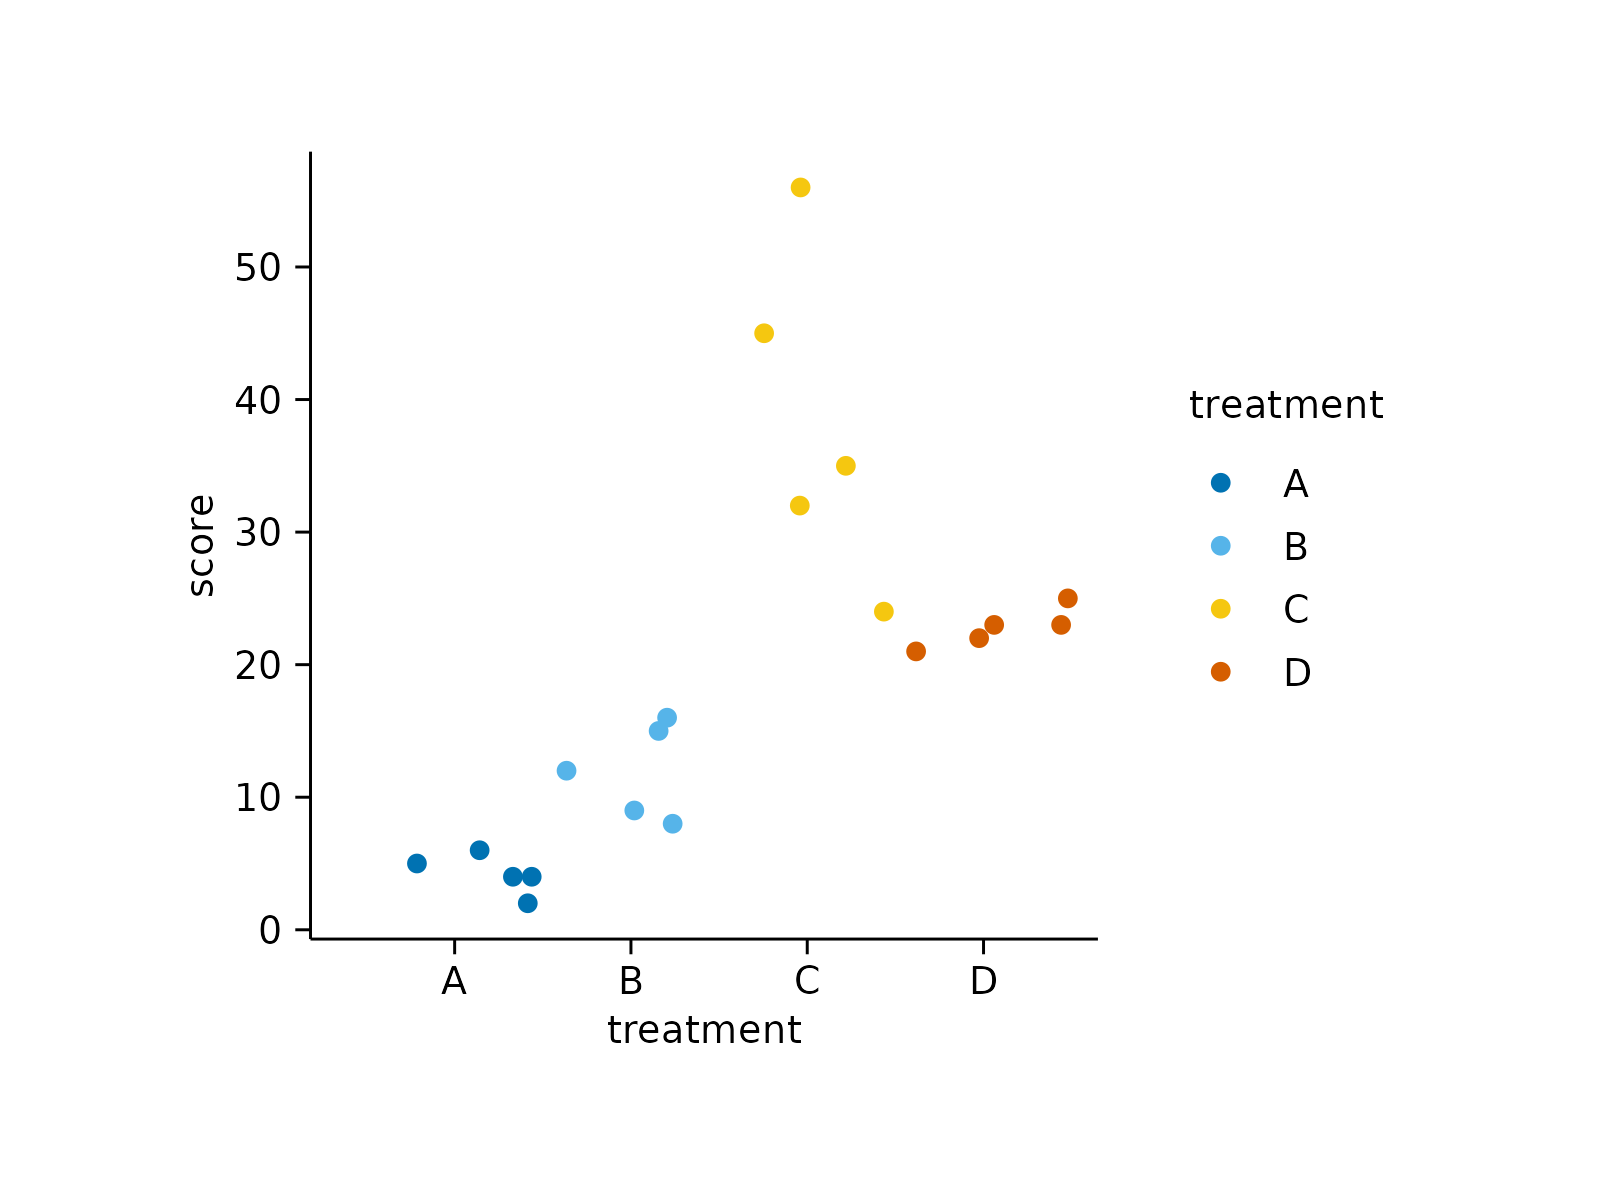
 study |>
tidyplot(x = treatment, y = score, color = treatment) |>
add_data_points_jitter()
study |>
tidyplot(x = treatment, y = score, color = treatment) |>
add_data_points_jitter()
 study |>
tidyplot(x = treatment, y = score, color = treatment) |>
add_data_points_beeswarm()
study |>
tidyplot(x = treatment, y = score, color = treatment) |>
add_data_points_beeswarm()
 # Changing arguments
study |>
tidyplot(x = treatment, y = score, color = treatment) |>
add_data_points_jitter(jitter_width = 1)
# Changing arguments
study |>
tidyplot(x = treatment, y = score, color = treatment) |>
add_data_points_jitter(jitter_width = 1)
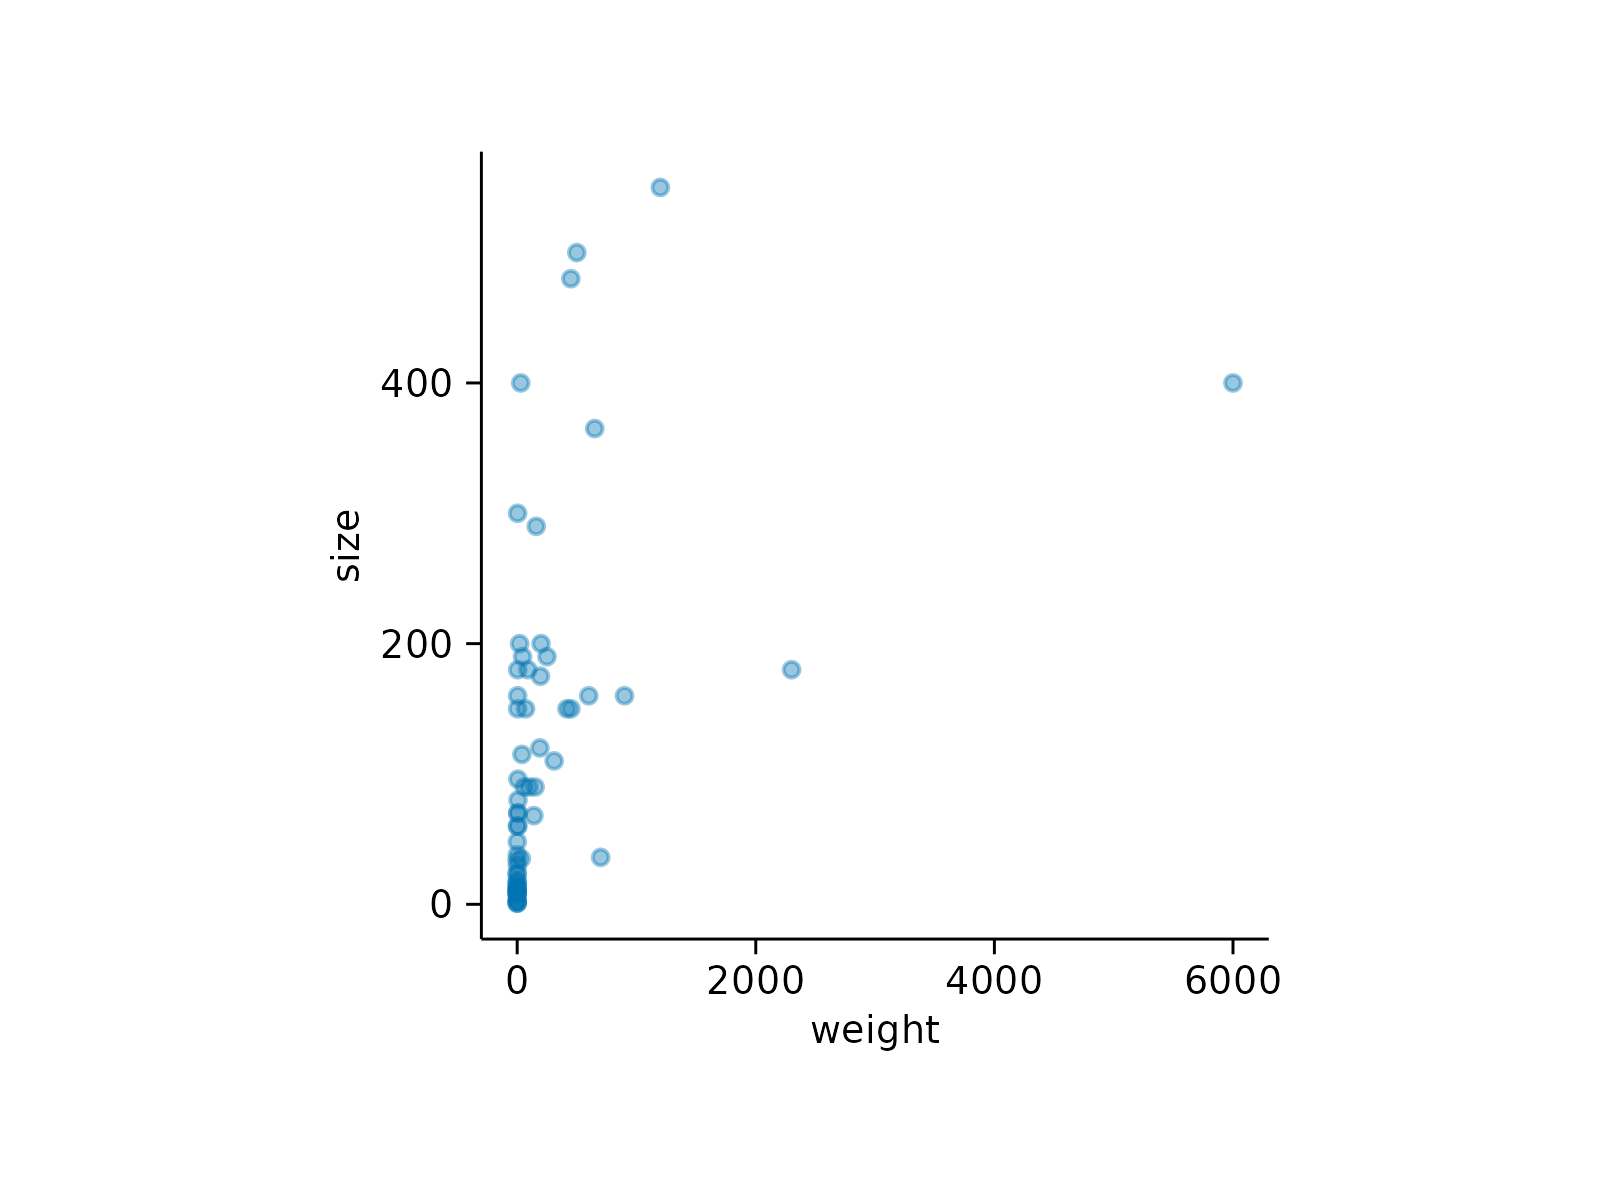
 animals |>
tidyplot(x = weight, y = size) |>
add_data_points(white_border = TRUE)
animals |>
tidyplot(x = weight, y = size) |>
add_data_points(white_border = TRUE)
 animals |>
tidyplot(x = weight, y = size) |>
add_data_points(alpha = 0.4)
animals |>
tidyplot(x = weight, y = size) |>
add_data_points(alpha = 0.4)
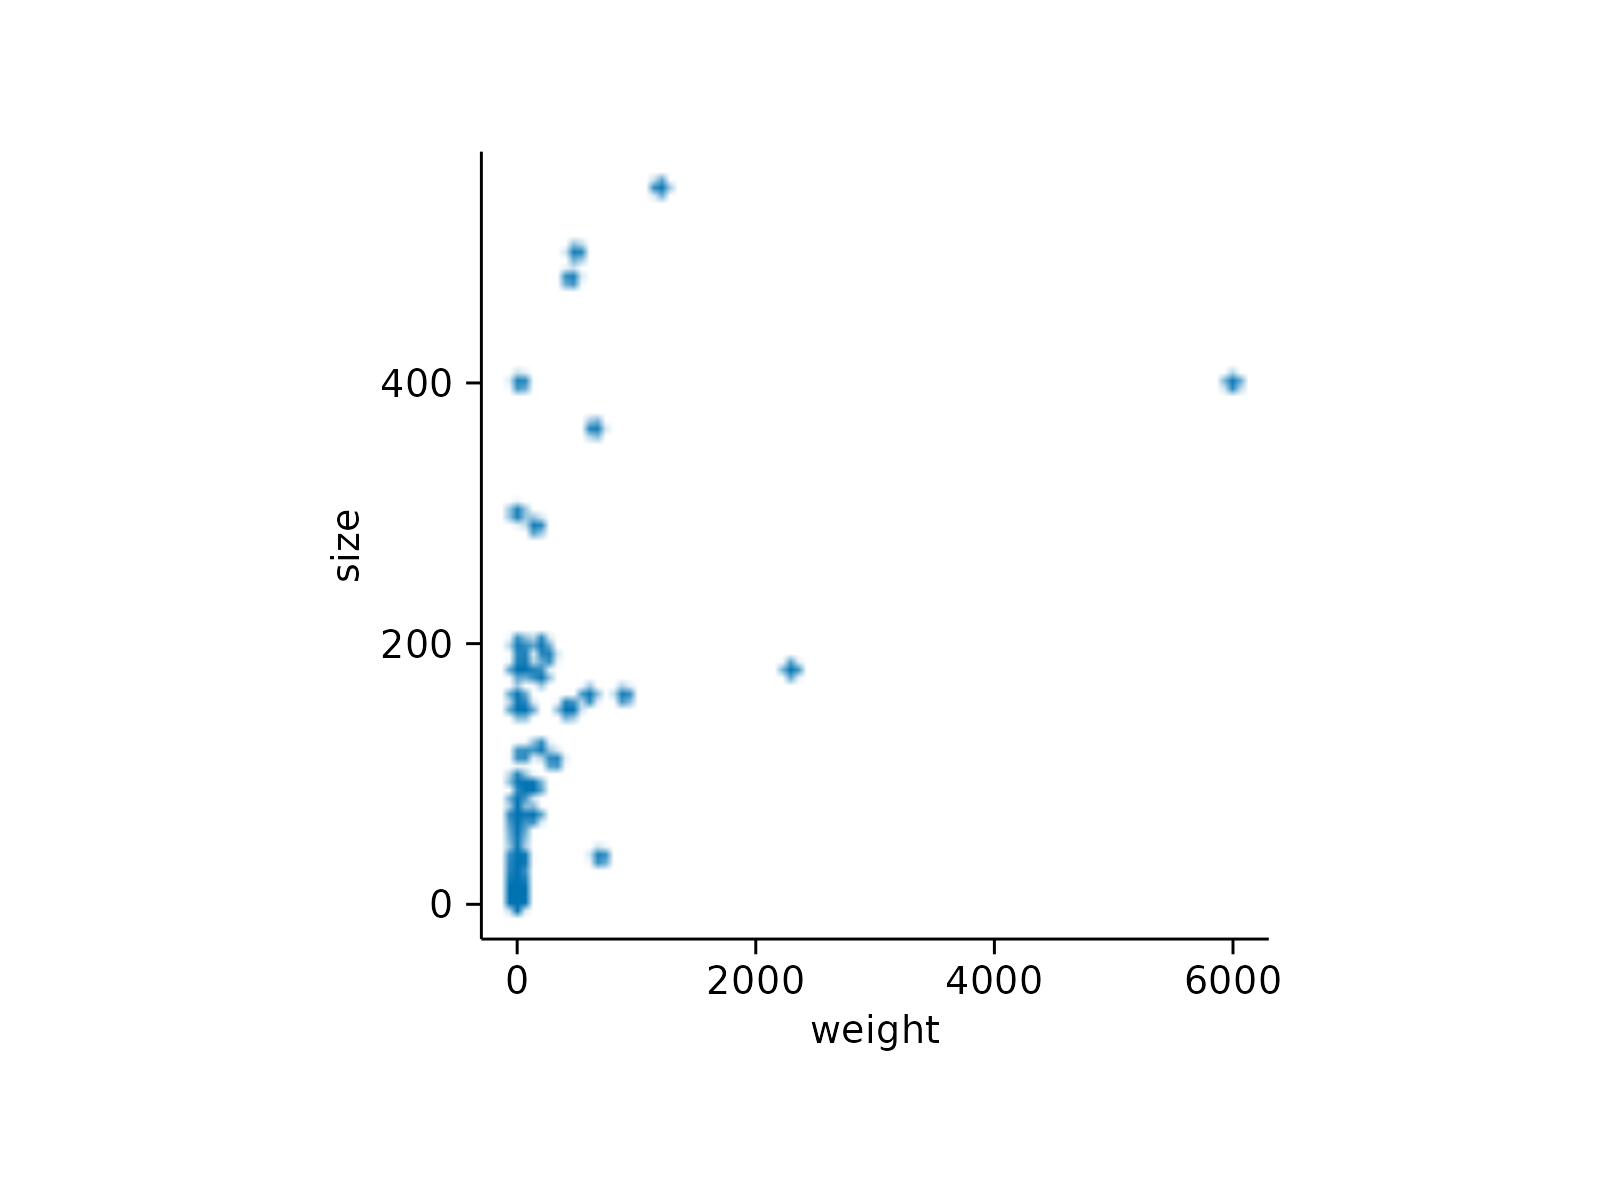
 # Rasterization
animals |>
tidyplot(x = weight, y = size) |>
add_data_points(rasterize = TRUE, rasterize_dpi = 50)
# Rasterization
animals |>
tidyplot(x = weight, y = size) |>
add_data_points(rasterize = TRUE, rasterize_dpi = 50)
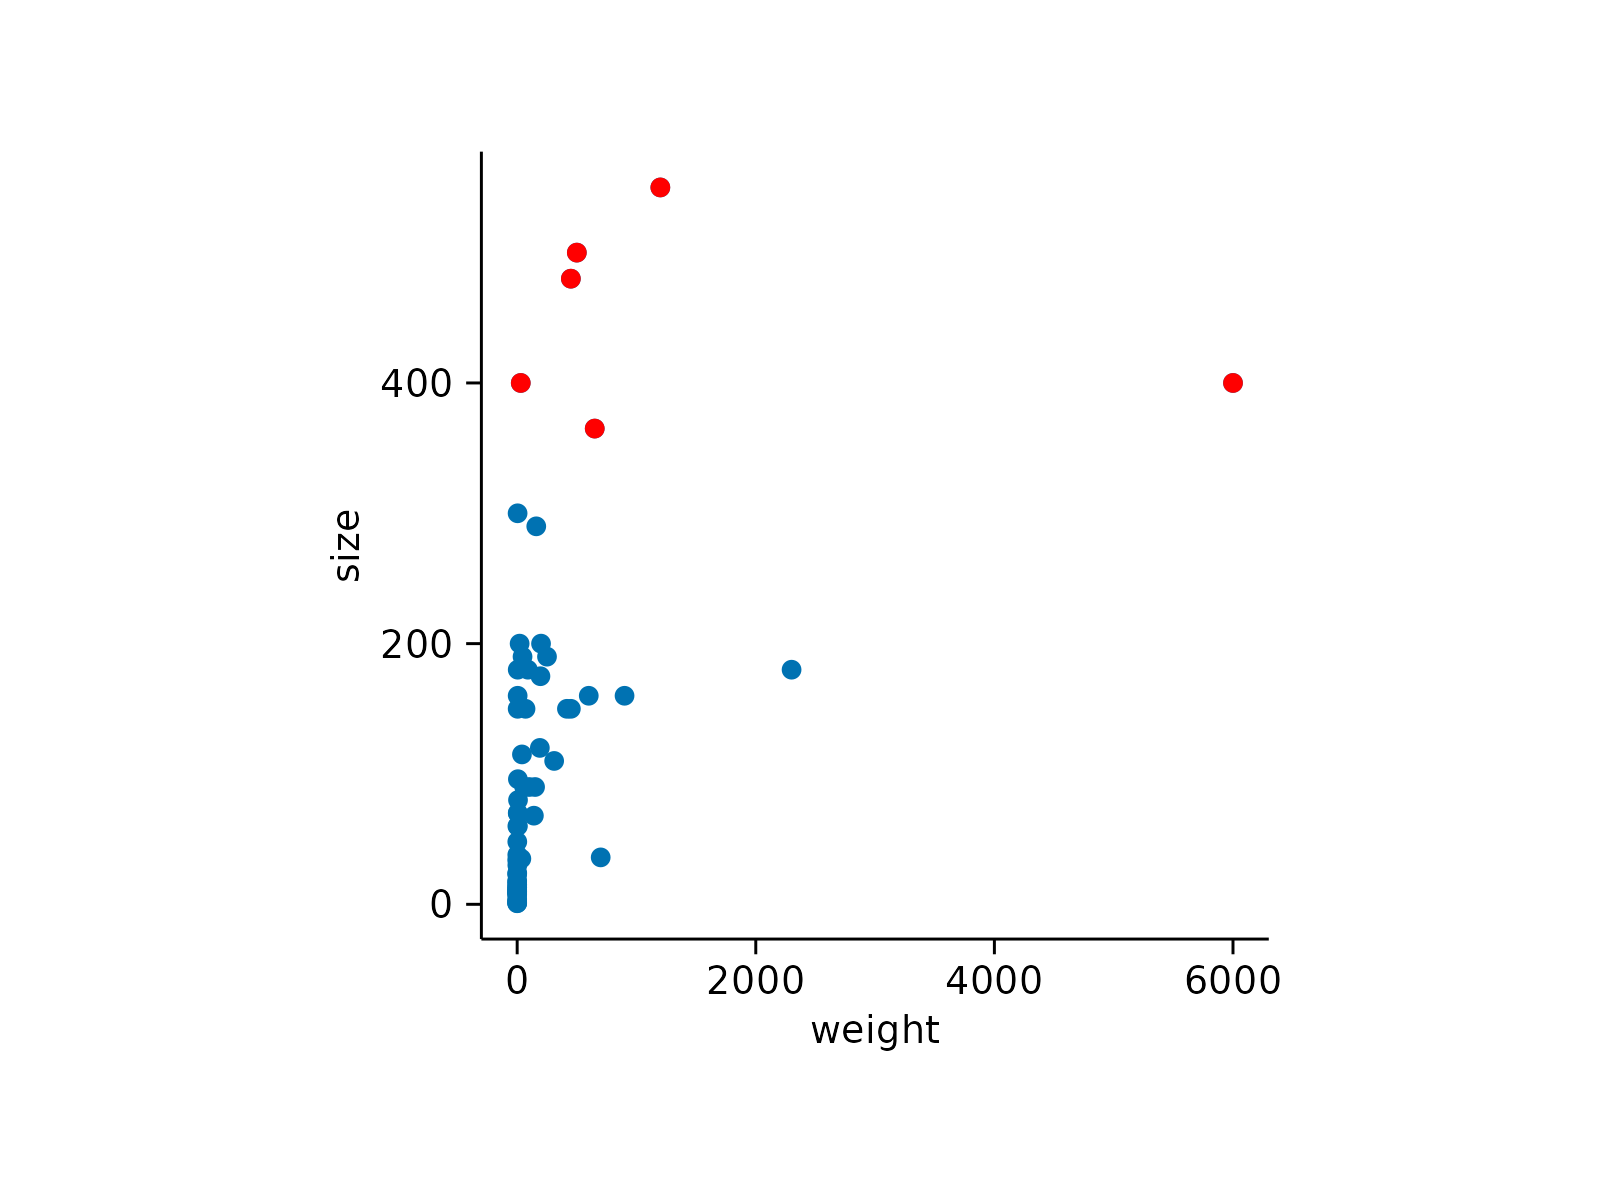
 # Data subsetting
animals |>
tidyplot(x = weight, y = size) |>
add_data_points() |>
add_data_points(data = filter_rows(size > 300), color = "red")
# Data subsetting
animals |>
tidyplot(x = weight, y = size) |>
add_data_points() |>
add_data_points(data = filter_rows(size > 300), color = "red")