Create a new tidyplot
Usage
tidyplot(
  data,
  ...,
  width = NULL,
  height = NULL,
  unit = NULL,
  dodge_width = NULL,
  my_style = NULL,
  paper = NULL,
  ink = NULL
)
Arguments
- data
A tidy
data.frameto use for plotting.- ...
Mappings for the
xaxis,yaxis andcolor, see examples. Additional argument are passed toggplot2::aes().- width, height
Dimensions of the plot area. The default (
NULL) retrieves the setting from the tidyplots options, which defaults to50.NAresults in taking all available space (ggplot2 default).- unit
Unit of the plot area width and height. The default (
NULL) retrieves the setting from the tidyplots options, which defaults to"mm".- dodge_width
For adjusting the distance between grouped objects. The default (
NULL) retrieves the setting from the tidyplots options, which defaults to0.8for plots with at least one discrete axis and to0for plots with two continuous axes.- my_style
Styling function to apply to the plot. The default (
NULL) retrieves the setting from the tidyplots options, which default to no additional styling.- paper
Background color. The default (
NULL) retrieves the setting from the tidyplots options, which defaults to"#FFFFFF".- ink
Foreground color. The default (
NULL) retrieves the setting from the tidyplots options, which defaults to"#000000".
Examples
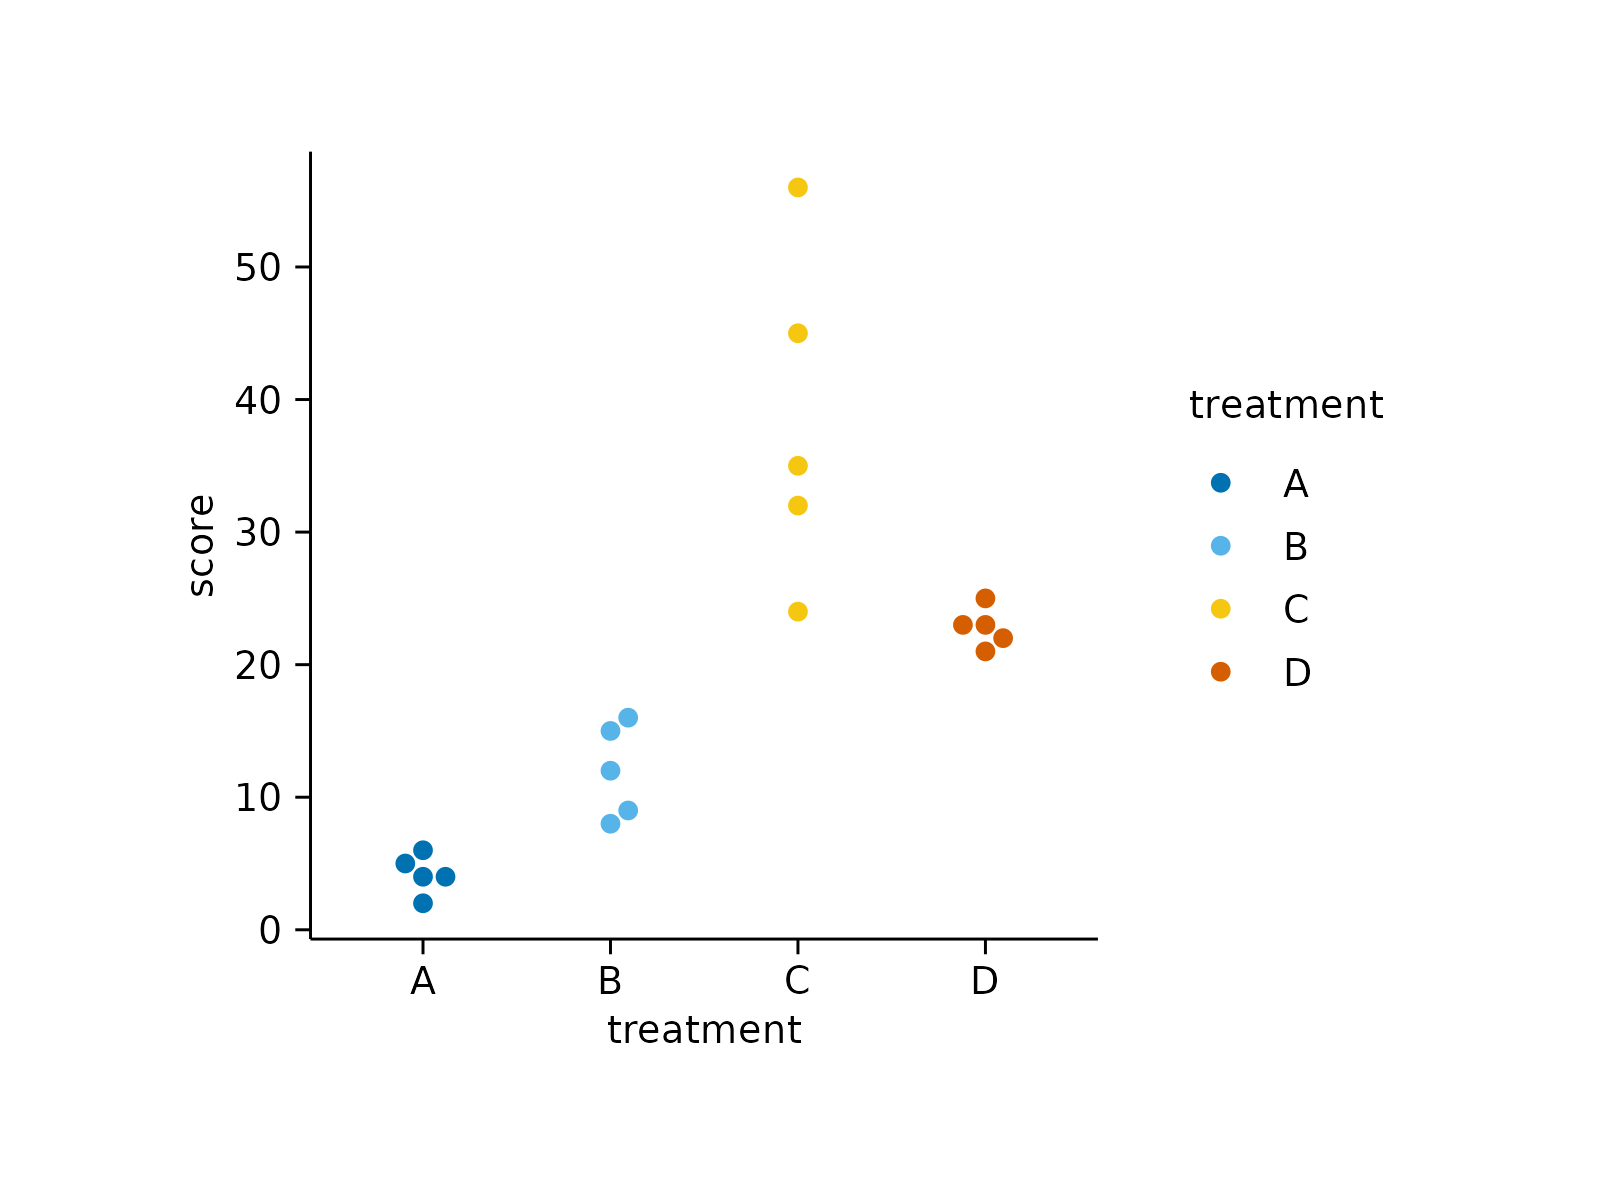
study |>
tidyplot(x = treatment, y = score, color = treatment) |>
add_data_points_beeswarm()
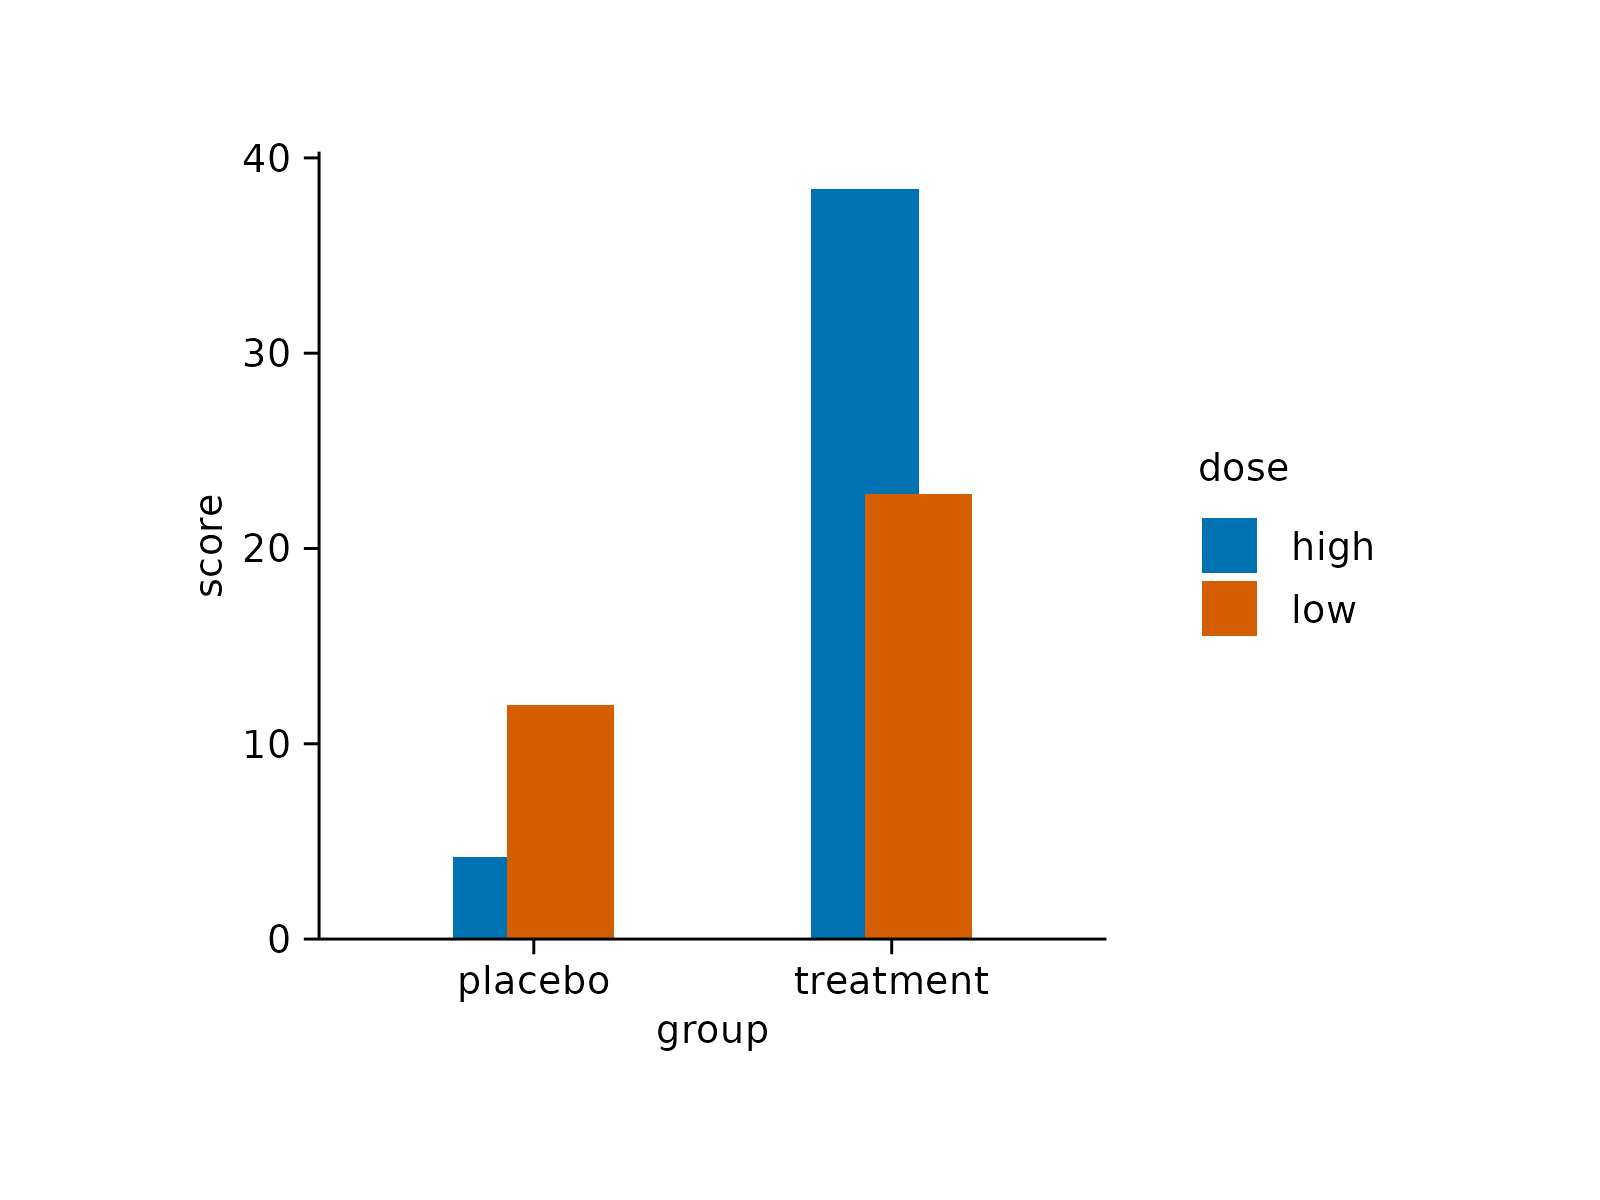
 study |>
tidyplot(x = group, y = score, color = dose) |>
add_mean_bar()
study |>
tidyplot(x = group, y = score, color = dose) |>
add_mean_bar()
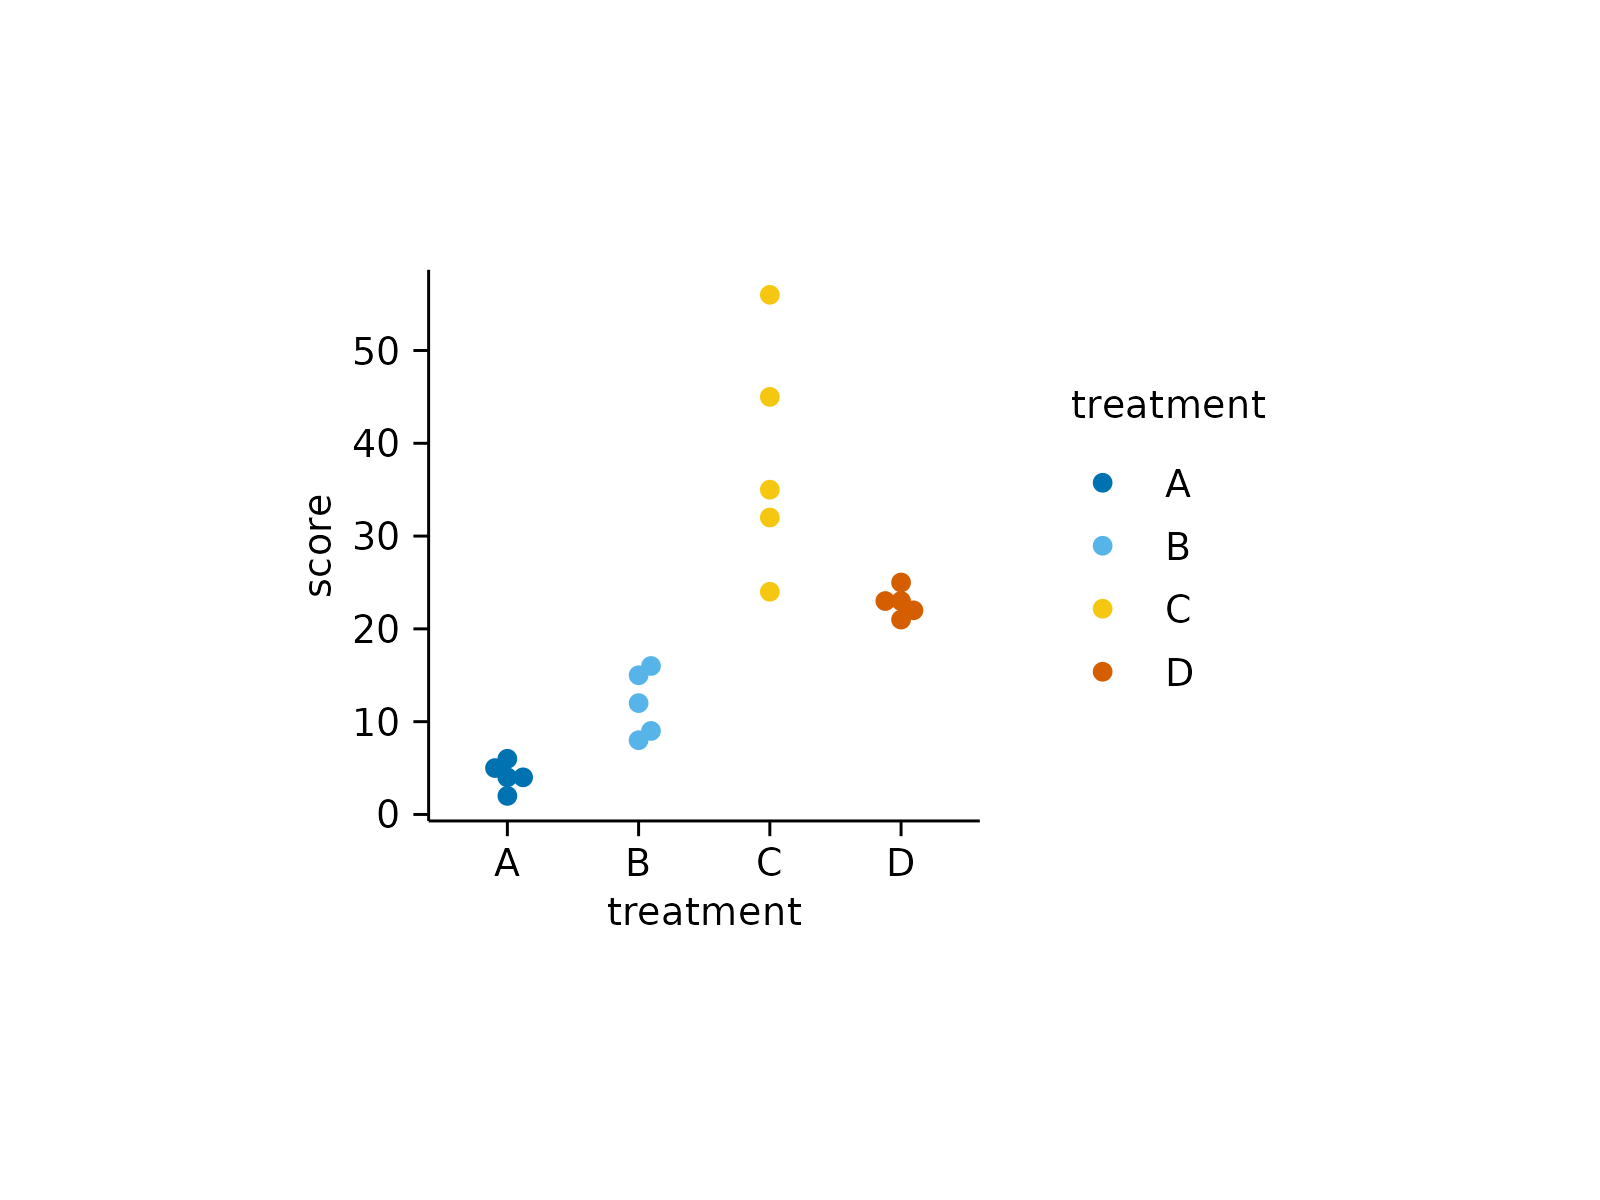
 # Change plot area size
study |>
tidyplot(x = treatment, y = score, color = treatment,
width = 25, height = 25) |>
add_data_points_beeswarm()
# Change plot area size
study |>
tidyplot(x = treatment, y = score, color = treatment,
width = 25, height = 25) |>
add_data_points_beeswarm()
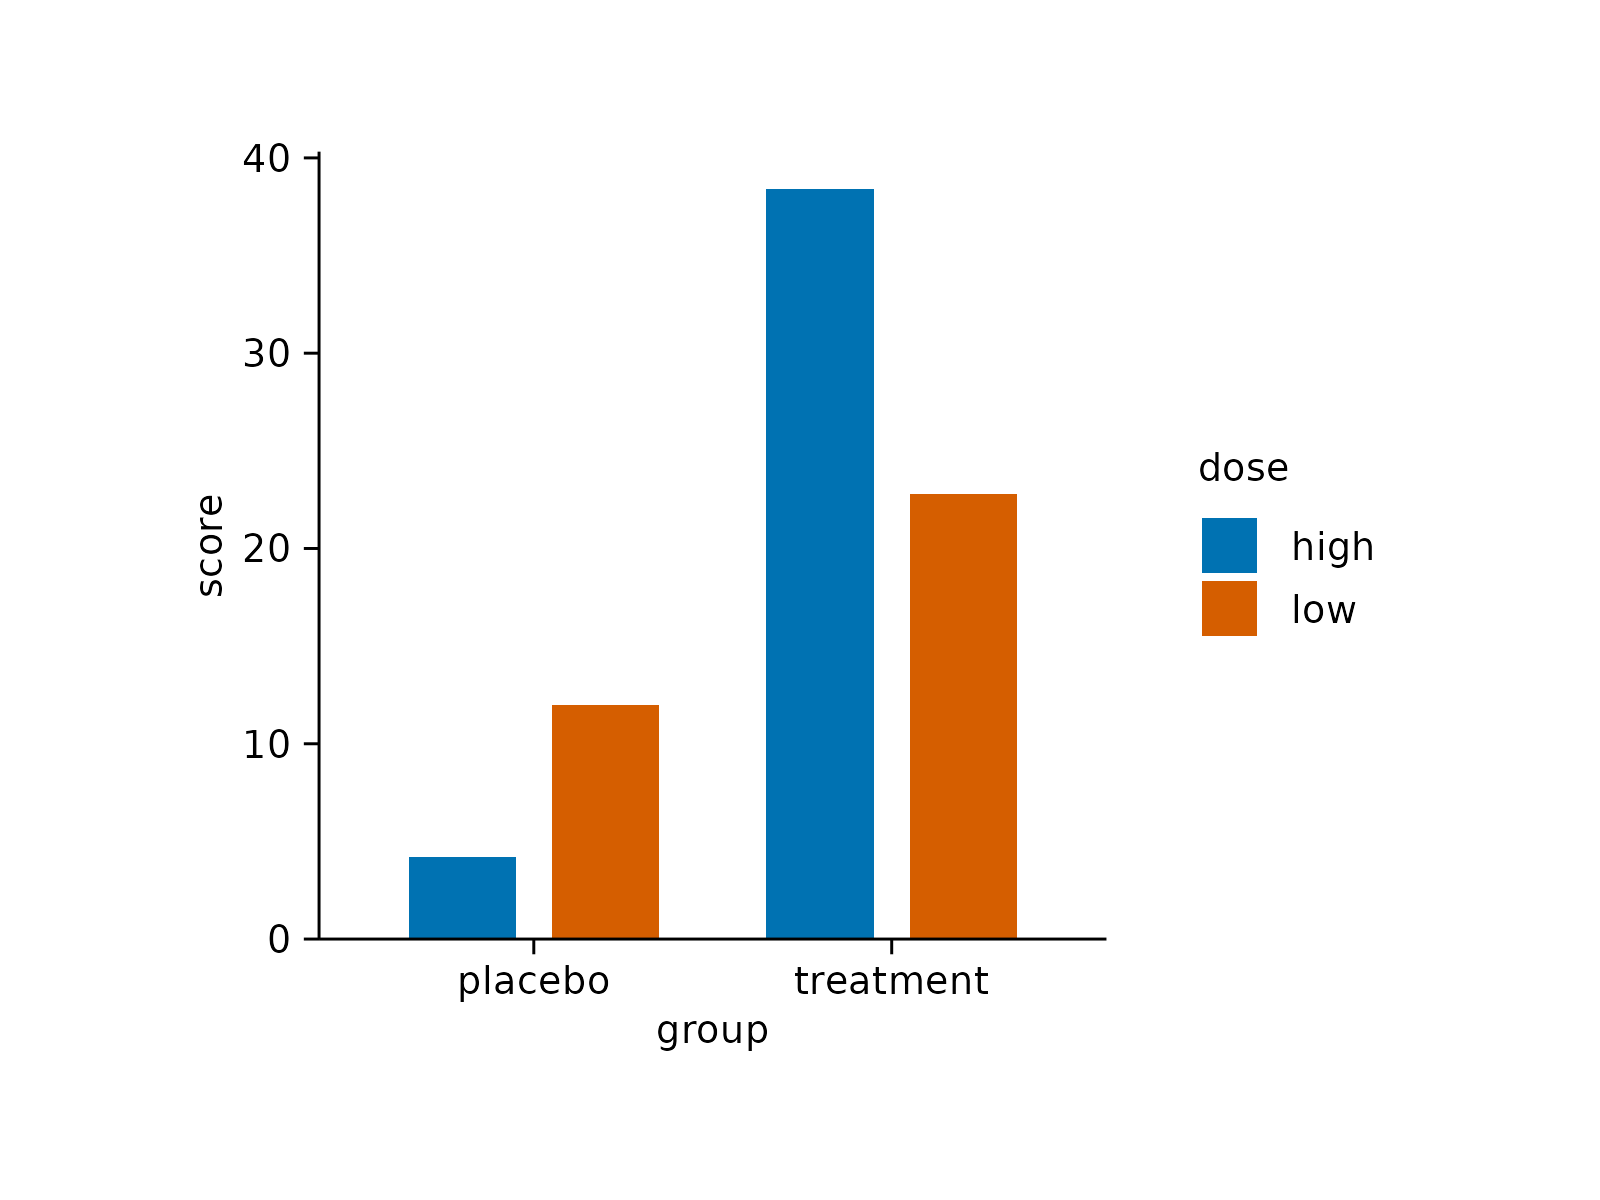
 # Change dodge_width
study |>
tidyplot(x = group, y = score, color = dose, dodge_width = 0.3) |>
add_mean_bar()
# Change dodge_width
study |>
tidyplot(x = group, y = score, color = dose, dodge_width = 0.3) |>
add_mean_bar()