Split plot into multiple subplots
Usage
split_plot(
  plot,
  by = NULL,
  rows = NULL,
  cols = NULL,
  ncol = NULL,
  nrow = NULL,
  axes = "all",
  axis.titles = "all",
  scales = NULL,
  ...
)
Arguments
- plot
A
tidyplotgenerated with the functiontidyplot().- by
One variable that should be used for splitting.
- rows, cols
Two variables that should be used for splitting, representing rows and columns, respectively.
- ncol, nrow
The number of columns and rows per page. Only takes effect when using
byto split by a single variable.- axes
Determines which axes will be drawn in case of fixed scales. When
"margins", axes will be drawn at the exterior margins."all_x"and"all_y"will draw the respective axes at the interior panels too, whereas"all"(the default) will draw all axes at all panels.- axis.titles
Determines which axis titles will be drawn. When
"margins", axis titles will be drawn at the exterior margins."all"(the default) will draw all axis titles at all panels."single"will draw a single axis title per multiplot layout.- scales
Should scales be fixed
"fixed", free ("free"), or free in one dimension ("free_x","free_y")? Defaults to"free"when providing one splitting variable viaby. Defaults to"fixed"when providing two splitting variables viarowsandcols.- ...
Arguments passed on to the
geomfunction.
Examples
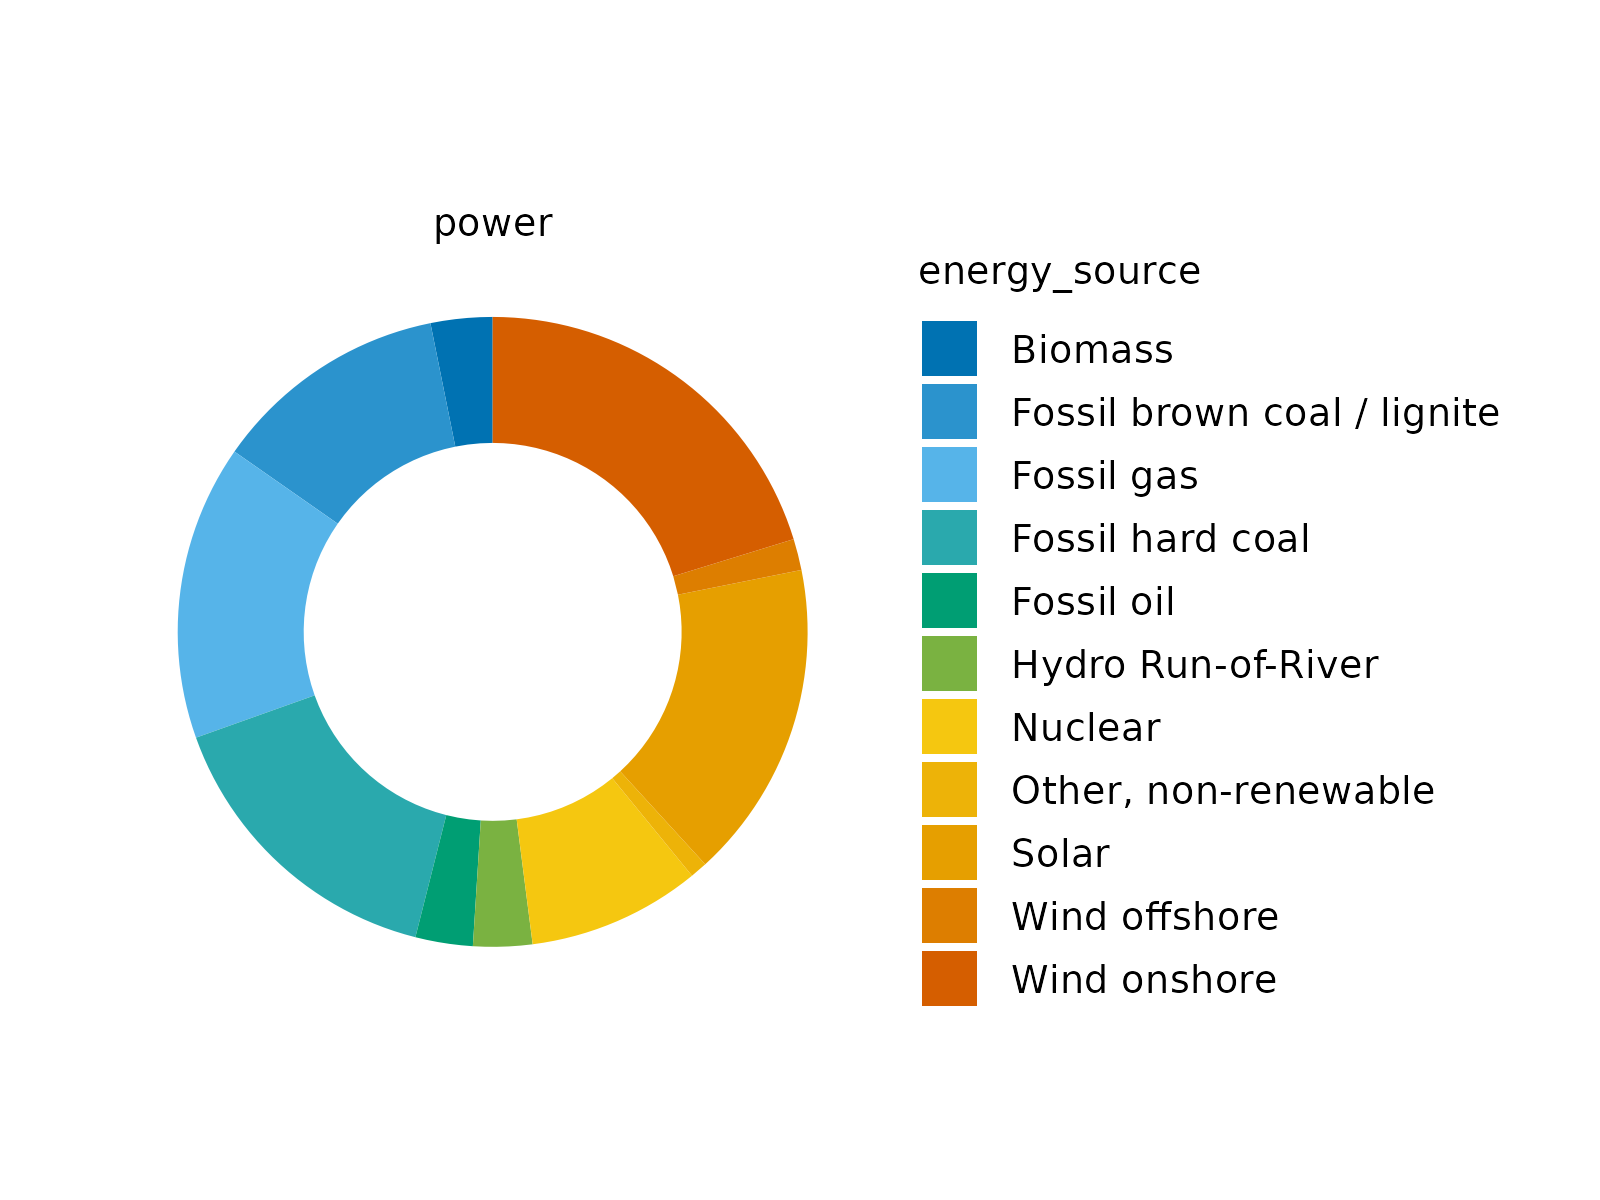
# Before splitting
energy |>
dplyr::filter(year %in% c(2005, 2010, 2015, 2020)) |>
tidyplot(y = energy, color = energy_source) |>
add_donut() |>
adjust_size(width = 25, height = 25)
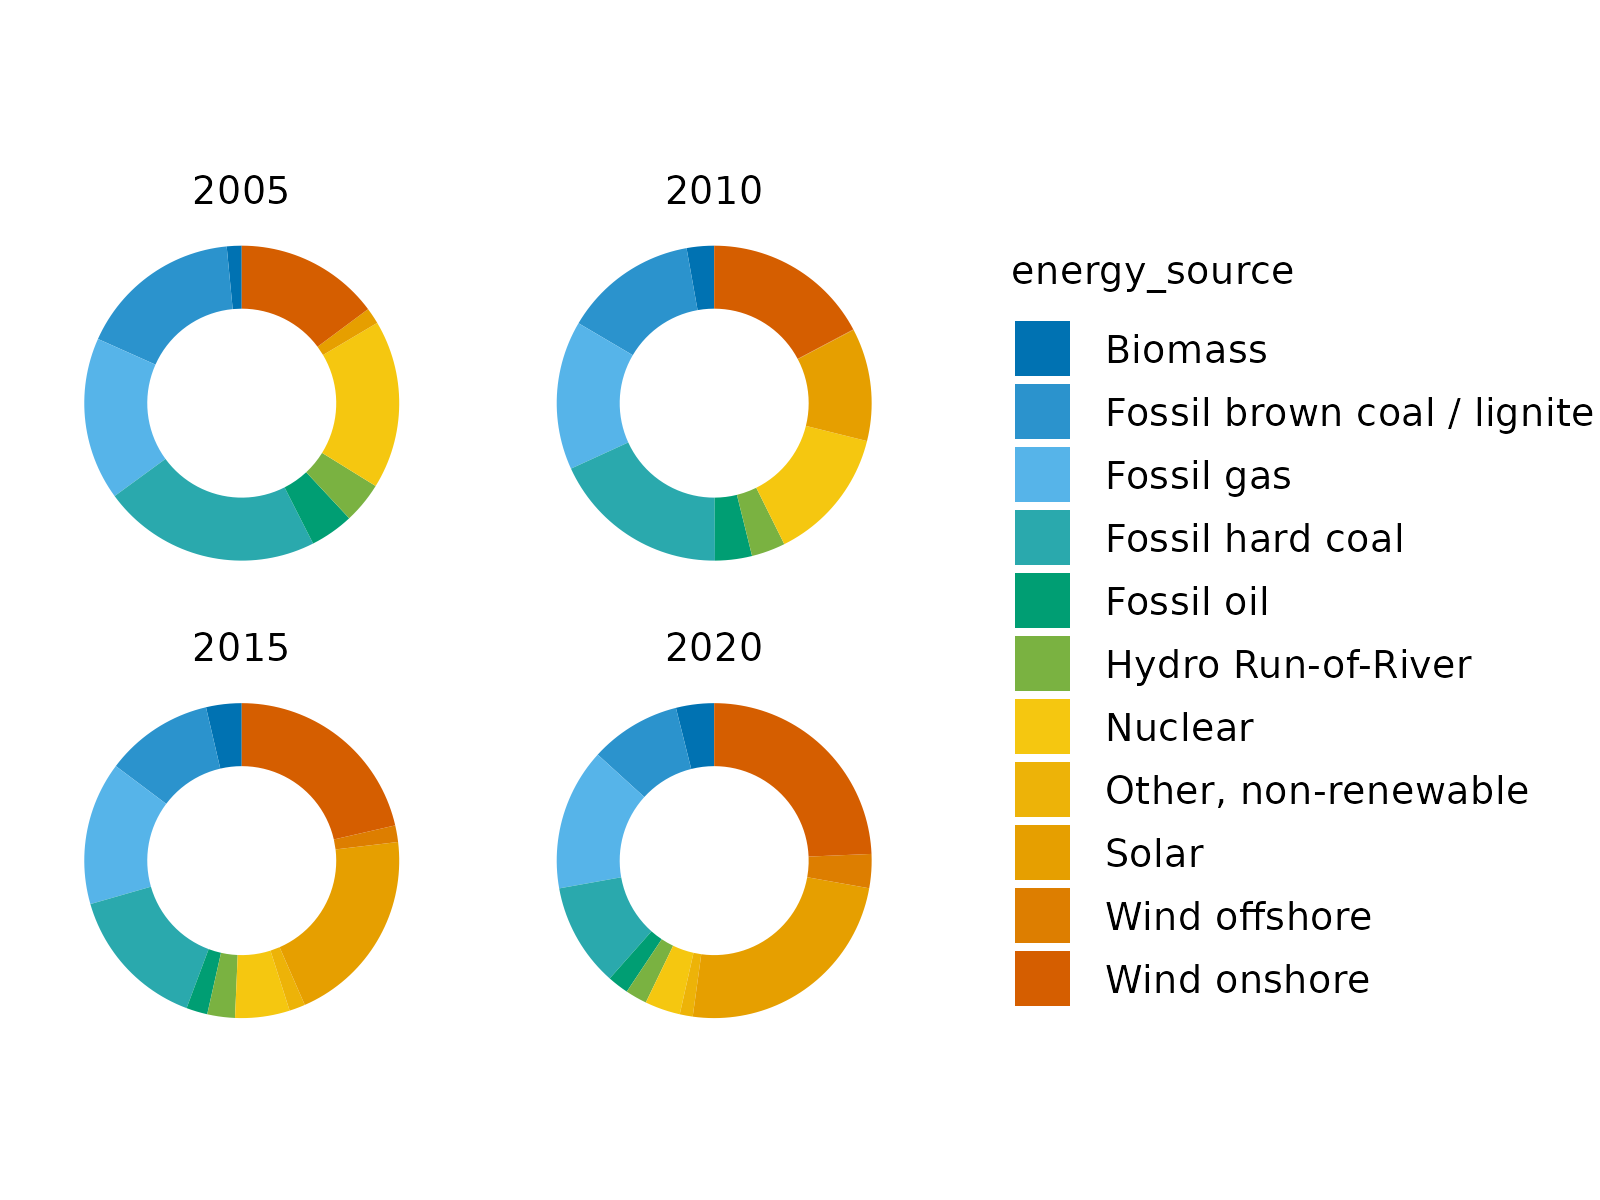
 # Split by year
energy |>
dplyr::filter(year %in% c(2005, 2010, 2015, 2020)) |>
tidyplot(y = energy, color = energy_source) |>
add_donut() |>
adjust_size(width = 25, height = 25) |>
split_plot(by = year)
# Split by year
energy |>
dplyr::filter(year %in% c(2005, 2010, 2015, 2020)) |>
tidyplot(y = energy, color = energy_source) |>
add_donut() |>
adjust_size(width = 25, height = 25) |>
split_plot(by = year)
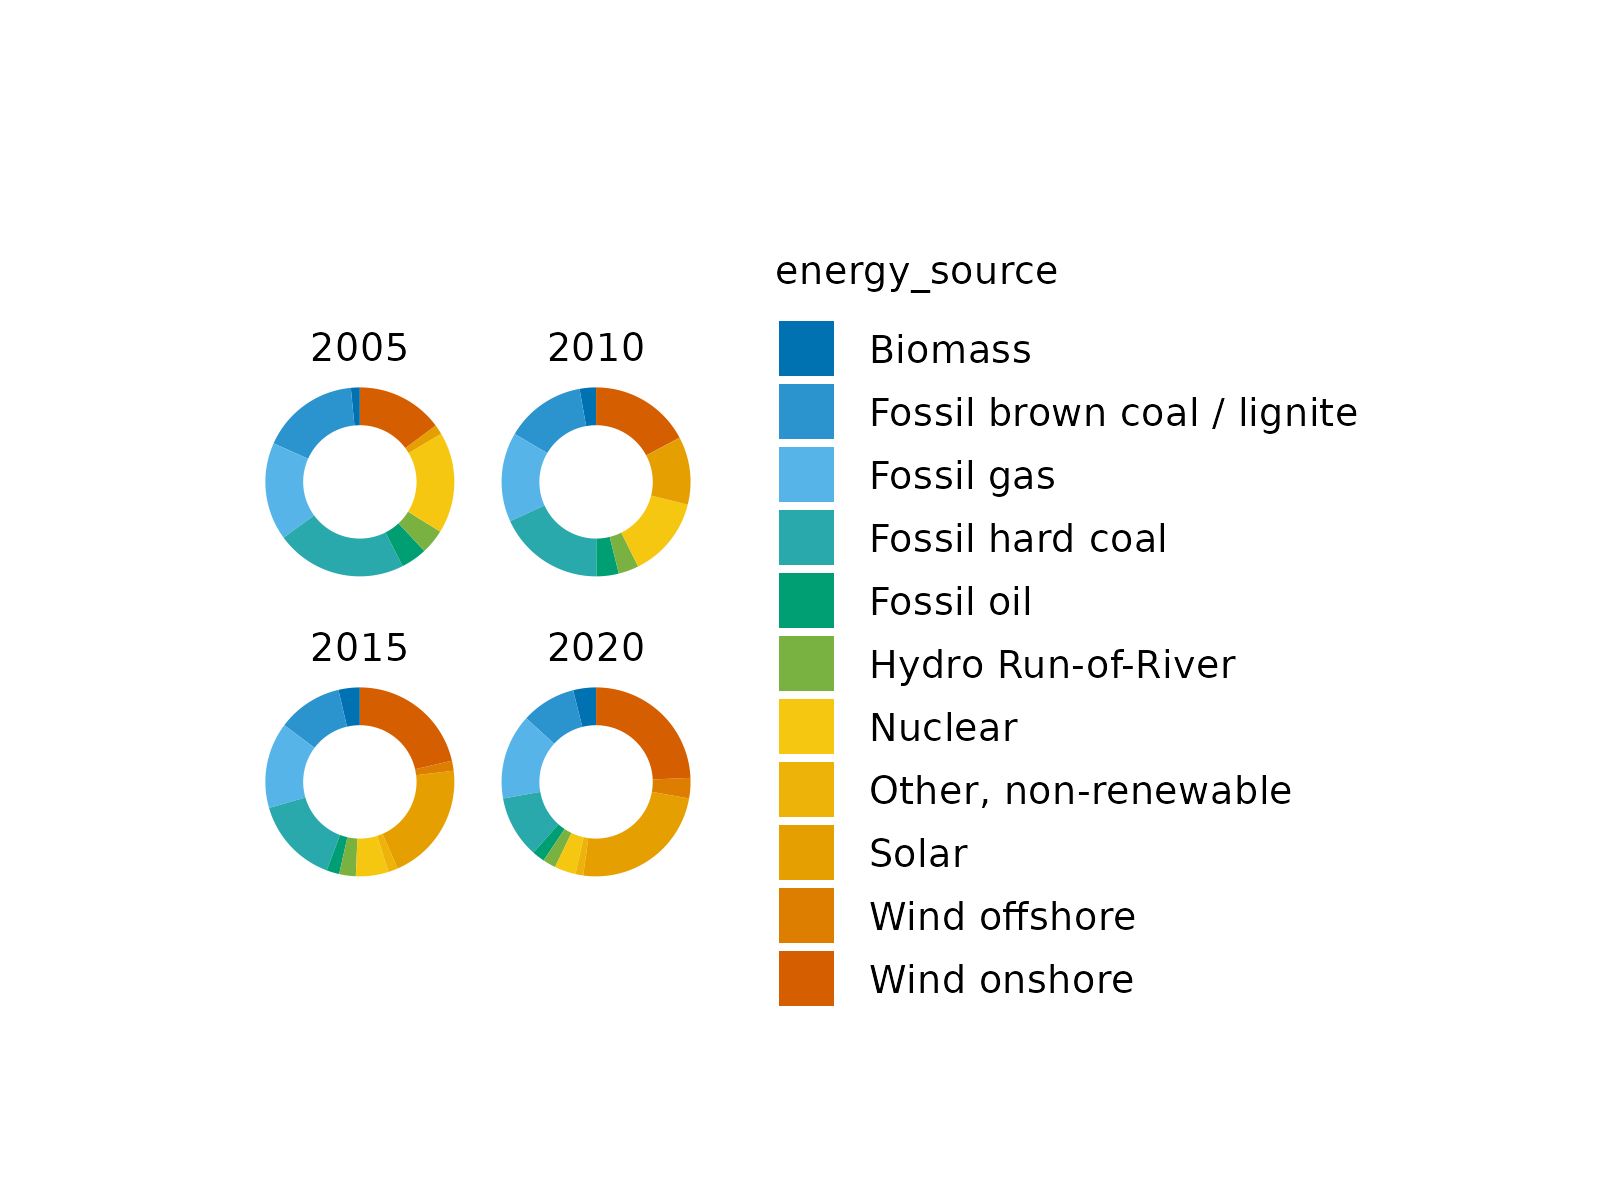
 # Change dimensions of subplots
energy |>
dplyr::filter(year %in% c(2005, 2010, 2015, 2020)) |>
tidyplot(y = energy, color = energy_source) |>
add_donut() |>
adjust_size(width = 15, height = 15) |>
split_plot(by = year)
# Change dimensions of subplots
energy |>
dplyr::filter(year %in% c(2005, 2010, 2015, 2020)) |>
tidyplot(y = energy, color = energy_source) |>
add_donut() |>
adjust_size(width = 15, height = 15) |>
split_plot(by = year)
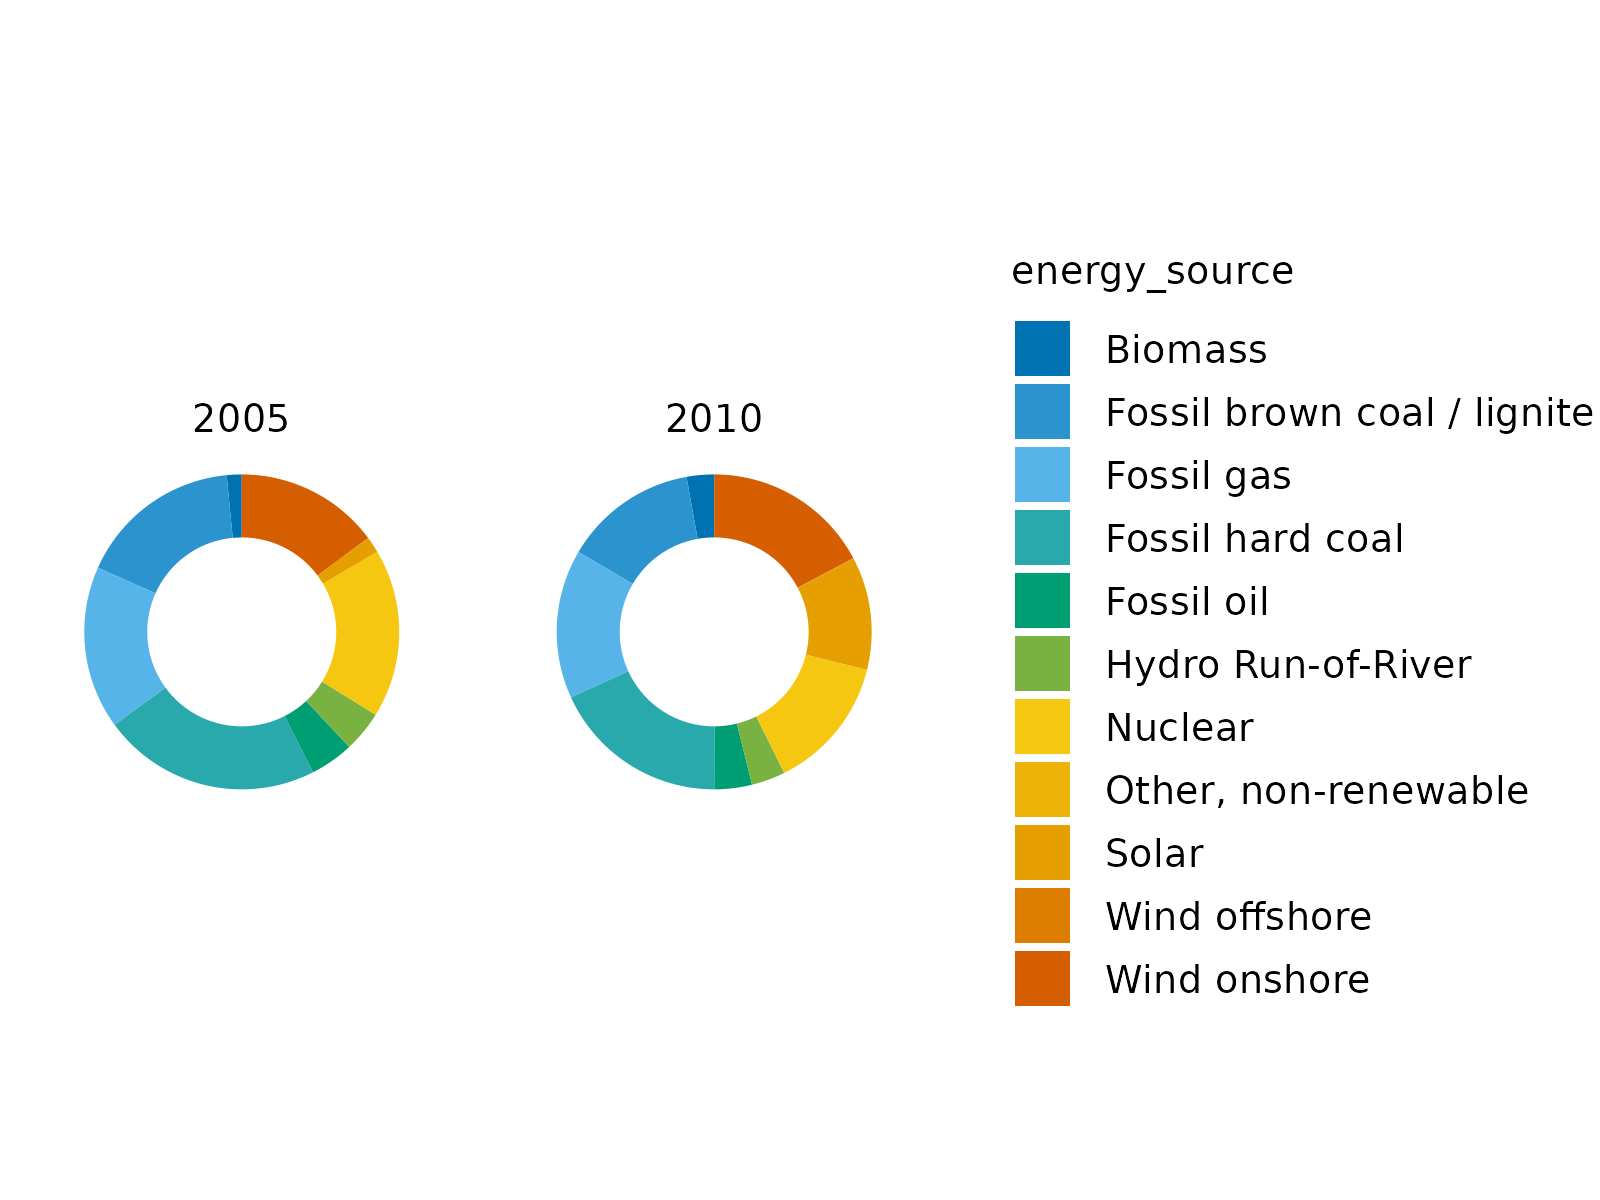
 # Spread plots across multiple pages
energy |>
dplyr::filter(year %in% c(2005, 2010, 2015, 2020)) |>
tidyplot(y = energy, color = energy_source) |>
add_donut() |>
adjust_size(width = 25, height = 25) |>
split_plot(by = year, ncol = 2, nrow = 1)
#> ✔ split_plot: split into 4 plots across 2 pages
#> [[1]]
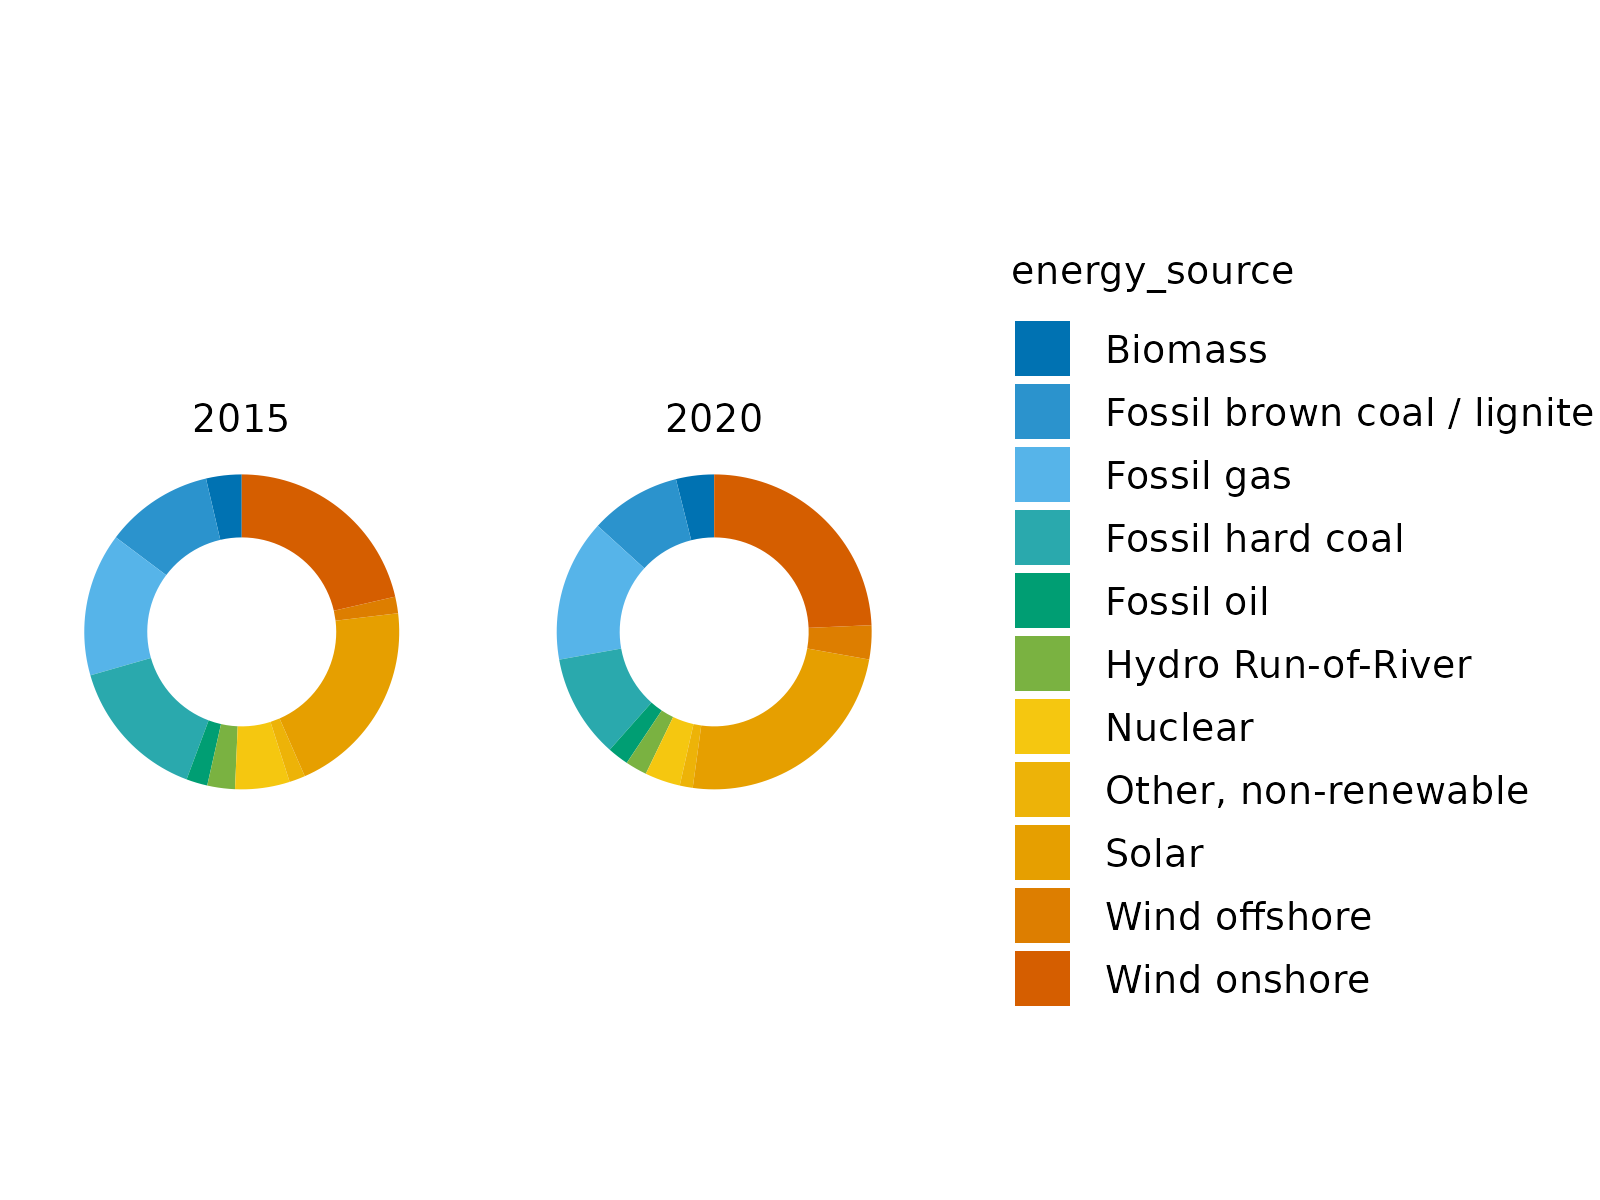
# Spread plots across multiple pages
energy |>
dplyr::filter(year %in% c(2005, 2010, 2015, 2020)) |>
tidyplot(y = energy, color = energy_source) |>
add_donut() |>
adjust_size(width = 25, height = 25) |>
split_plot(by = year, ncol = 2, nrow = 1)
#> ✔ split_plot: split into 4 plots across 2 pages
#> [[1]]
 #>
#> [[2]]
#>
#> [[2]]
 #>
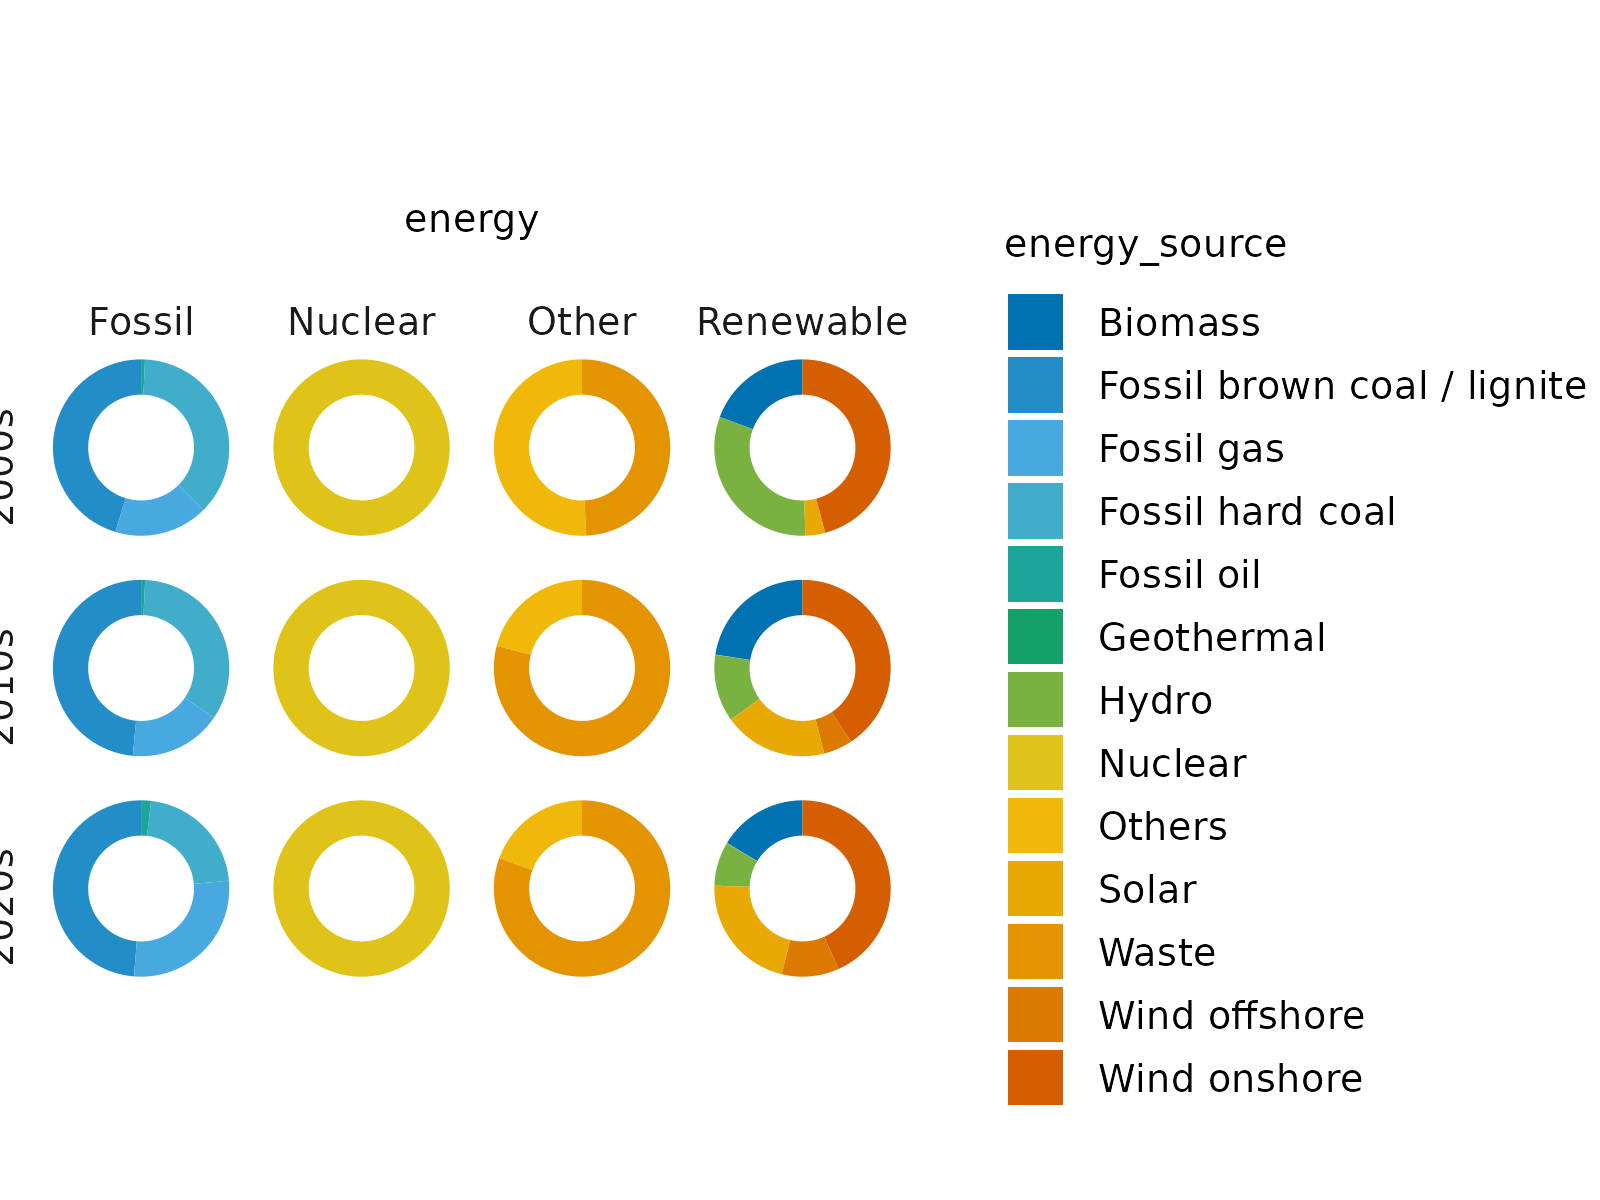
# Split by two variables
energy |>
dplyr::mutate(decade = paste0(floor(year / 10) * 10, "s")) |>
tidyplot(y = energy, color = energy_source) |>
add_donut() |>
adjust_size(14,14) |>
split_plot(rows = decade, cols = energy_type)
#>
# Split by two variables
energy |>
dplyr::mutate(decade = paste0(floor(year / 10) * 10, "s")) |>
tidyplot(y = energy, color = energy_source) |>
add_donut() |>
adjust_size(14,14) |>
split_plot(rows = decade, cols = energy_type)