View plot on screen
Arguments
- plot
A
tidyplotgenerated with the functiontidyplot().- data
The data to be displayed in this layer. There are three options:
If
all_rows()(the default) the complete dataset is displayed.A
functionto subset the plot data. Seefilter_rows()and friends.A
data.frameto override the plot data.
- title
Plot title.
- ...
Arguments passed on to
print().
Details
view_plot()supports data subsetting. See examples and Advanced plotting.
Examples
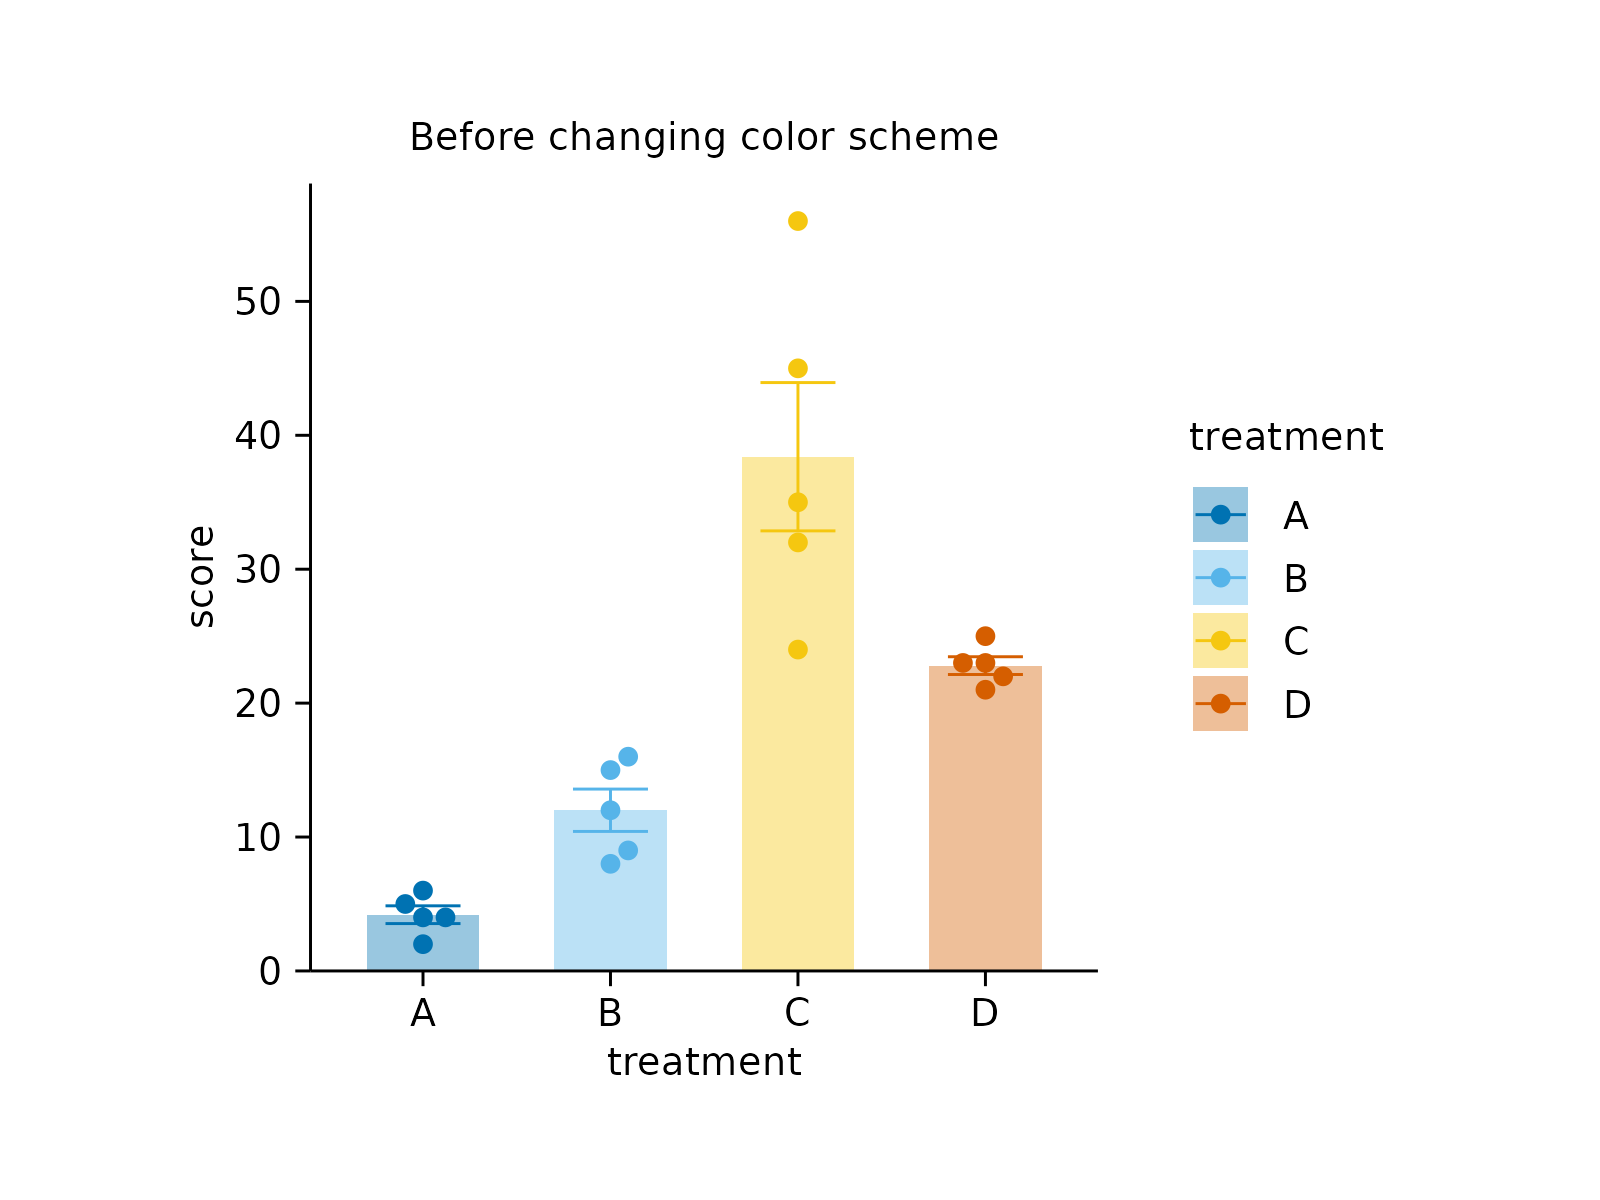
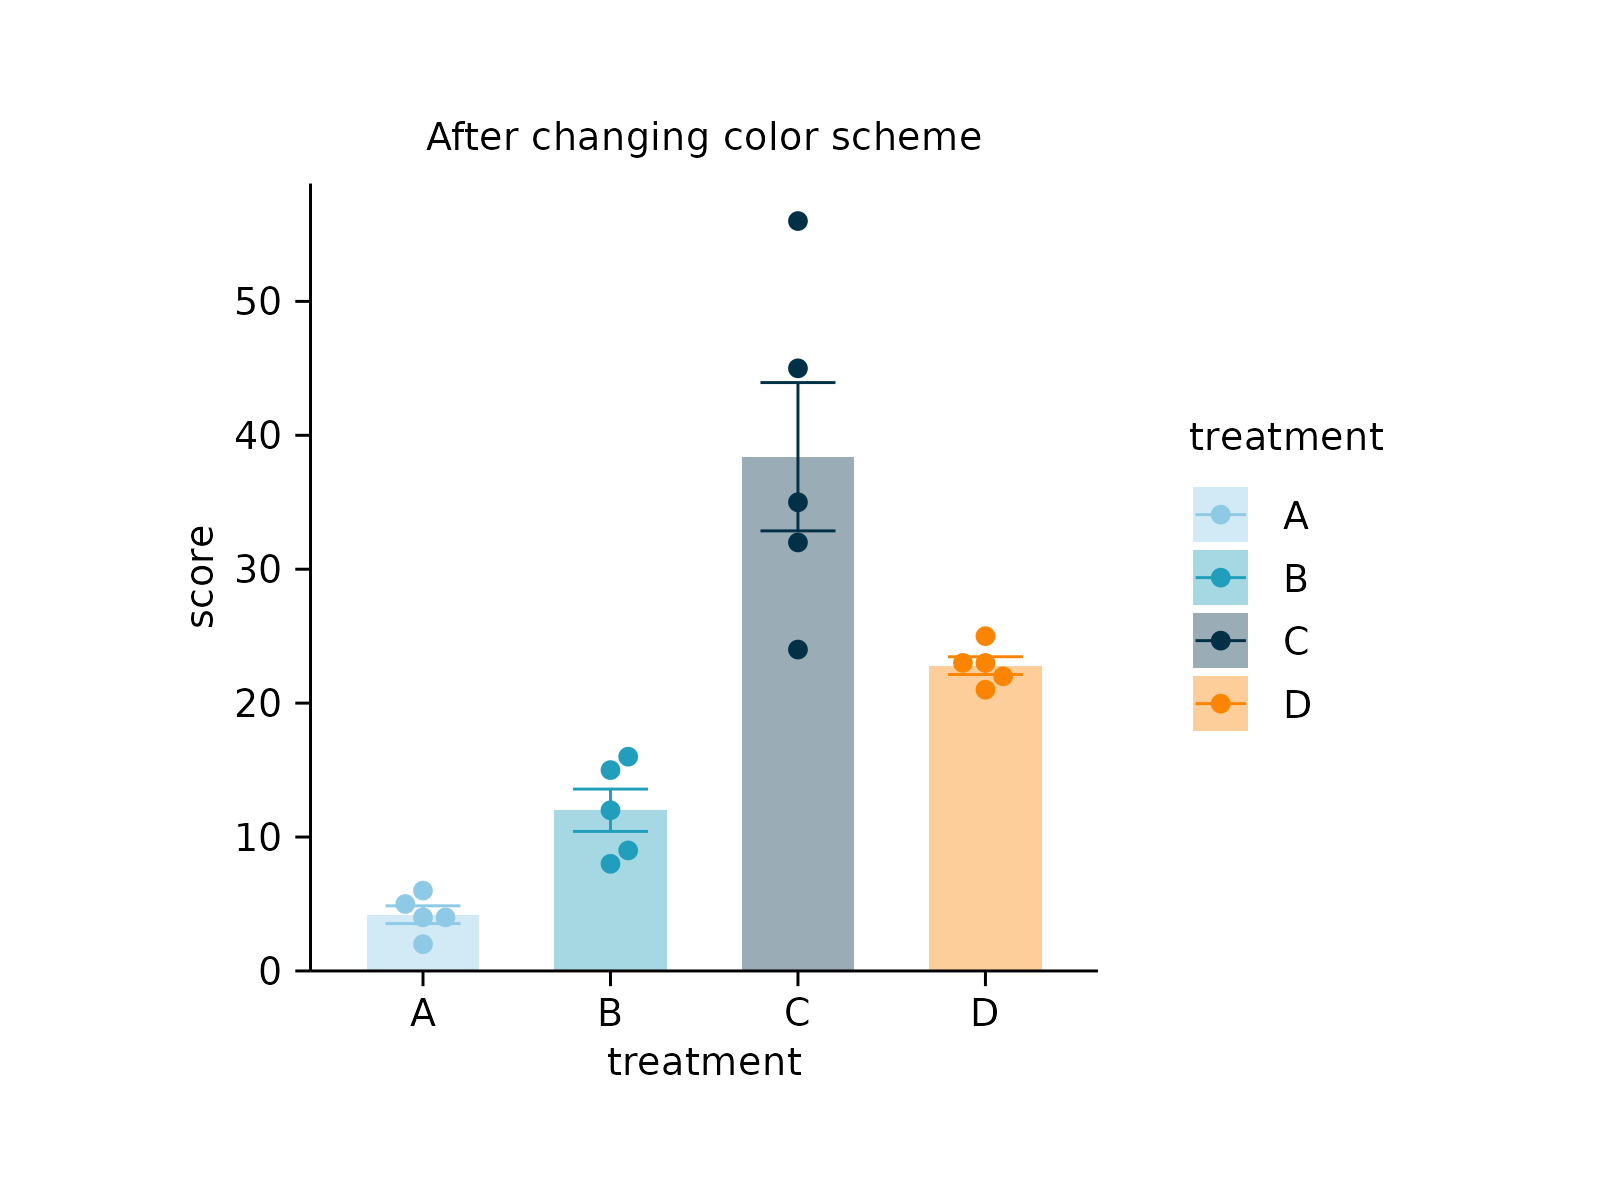
# View intermediate stages on screen
study |>
tidyplot(x = treatment, y = score, color = treatment) |>
add_mean_bar(alpha = 0.4) |>
add_sem_errorbar() |>
add_data_points_beeswarm() |>
view_plot(title = "Before changing color scheme") |>
adjust_colors(colors_discrete_seaside) |>
view_plot(title = "After changing color scheme")
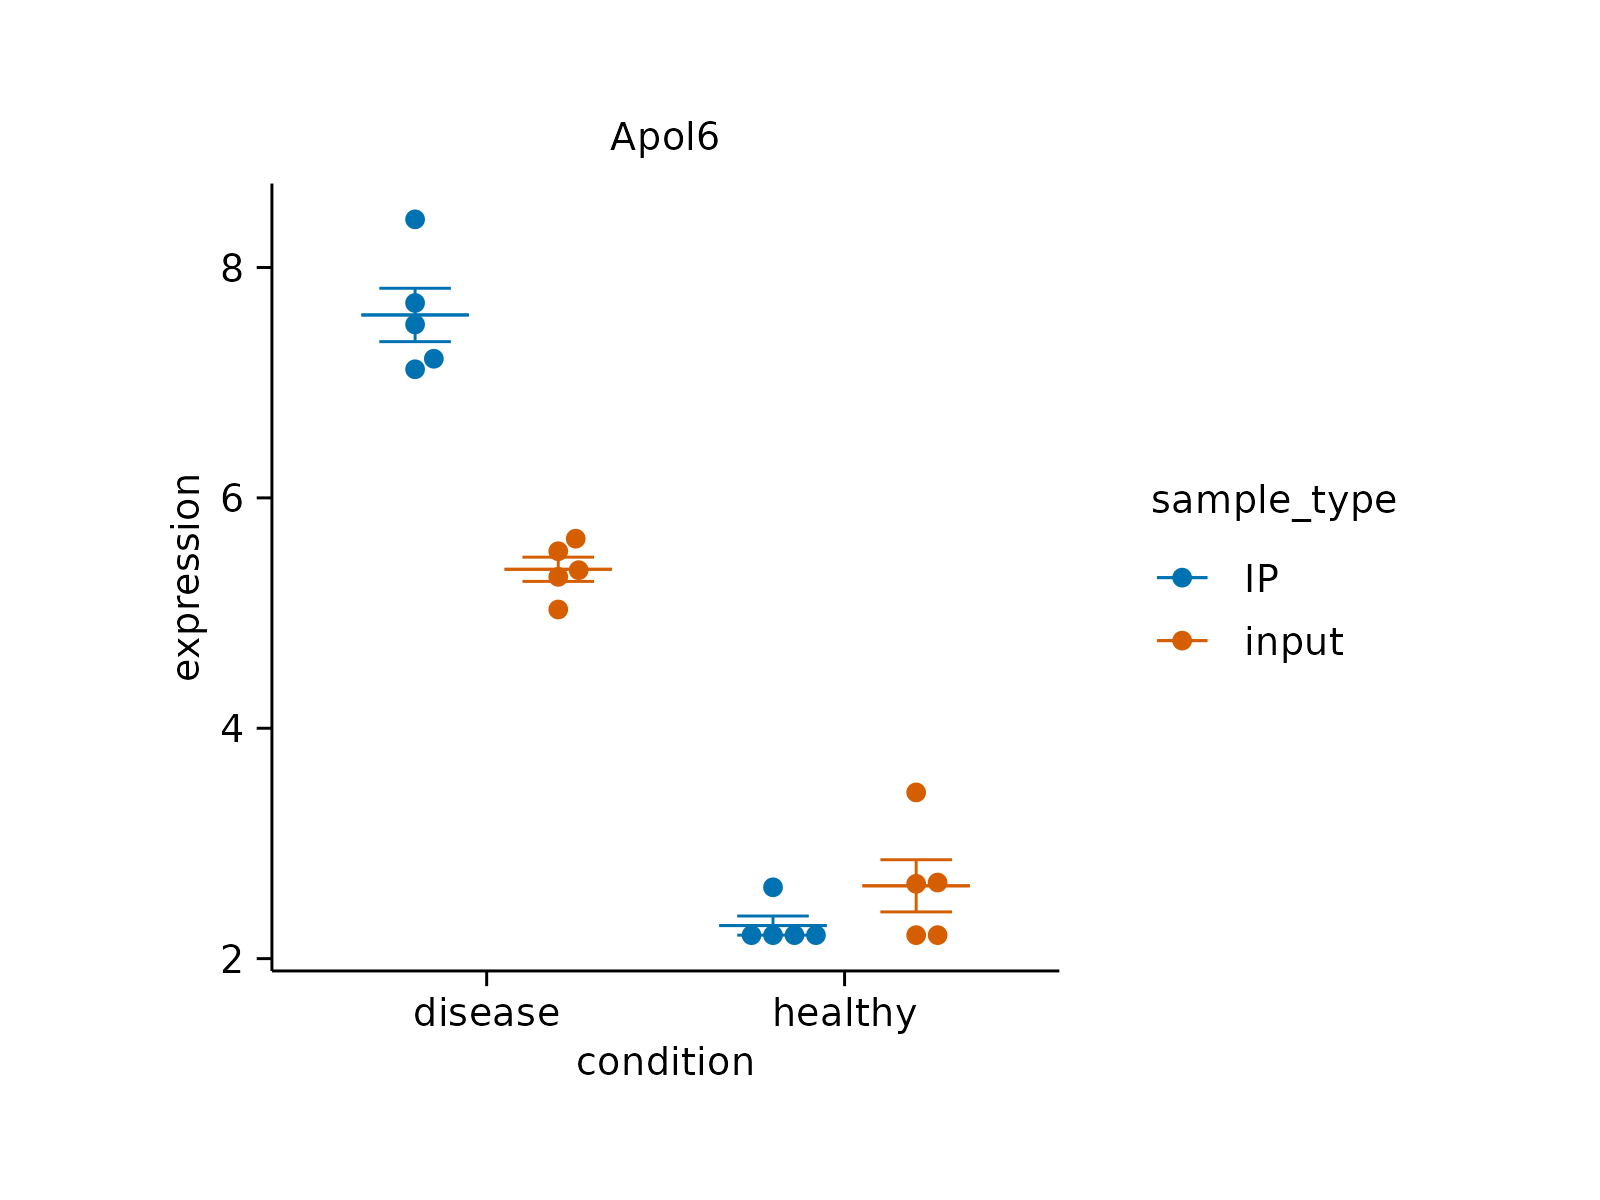
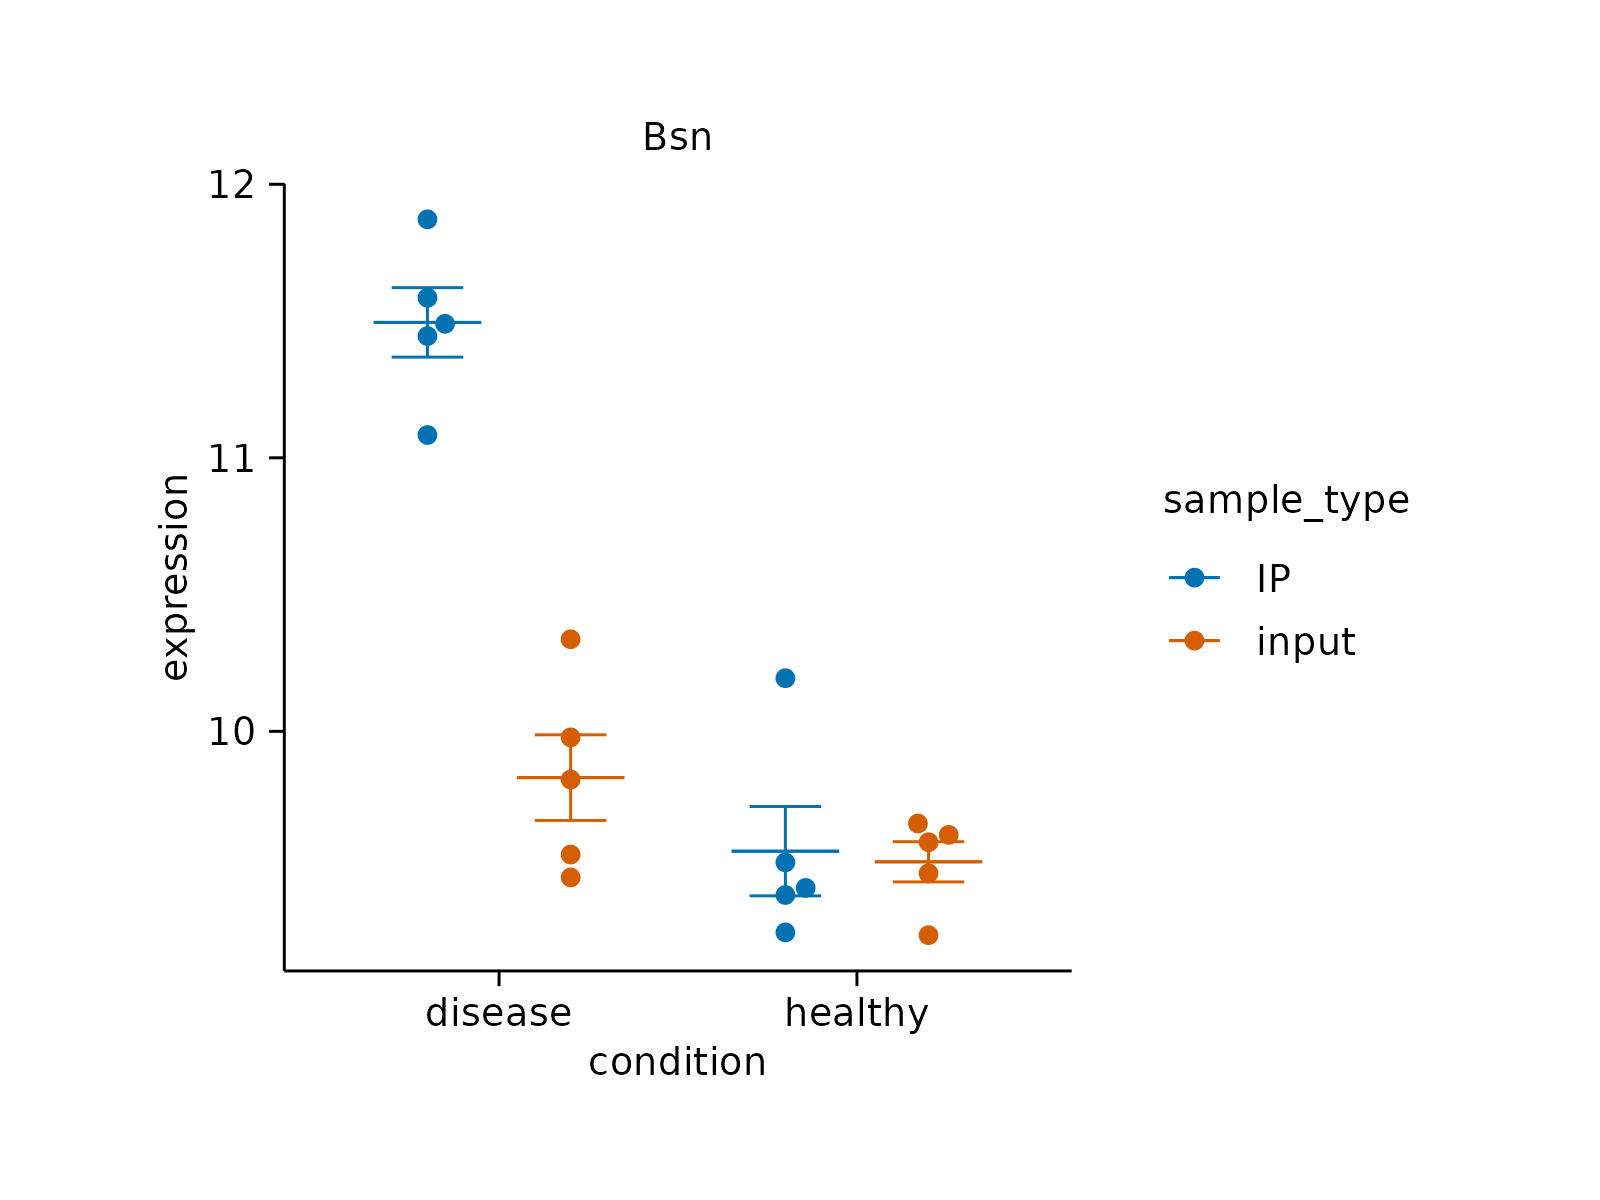
 # View data subsets on screen
gene_expression |>
tidyplot(x = condition, y = expression, color = sample_type) |>
add_mean_dash() |>
add_sem_errorbar() |>
add_data_points_beeswarm() |>
view_plot(data = filter_rows(external_gene_name == "Apol6"),
title = "Apol6") |>
view_plot(data = filter_rows(external_gene_name == "Bsn"),
title = "Bsn")
# View data subsets on screen
gene_expression |>
tidyplot(x = condition, y = expression, color = sample_type) |>
add_mean_dash() |>
add_sem_errorbar() |>
add_data_points_beeswarm() |>
view_plot(data = filter_rows(external_gene_name == "Apol6"),
title = "Apol6") |>
view_plot(data = filter_rows(external_gene_name == "Bsn"),
title = "Bsn")