Subset data rows
Usage
all_rows()

filter_rows(..., .by = NULL)

max_rows(order_by, n, by = NULL, with_ties = TRUE, na_rm = FALSE)

min_rows(order_by, n, by = NULL, with_ties = TRUE, na_rm = FALSE)

first_rows(n, by = NULL)

last_rows(n, by = NULL)

sample_rows(n, by = NULL)
Arguments
- ...
<
data-masking> Expressions that return a logical vector, defined in terms of the variables in.data. If multiple expressions are included, they are combined with the&operator. To combine expressions using|instead, wrap them inwhen_any(). Only rows for which all expressions evaluate toTRUEare kept (forfilter()) or dropped (forfilter_out()).- .by, by
<
tidy-select> Optionally, a selection of columns to group by for just this operation, functioning as an alternative togroup_by(). For details and examples, see ?dplyr_by.- order_by
<
data-masking> Variable or function of variables to order by. To order by multiple variables, wrap them in a data frame or tibble.- n
The number of rows to select. If not are supplied,
n = 1will be used. Ifnis greater than the number of rows in the group, the result will be silently truncated to the group size.A negative value of
nwill be subtracted from the group size. For example,n = -2with a group of 5 rows will select 5 - 2 = 3 rows.- with_ties
Should ties be kept together? The default,
TRUE, may return more rows than you request. UseFALSEto ignore ties, and return the firstnrows.- na_rm
Should missing values in
order_bybe removed from the result? IfFALSE,NAvalues are sorted to the end (like indplyr::arrange()), so they will only be included if there are insufficient non-missing values to reachn.
Examples
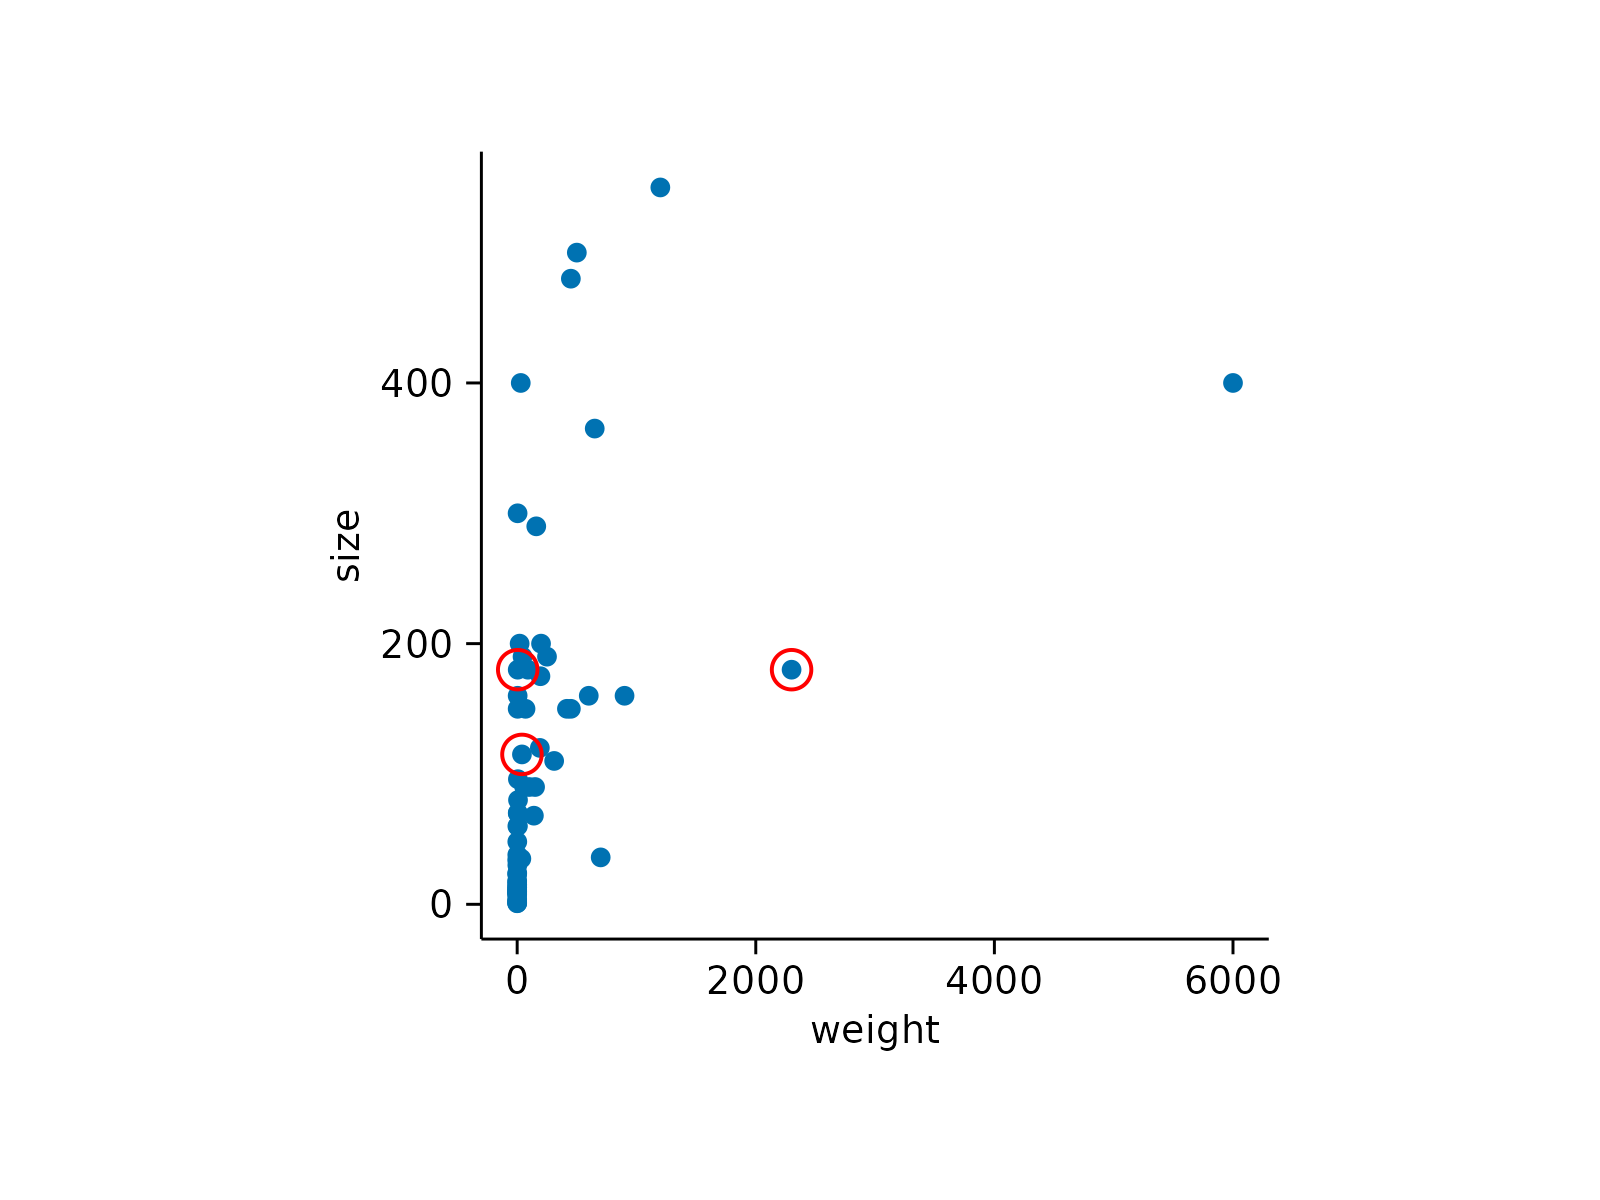
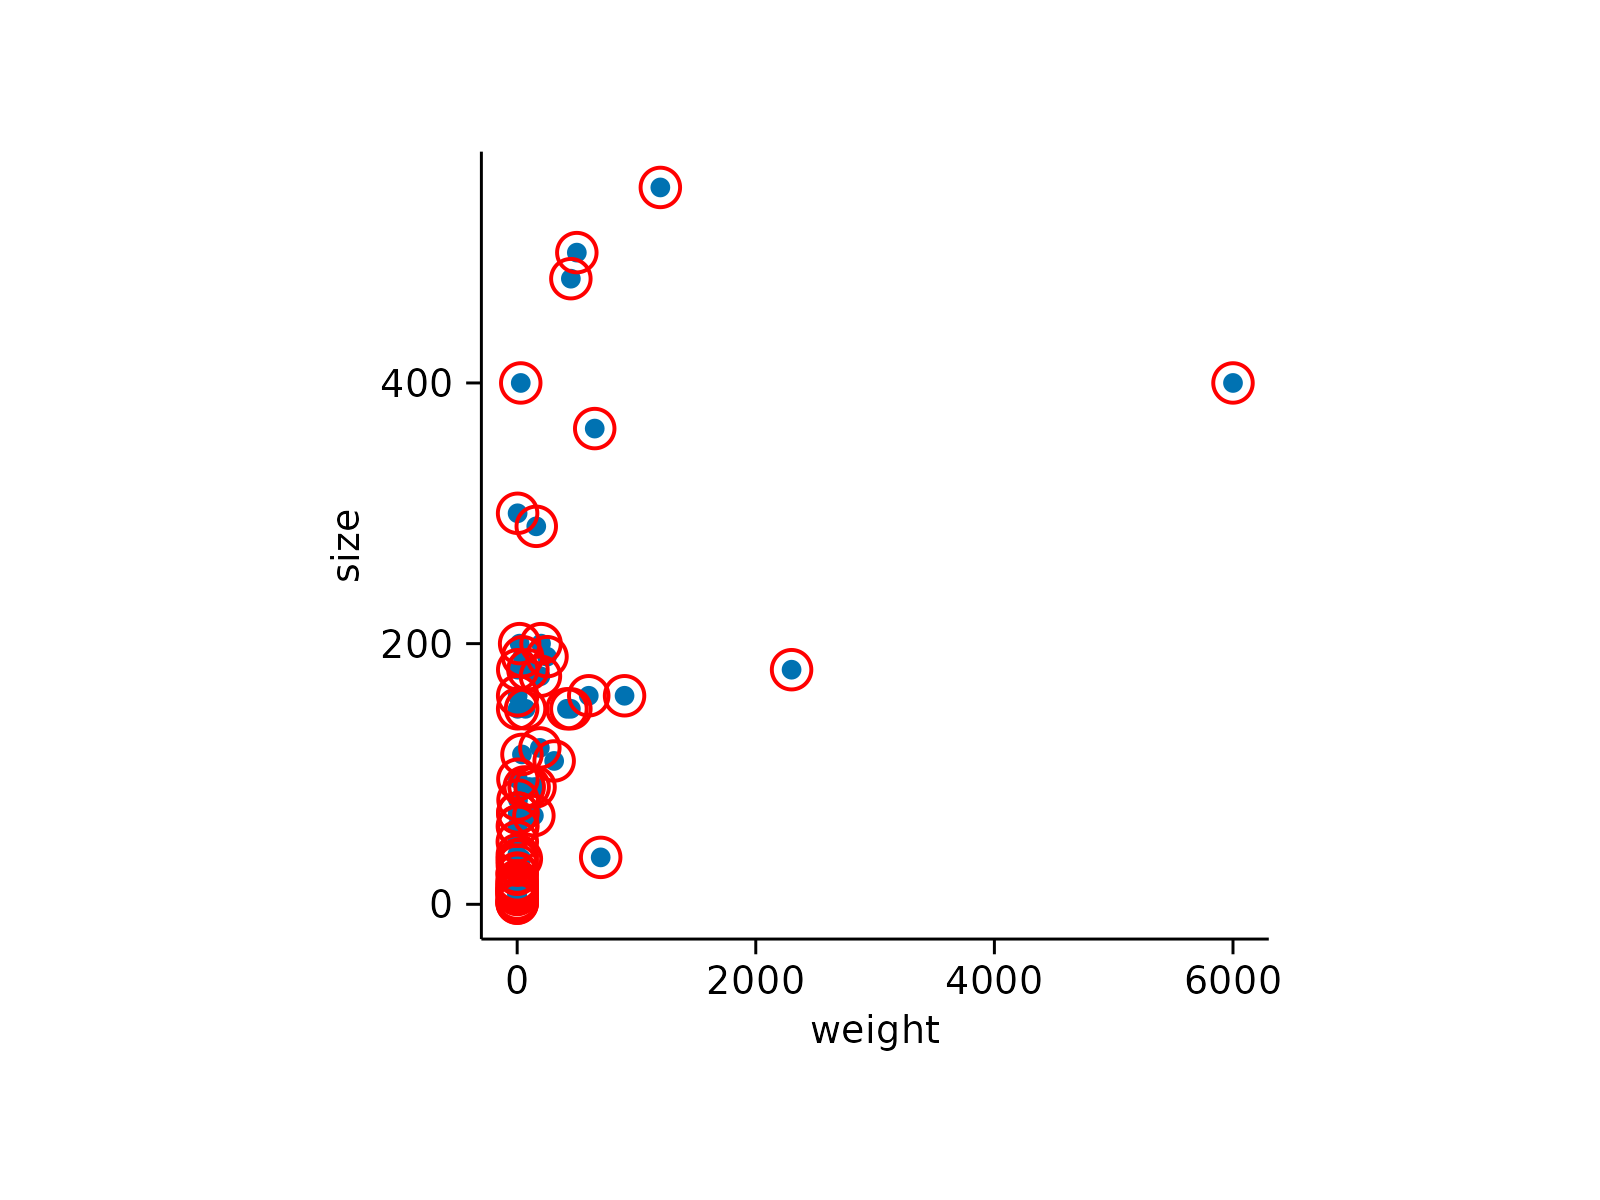
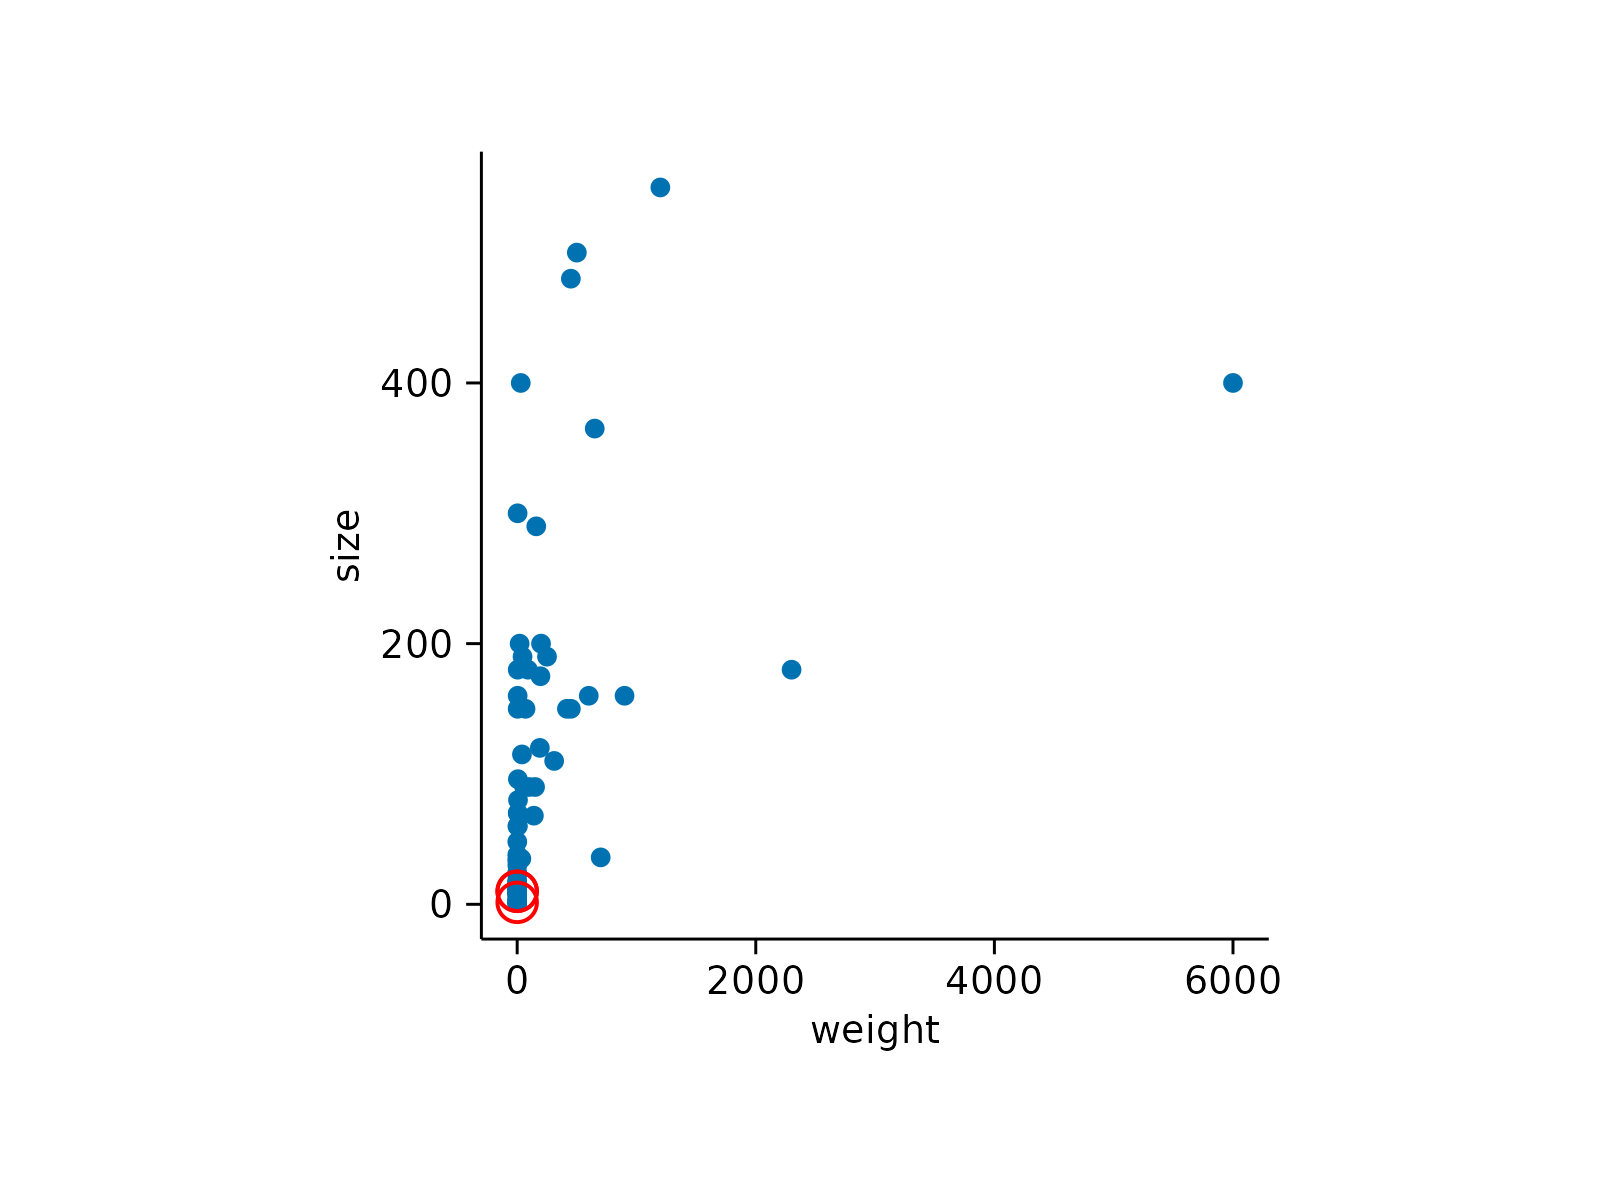
# Highlight all animals
animals |>
tidyplot(x = weight, y = size) |>
add_data_points() |>
add_data_points(data = all_rows(),
color = "red", shape = 1, size = 3)
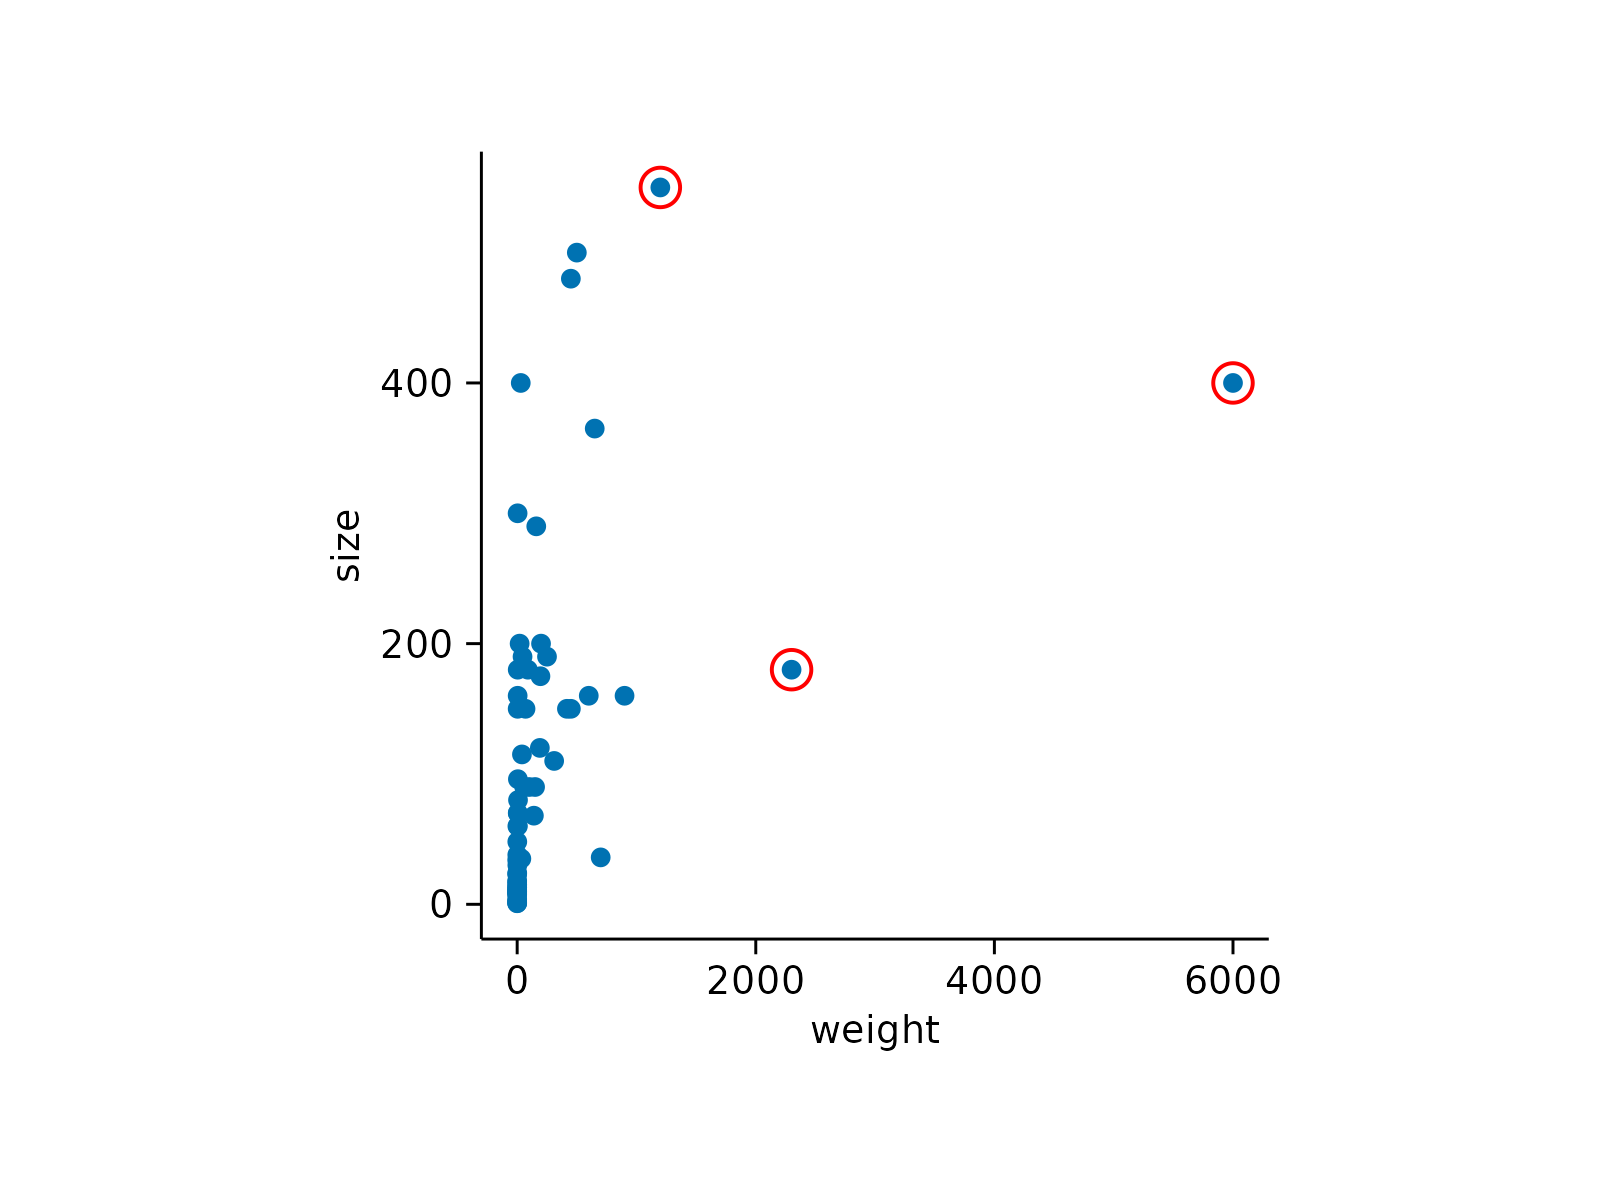
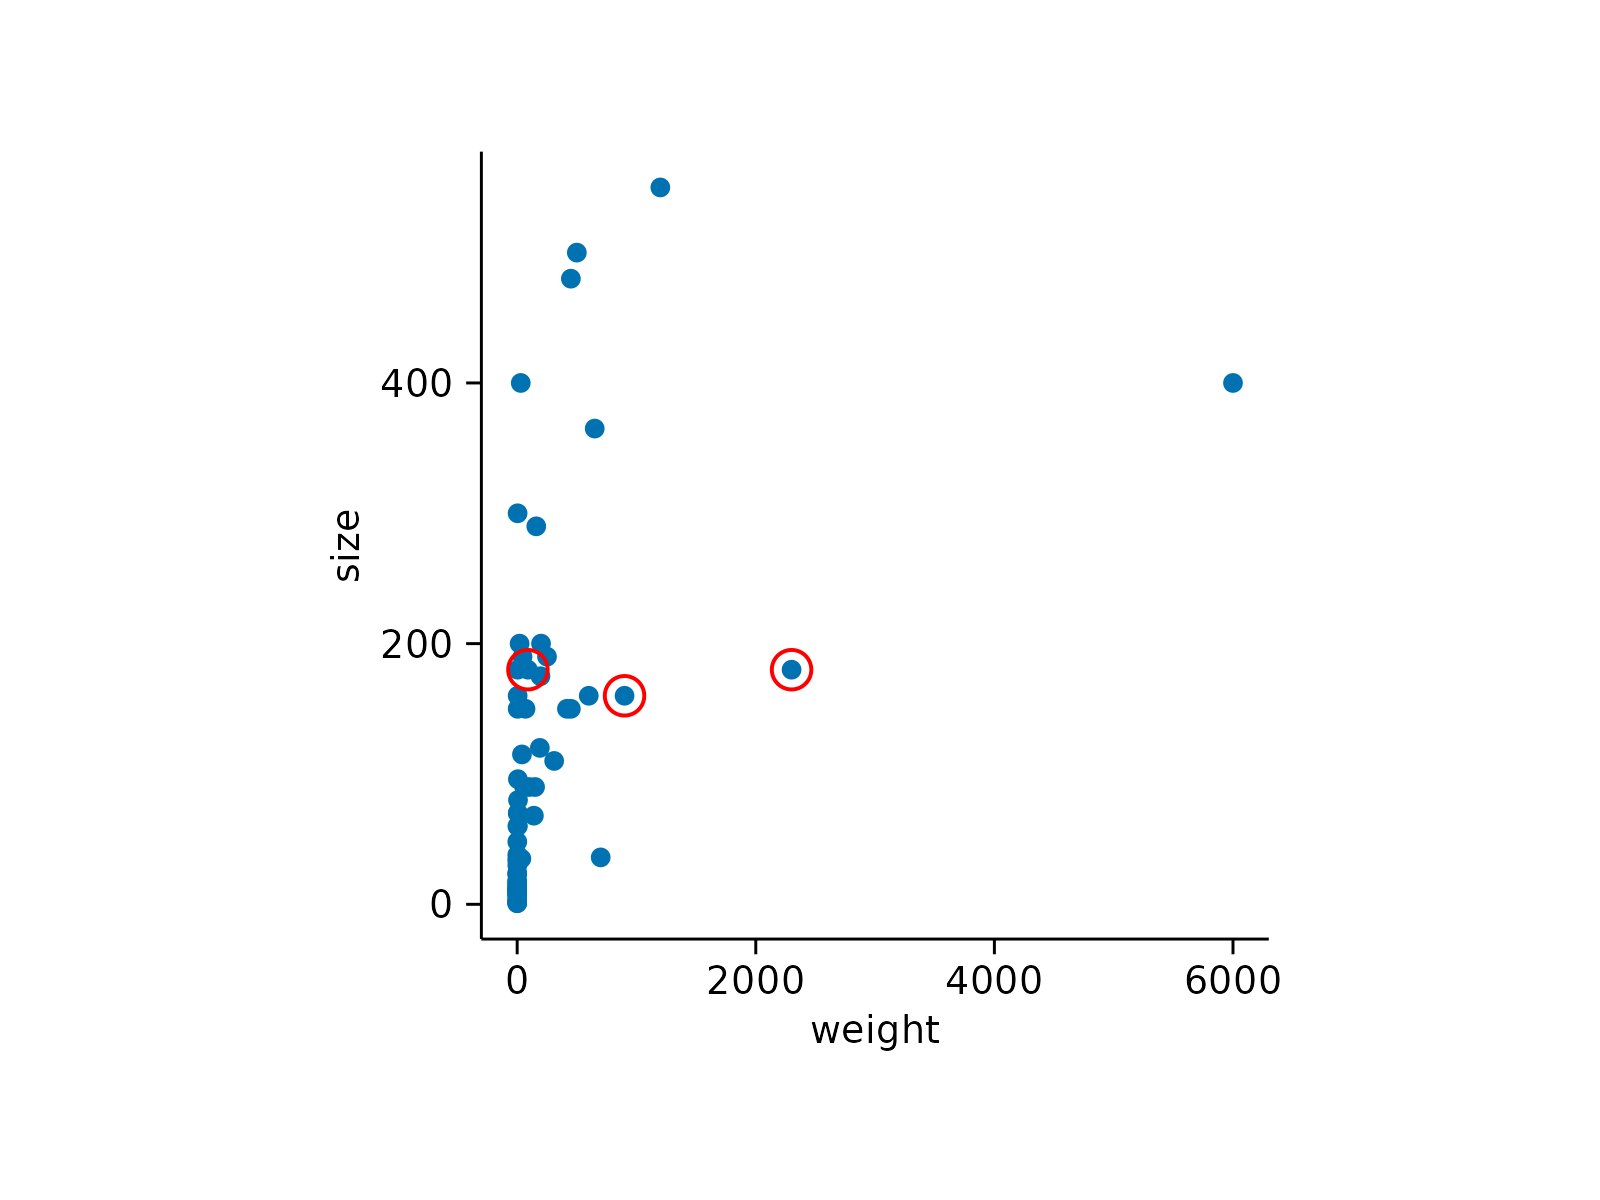
 # Highlight 3 animals with the highest weight
animals |>
tidyplot(x = weight, y = size) |>
add_data_points() |>
add_data_points(data = max_rows(weight, n = 3),
color = "red", shape = 1, size = 3)
# Highlight 3 animals with the highest weight
animals |>
tidyplot(x = weight, y = size) |>
add_data_points() |>
add_data_points(data = max_rows(weight, n = 3),
color = "red", shape = 1, size = 3)
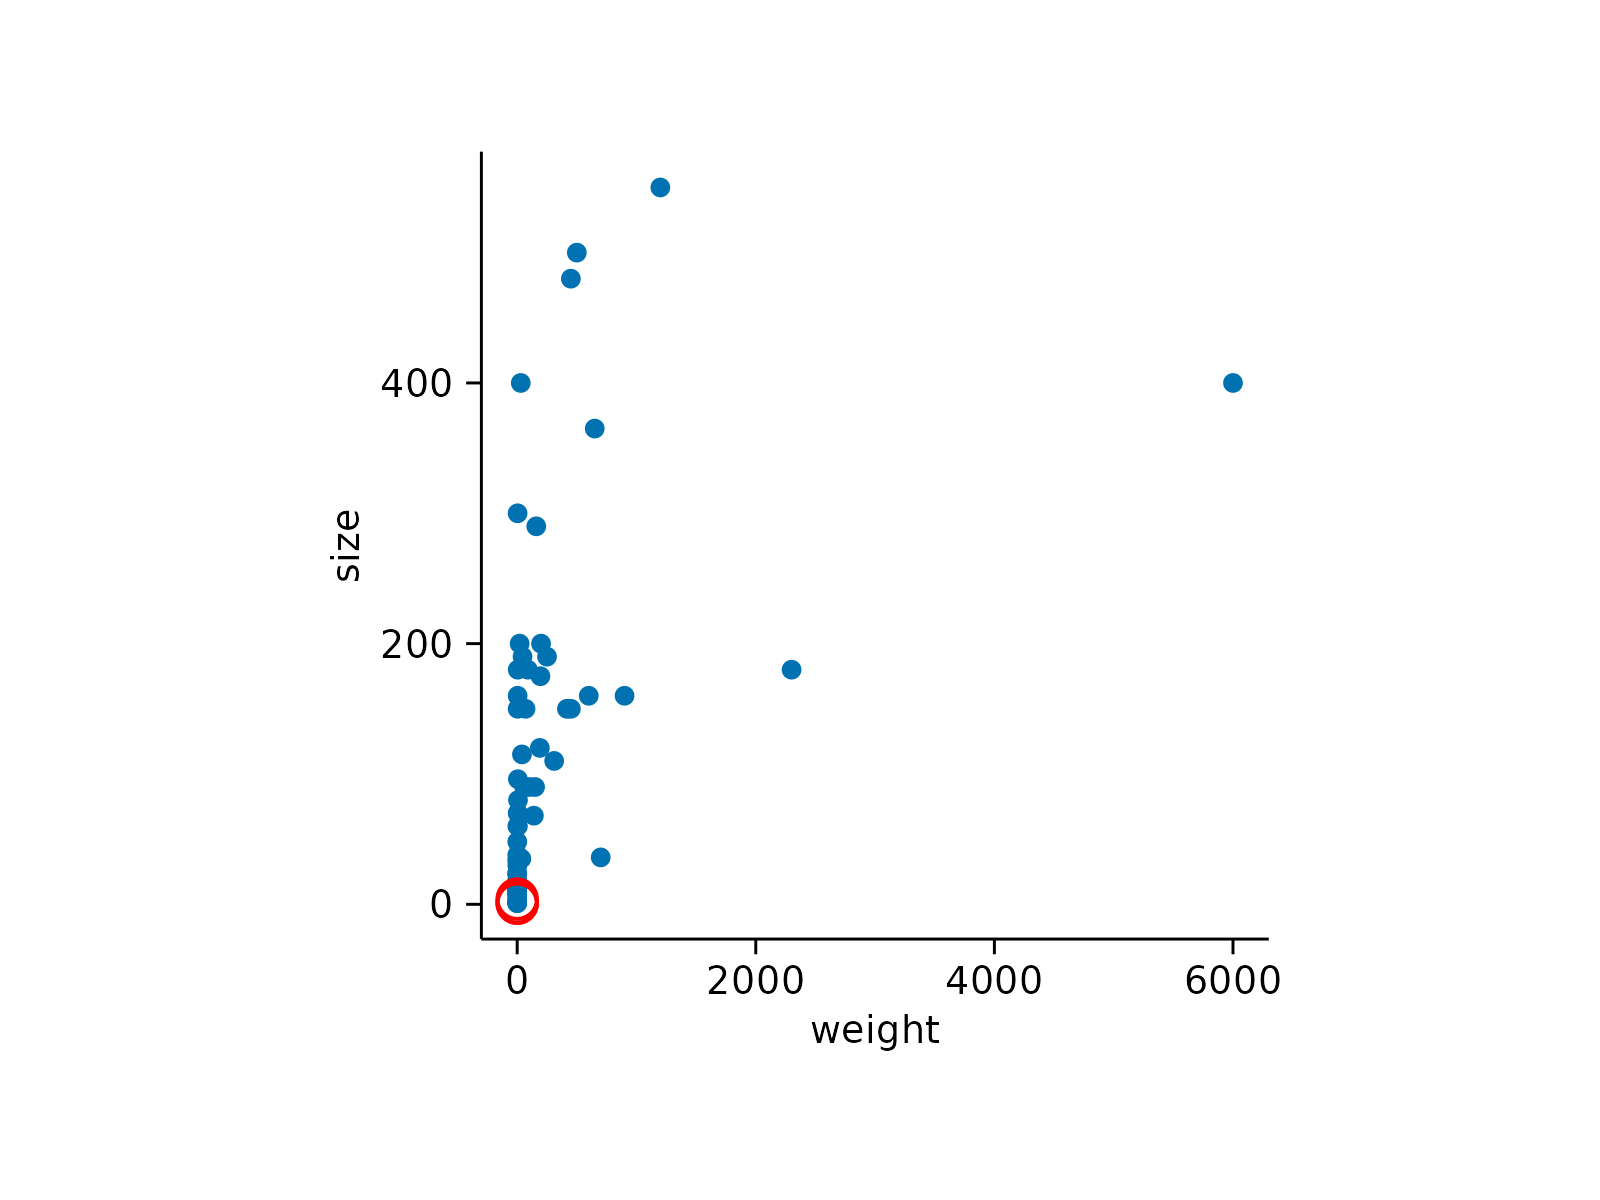
 # Highlight 3 animals with the lowest weight
animals |>
tidyplot(x = weight, y = size) |>
add_data_points() |>
add_data_points(data = min_rows(weight, n = 3),
color = "red", shape = 1, size = 3)
# Highlight 3 animals with the lowest weight
animals |>
tidyplot(x = weight, y = size) |>
add_data_points() |>
add_data_points(data = min_rows(weight, n = 3),
color = "red", shape = 1, size = 3)
 # Highlight the first 3 animals in the dataset
animals |>
tidyplot(x = weight, y = size) |>
add_data_points() |>
add_data_points(data = first_rows(n = 3),
color = "red", shape = 1, size = 3)
# Highlight the first 3 animals in the dataset
animals |>
tidyplot(x = weight, y = size) |>
add_data_points() |>
add_data_points(data = first_rows(n = 3),
color = "red", shape = 1, size = 3)
 # Highlight the last 3 animals in the dataset
animals |>
tidyplot(x = weight, y = size) |>
add_data_points() |>
add_data_points(data = last_rows(n = 3),
color = "red", shape = 1, size = 3)
# Highlight the last 3 animals in the dataset
animals |>
tidyplot(x = weight, y = size) |>
add_data_points() |>
add_data_points(data = last_rows(n = 3),
color = "red", shape = 1, size = 3)
 # Highlight 3 random animals
animals |>
tidyplot(x = weight, y = size) |>
add_data_points() |>
add_data_points(data = sample_rows(n = 3),
color = "red", shape = 1, size = 3)
# Highlight 3 random animals
animals |>
tidyplot(x = weight, y = size) |>
add_data_points() |>
add_data_points(data = sample_rows(n = 3),
color = "red", shape = 1, size = 3)