Control the settings for formatting tidyplots globally.
Usage
tidyplots_options(
  width = NULL,
  height = NULL,
  unit = NULL,
  dodge_width = NULL,
  my_style = NULL,
  paper = NULL,
  ink = NULL
)
Arguments
- width, height
Dimensions of the plot area. The default (
NULL) retrieves the setting from the tidyplots options, which defaults to50.NAresults in taking all available space (ggplot2 default).- unit
Unit of the plot area width and height. The default (
NULL) retrieves the setting from the tidyplots options, which defaults to"mm".- dodge_width
For adjusting the distance between grouped objects. The default (
NULL) retrieves the setting from the tidyplots options, which defaults to0.8for plots with at least one discrete axis and to0for plots with two continuous axes.- my_style
Styling function to apply to the plot. The default (
NULL) retrieves the setting from the tidyplots options, which default to no additional styling.- paper
Background color. The default (
NULL) retrieves the setting from the tidyplots options, which defaults to"#FFFFFF".- ink
Foreground color. The default (
NULL) retrieves the setting from the tidyplots options, which defaults to"#000000".
Examples
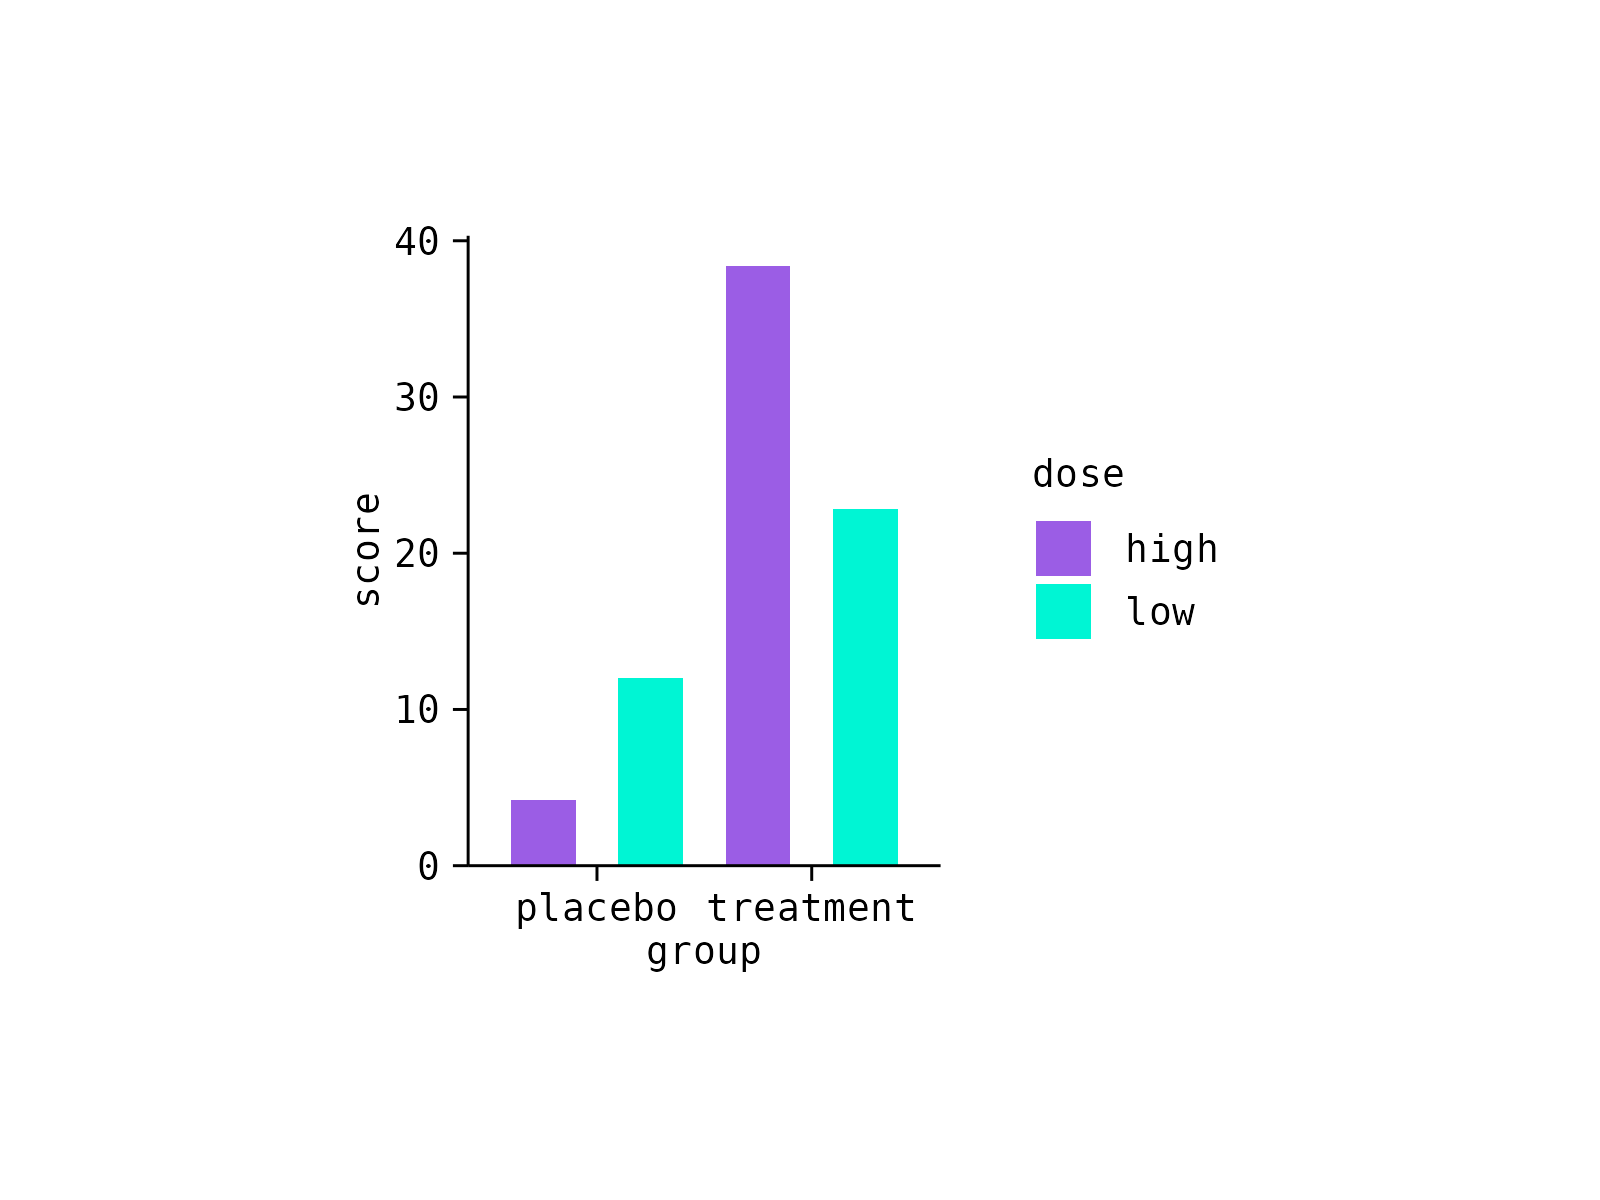
# Define custom style
my_style <- function(x) x |>
adjust_colors(colors_discrete_candy) |>
adjust_font(family = "mono")
# Set tidyplots options
tidyplots_options(
width = 3,
height = 4,
unit = "cm",
dodge_width = 1,
my_style = my_style
)
# Plot
study |>
tidyplot(x = group, y = score, color = dose) |>
add_mean_bar()
 # Reset tidyplots options
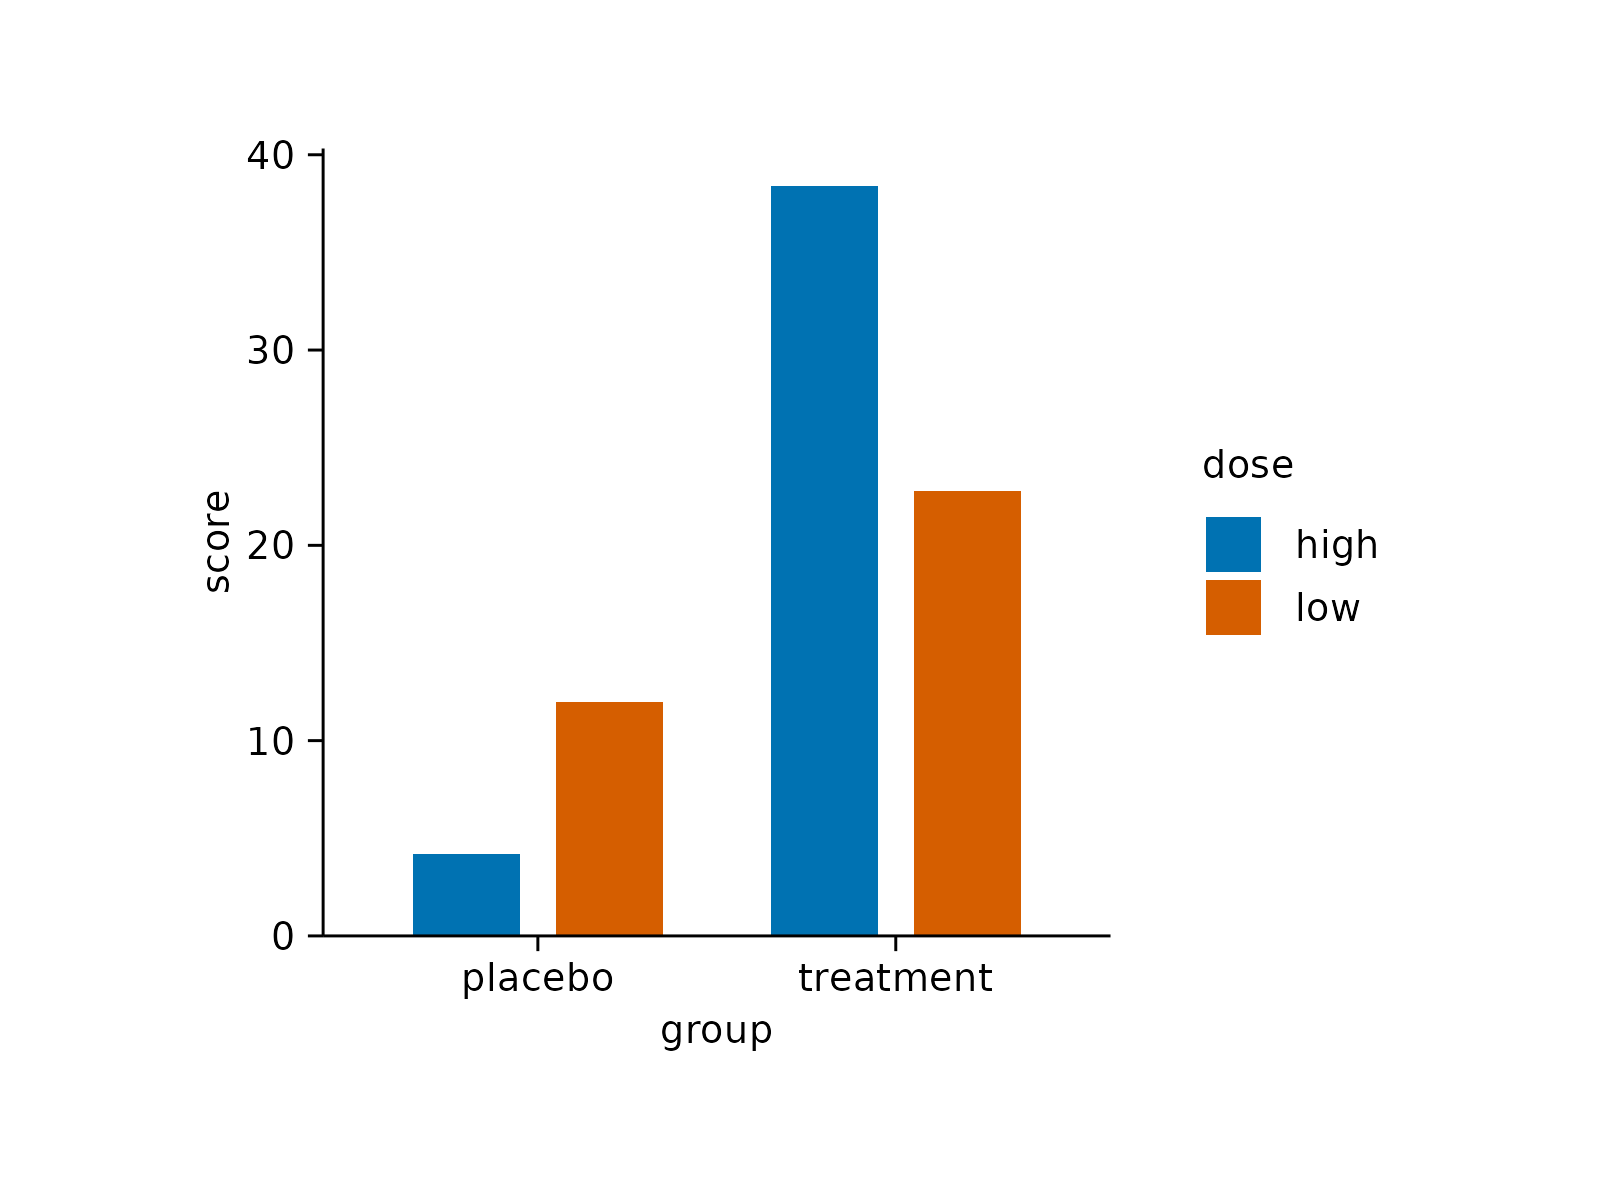
tidyplots_options()
# Same plot
study |>
tidyplot(x = group, y = score, color = dose) |>
add_mean_bar()
# Reset tidyplots options
tidyplots_options()
# Same plot
study |>
tidyplot(x = group, y = score, color = dose) |>
add_mean_bar()