Adjust font
Arguments
- plot
A
tidyplotgenerated with the functiontidyplot().- fontsize
Font size in points. Defaults to
7.- family
The typeface to use. The validity of this value will depend on the graphics device being used for rendering the plot. See the systemfonts vignette for guidance on the best way to access fonts installed on your computer. The values
"sans","serif", and"mono"should always be valid and will select the default typeface for the respective styles. However, what is considered default is dependant on the graphics device and the operating system.- face
Font face ("plain", "italic", "bold", "bold.italic")
Examples
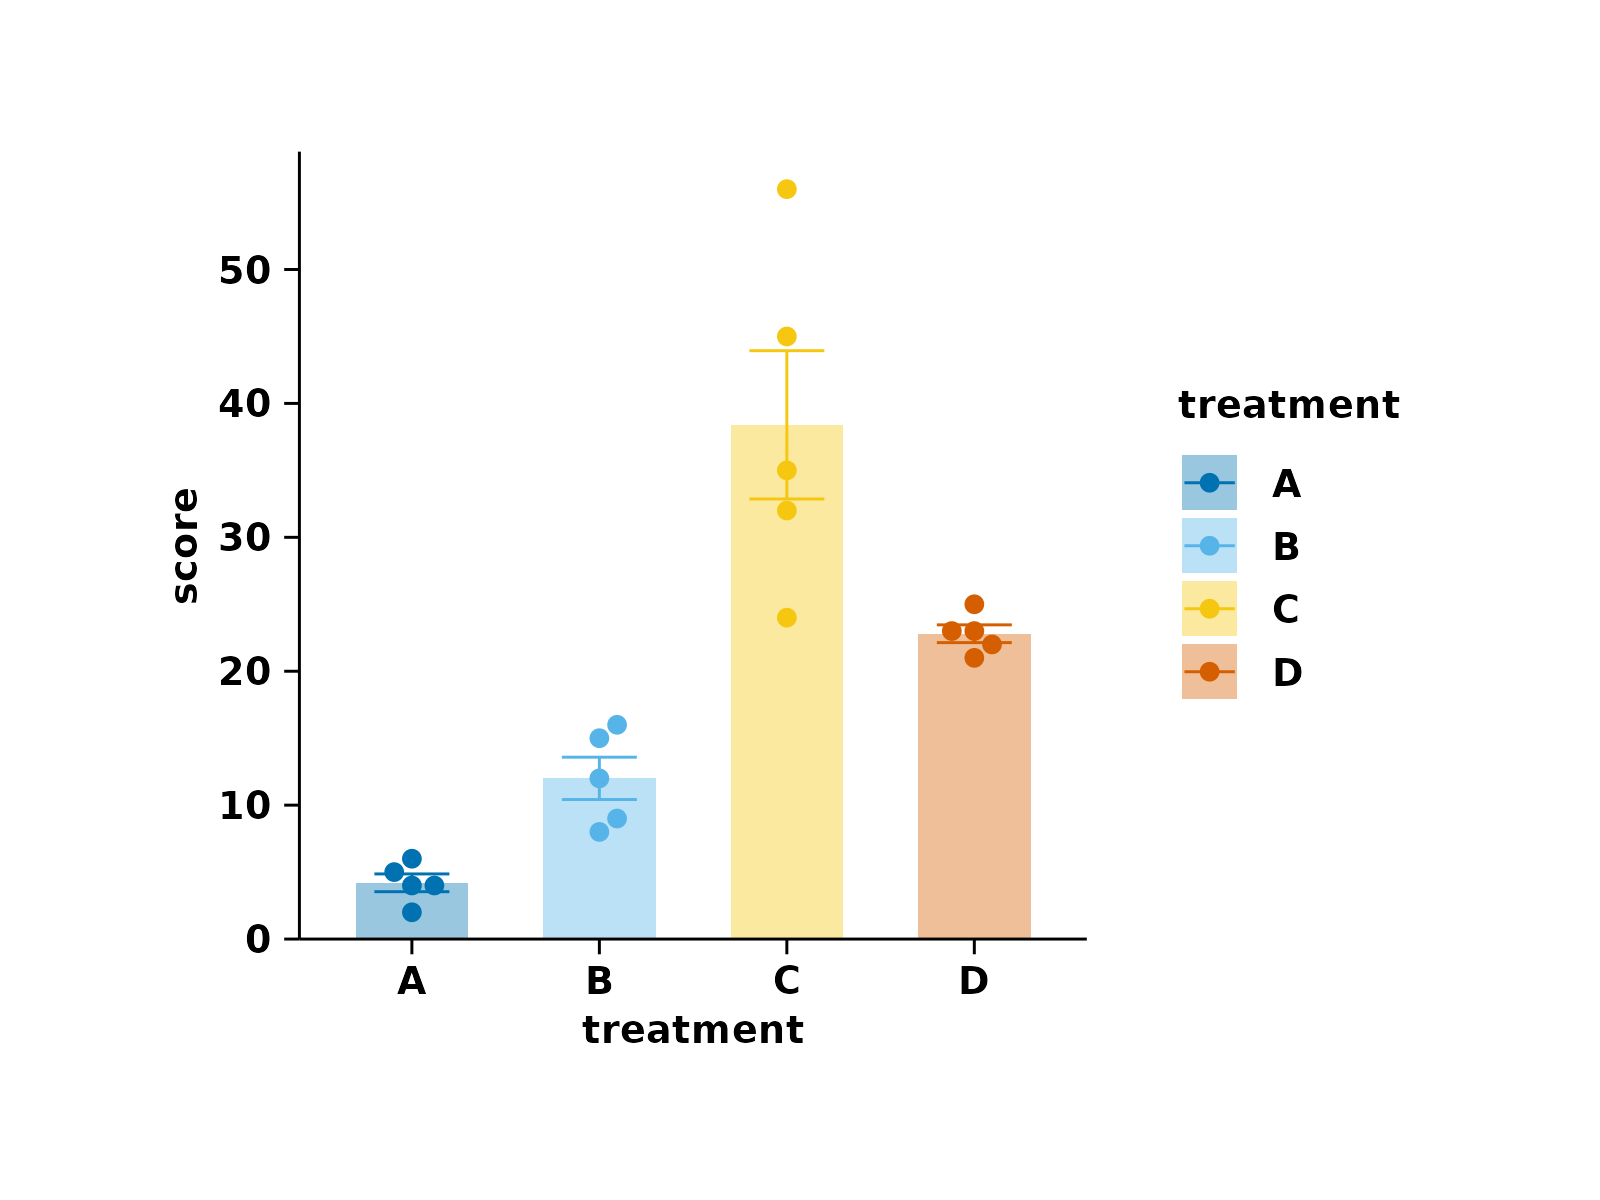
# Plot without adjustments
study |>
tidyplot(x = treatment, y = score, color = treatment) |>
add_data_points_beeswarm() |>
add_mean_bar(alpha = 0.4) |>
add_sem_errorbar()
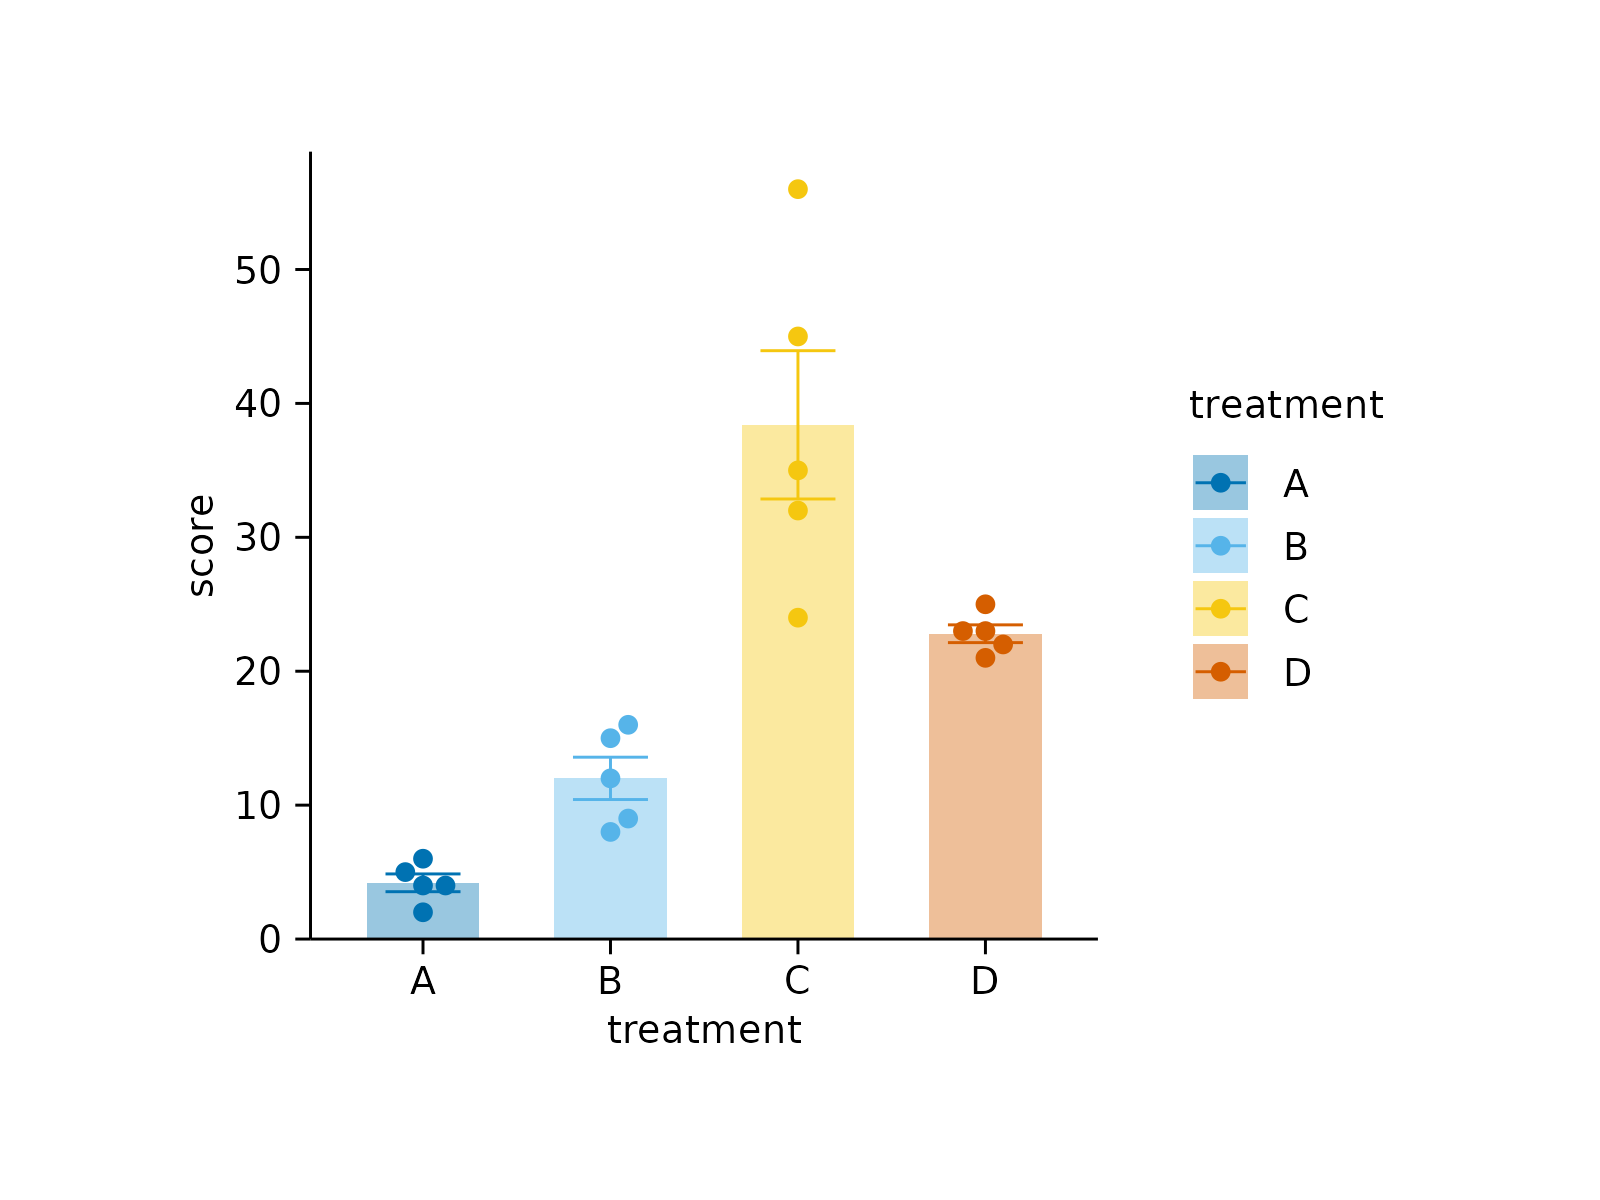 # Increase font size
study |>
tidyplot(x = treatment, y = score, color = treatment) |>
add_data_points_beeswarm() |>
add_mean_bar(alpha = 0.4) |>
add_sem_errorbar() |>
adjust_font(fontsize = 16)
# Increase font size
study |>
tidyplot(x = treatment, y = score, color = treatment) |>
add_data_points_beeswarm() |>
add_mean_bar(alpha = 0.4) |>
add_sem_errorbar() |>
adjust_font(fontsize = 16)
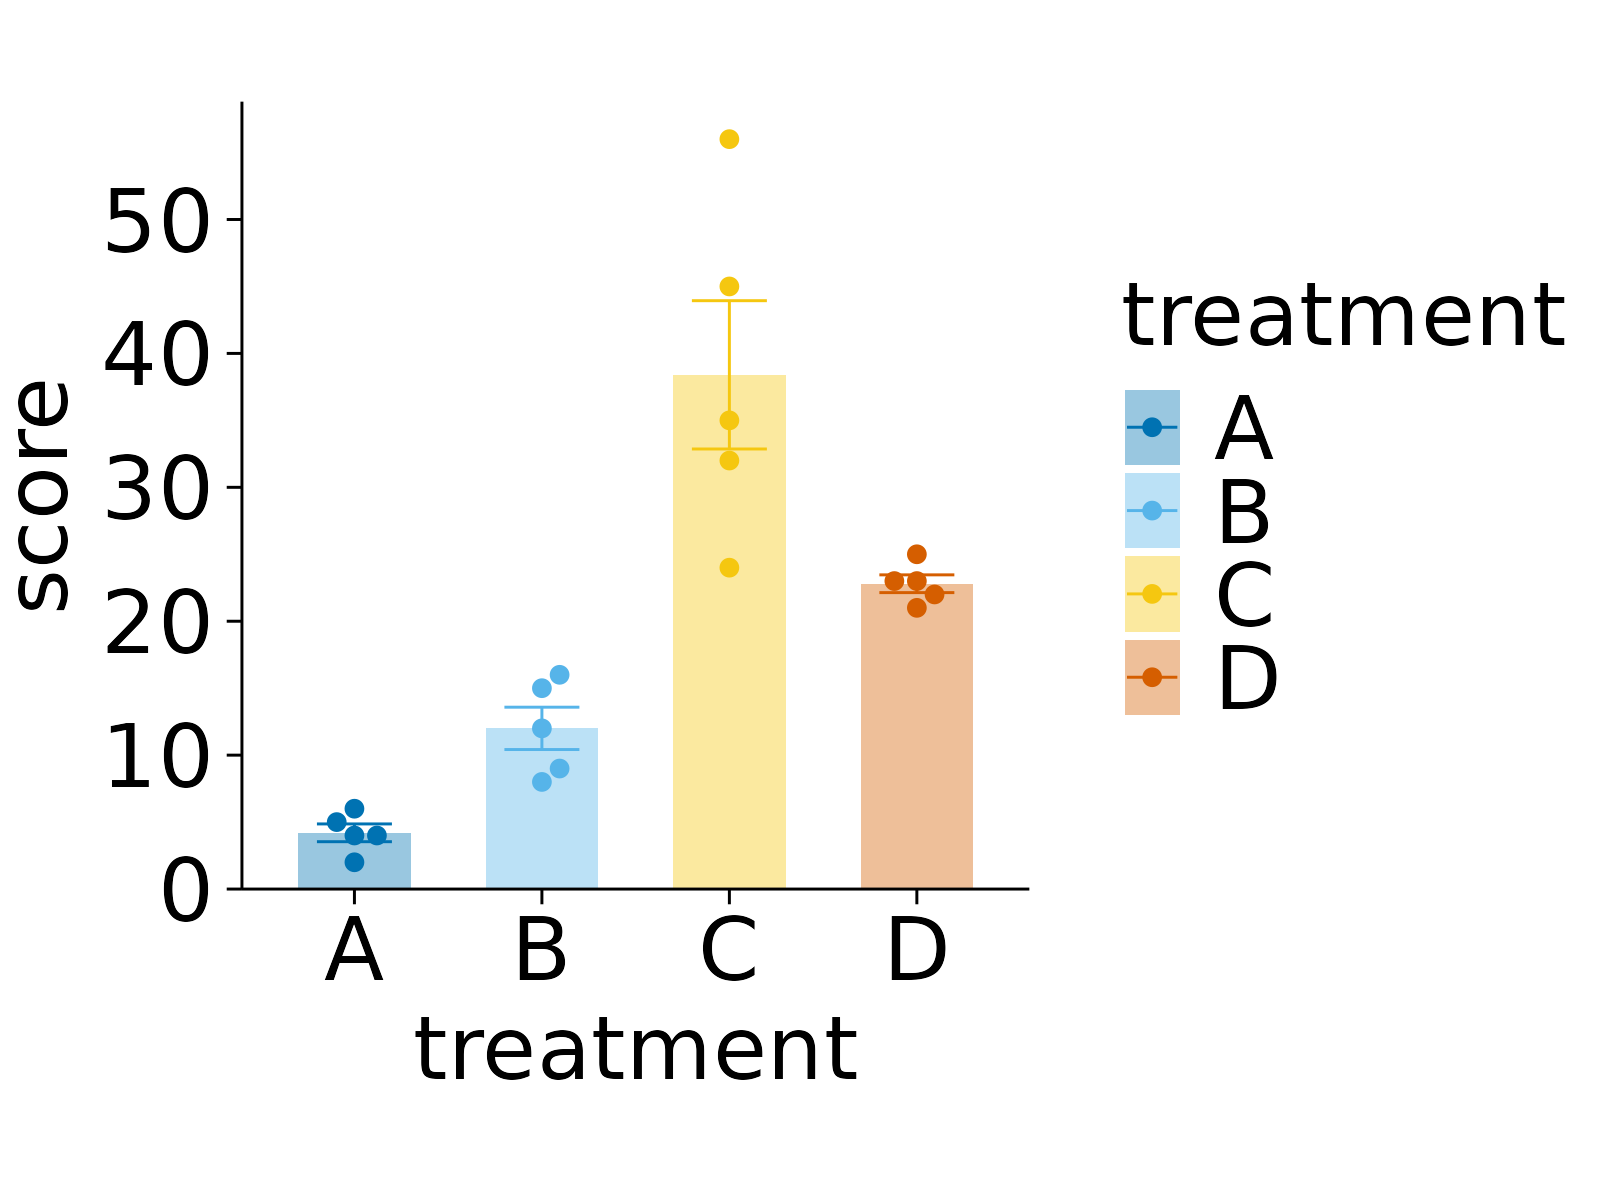 # Change font family
study |>
tidyplot(x = treatment, y = score, color = treatment) |>
add_data_points_beeswarm() |>
add_mean_bar(alpha = 0.4) |>
add_sem_errorbar() |>
adjust_font(family = "mono")
# Change font family
study |>
tidyplot(x = treatment, y = score, color = treatment) |>
add_data_points_beeswarm() |>
add_mean_bar(alpha = 0.4) |>
add_sem_errorbar() |>
adjust_font(family = "mono")
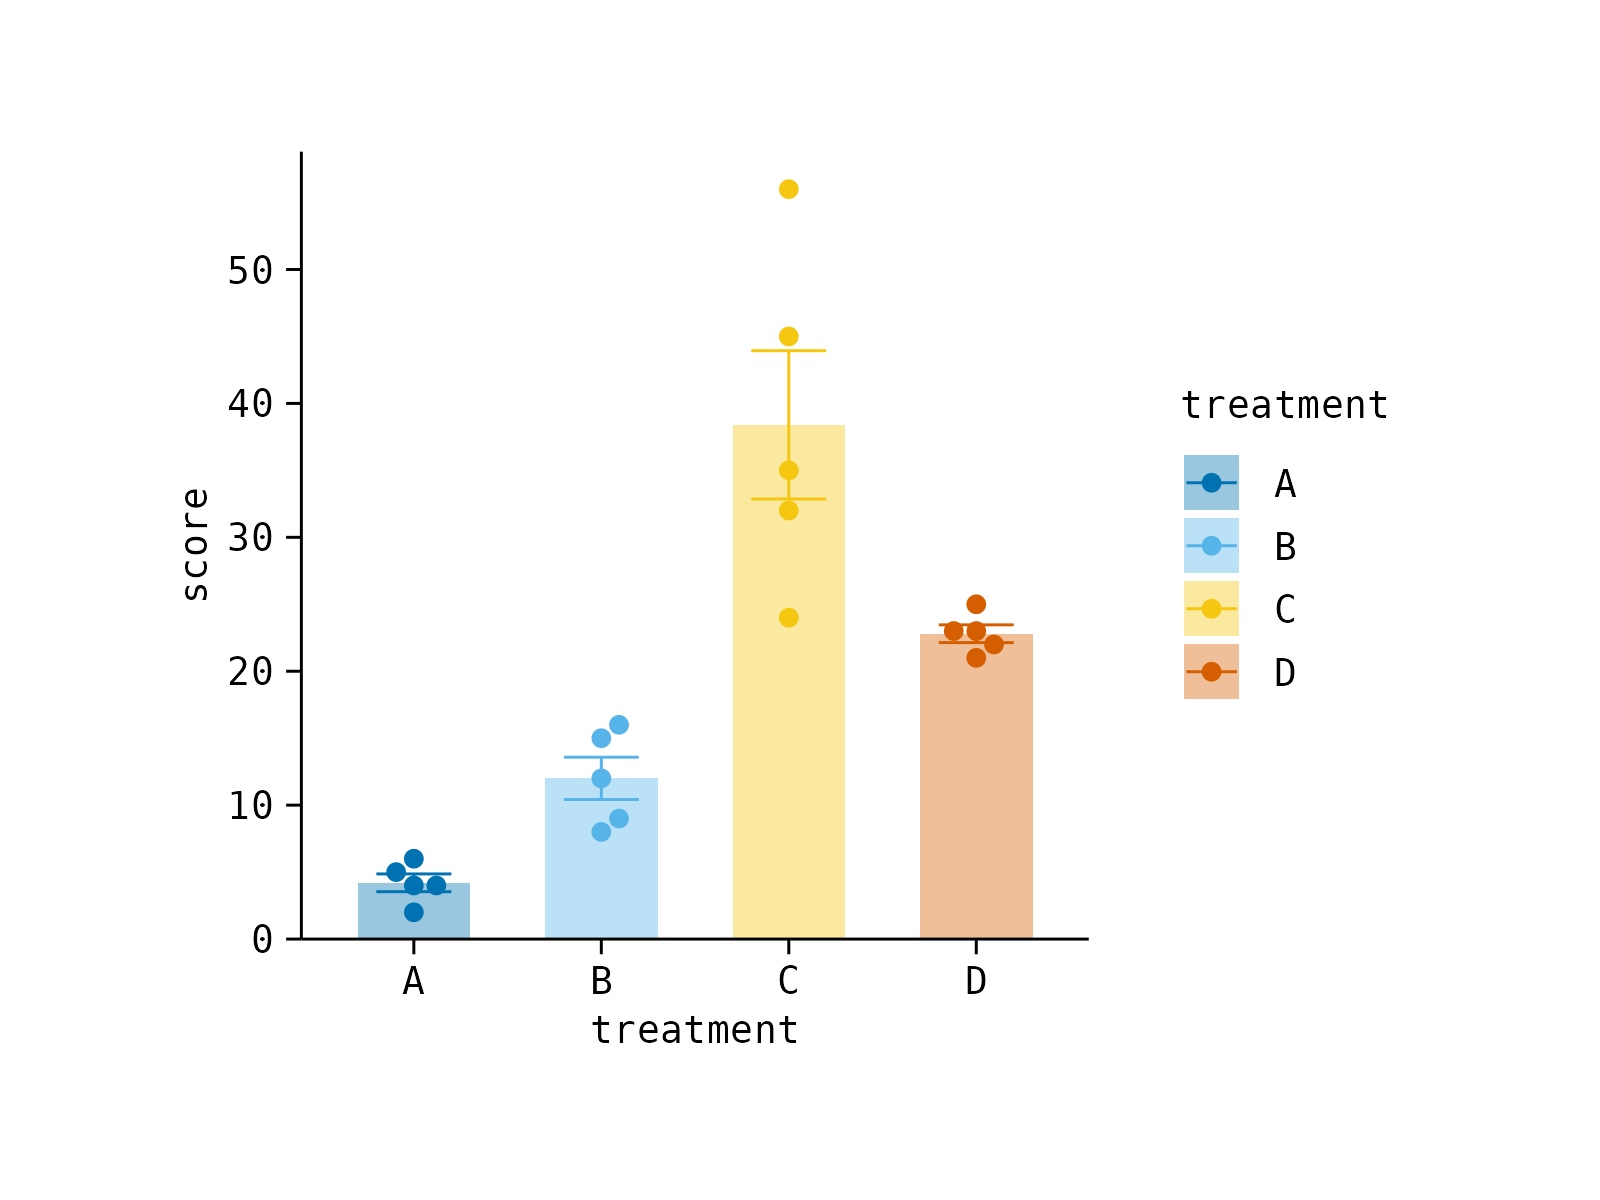 # Change font face
study |>
tidyplot(x = treatment, y = score, color = treatment) |>
add_data_points_beeswarm() |>
add_mean_bar(alpha = 0.4) |>
add_sem_errorbar() |>
adjust_font(face = "bold")
# Change font face
study |>
tidyplot(x = treatment, y = score, color = treatment) |>
add_data_points_beeswarm() |>
add_mean_bar(alpha = 0.4) |>
add_sem_errorbar() |>
adjust_font(face = "bold")