![[Superseded]](figures/lifecycle-superseded.svg)
This function is superseded because in many cases, flip_plot() can easily
be replaced by swapping the x and y axis. Some plot components additionally
require to set the orientation argument to "y".
Arguments
- plot
A
tidyplotgenerated with the functiontidyplot().- ...
Arguments passed on to
ggplot2::coord_flip().
Examples
study |>
tidyplot(x = treatment, y = score, color = treatment) |>
add_data_points() |>
add_mean_bar(alpha = 0.4) |>
add_sem_errorbar() |>
flip_plot()
 energy |>
tidyplot(x = year, y = energy, color = energy_type) |>
add_barstack_absolute() |>
flip_plot()
energy |>
tidyplot(x = year, y = energy, color = energy_type) |>
add_barstack_absolute() |>
flip_plot()
 # Better solutions without `flip_plot()`
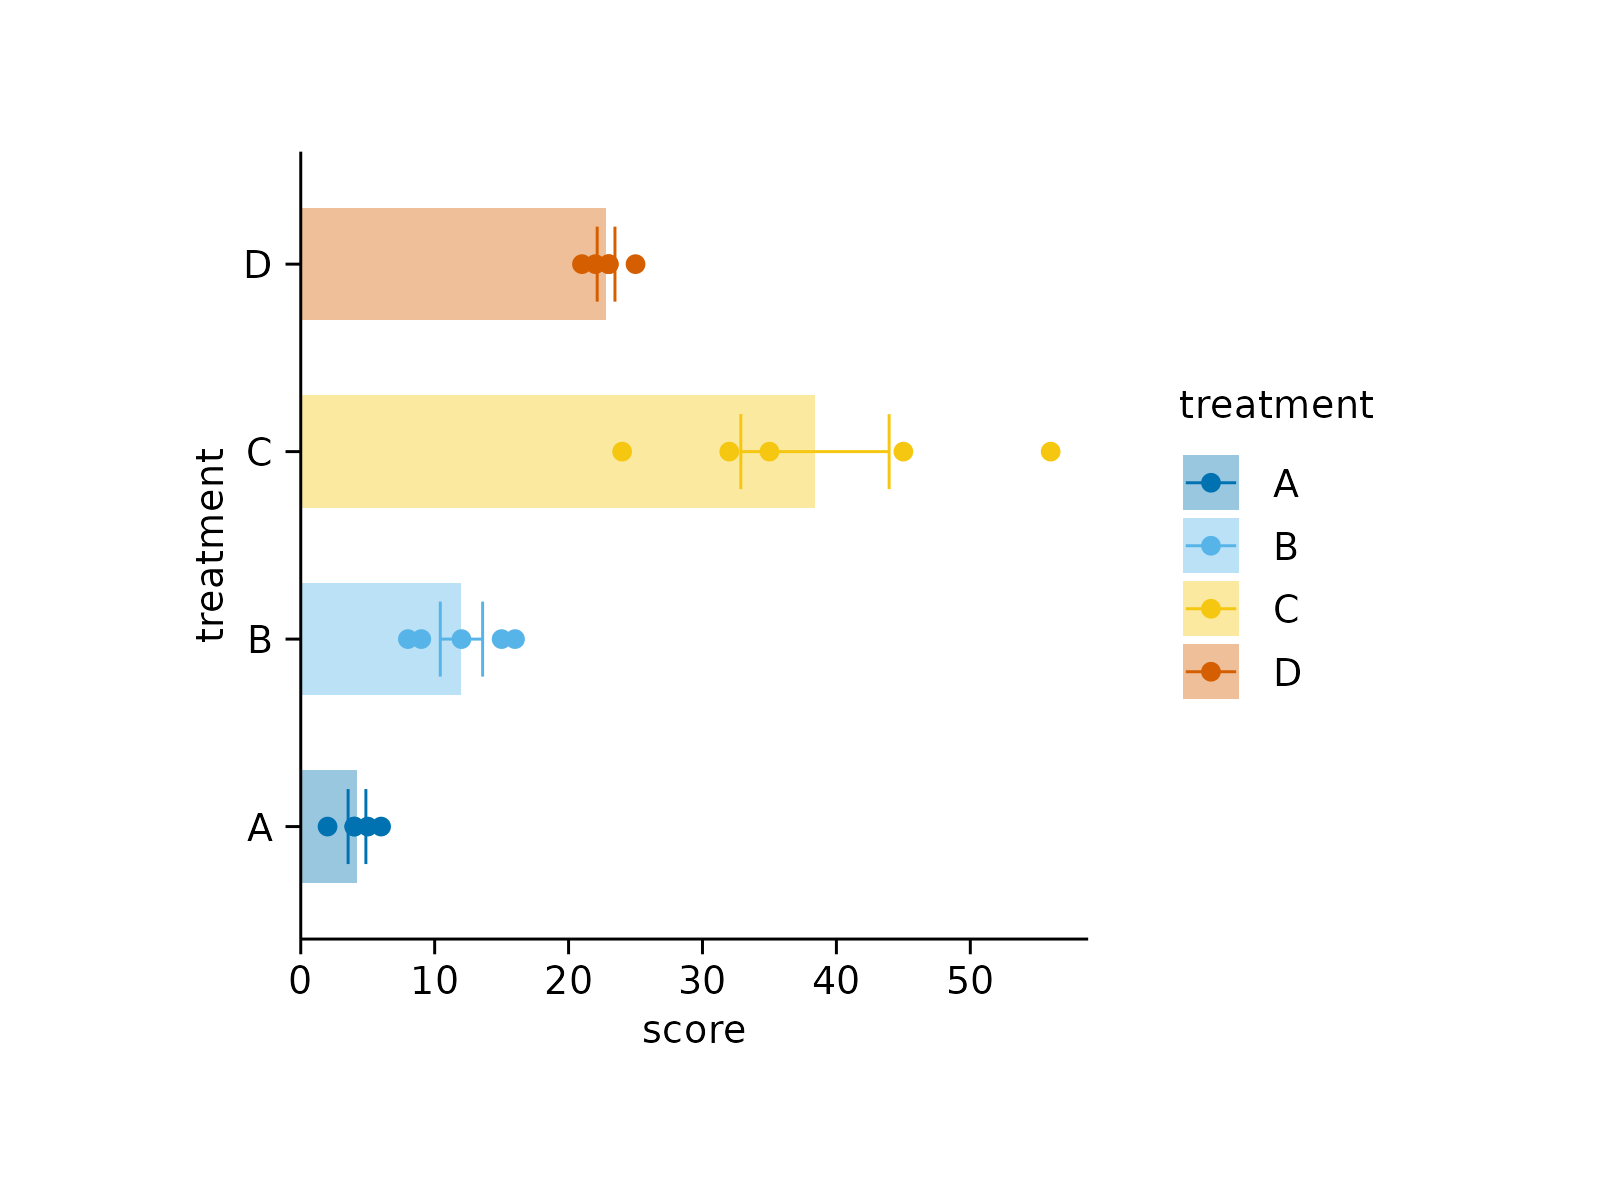
study |>
tidyplot(x = score, y = treatment, color = treatment) |>
add_data_points() |>
add_mean_bar(alpha = 0.4) |>
add_sem_errorbar()
# Better solutions without `flip_plot()`
study |>
tidyplot(x = score, y = treatment, color = treatment) |>
add_data_points() |>
add_mean_bar(alpha = 0.4) |>
add_sem_errorbar()
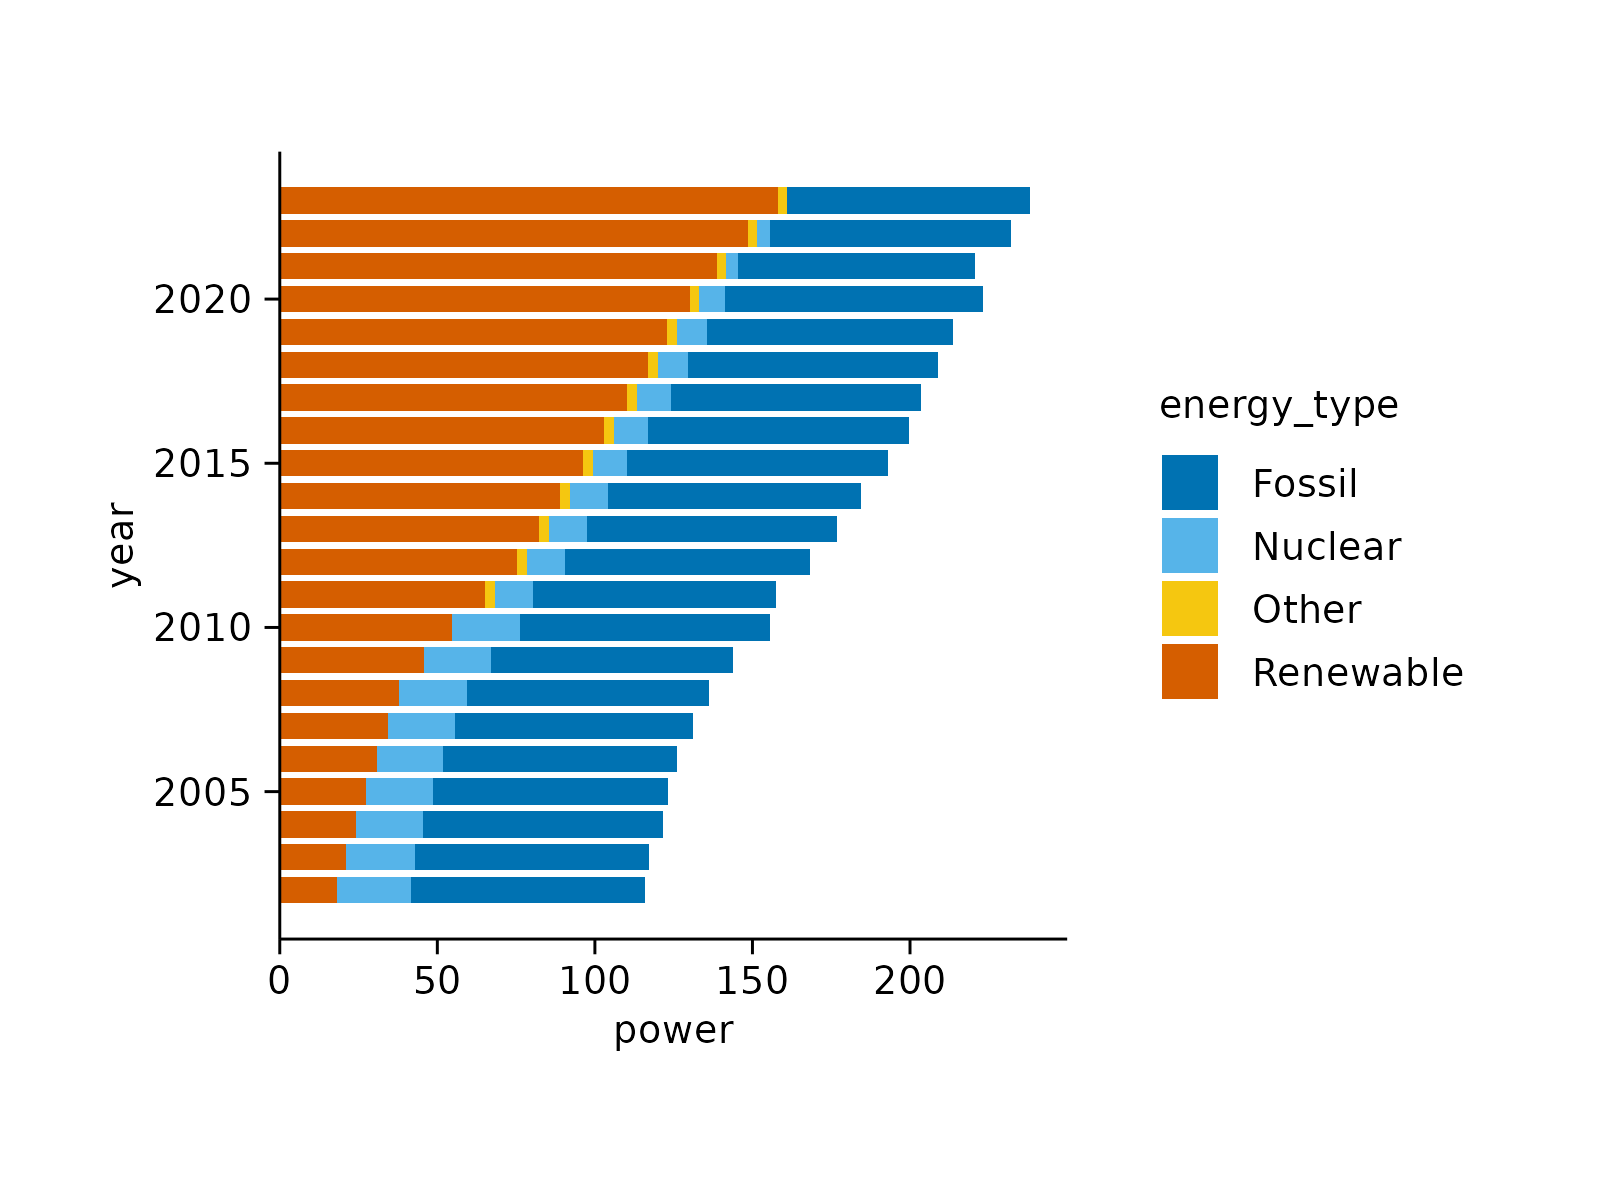
 energy |>
tidyplot(x = energy, y = year, color = energy_type) |>
add_barstack_absolute(orientation = "y")
energy |>
tidyplot(x = energy, y = year, color = energy_type) |>
add_barstack_absolute(orientation = "y")
