Add bar stack
Usage
add_barstack_absolute(plot, width = 0.8, reverse = FALSE, ...)

add_barstack_relative(plot, width = 0.8, reverse = FALSE, ...)
Arguments
- plot
A
tidyplotgenerated with the functiontidyplot().- width
Horizontal width of the plotted object (bar, error bar, boxplot, violin plot, etc). Typical values range between
0and1.- reverse
Whether the order should be reversed or not. Defaults to
FALSE, meaning not reversed.- ...
Arguments passed on to the
geomfunction.
Examples
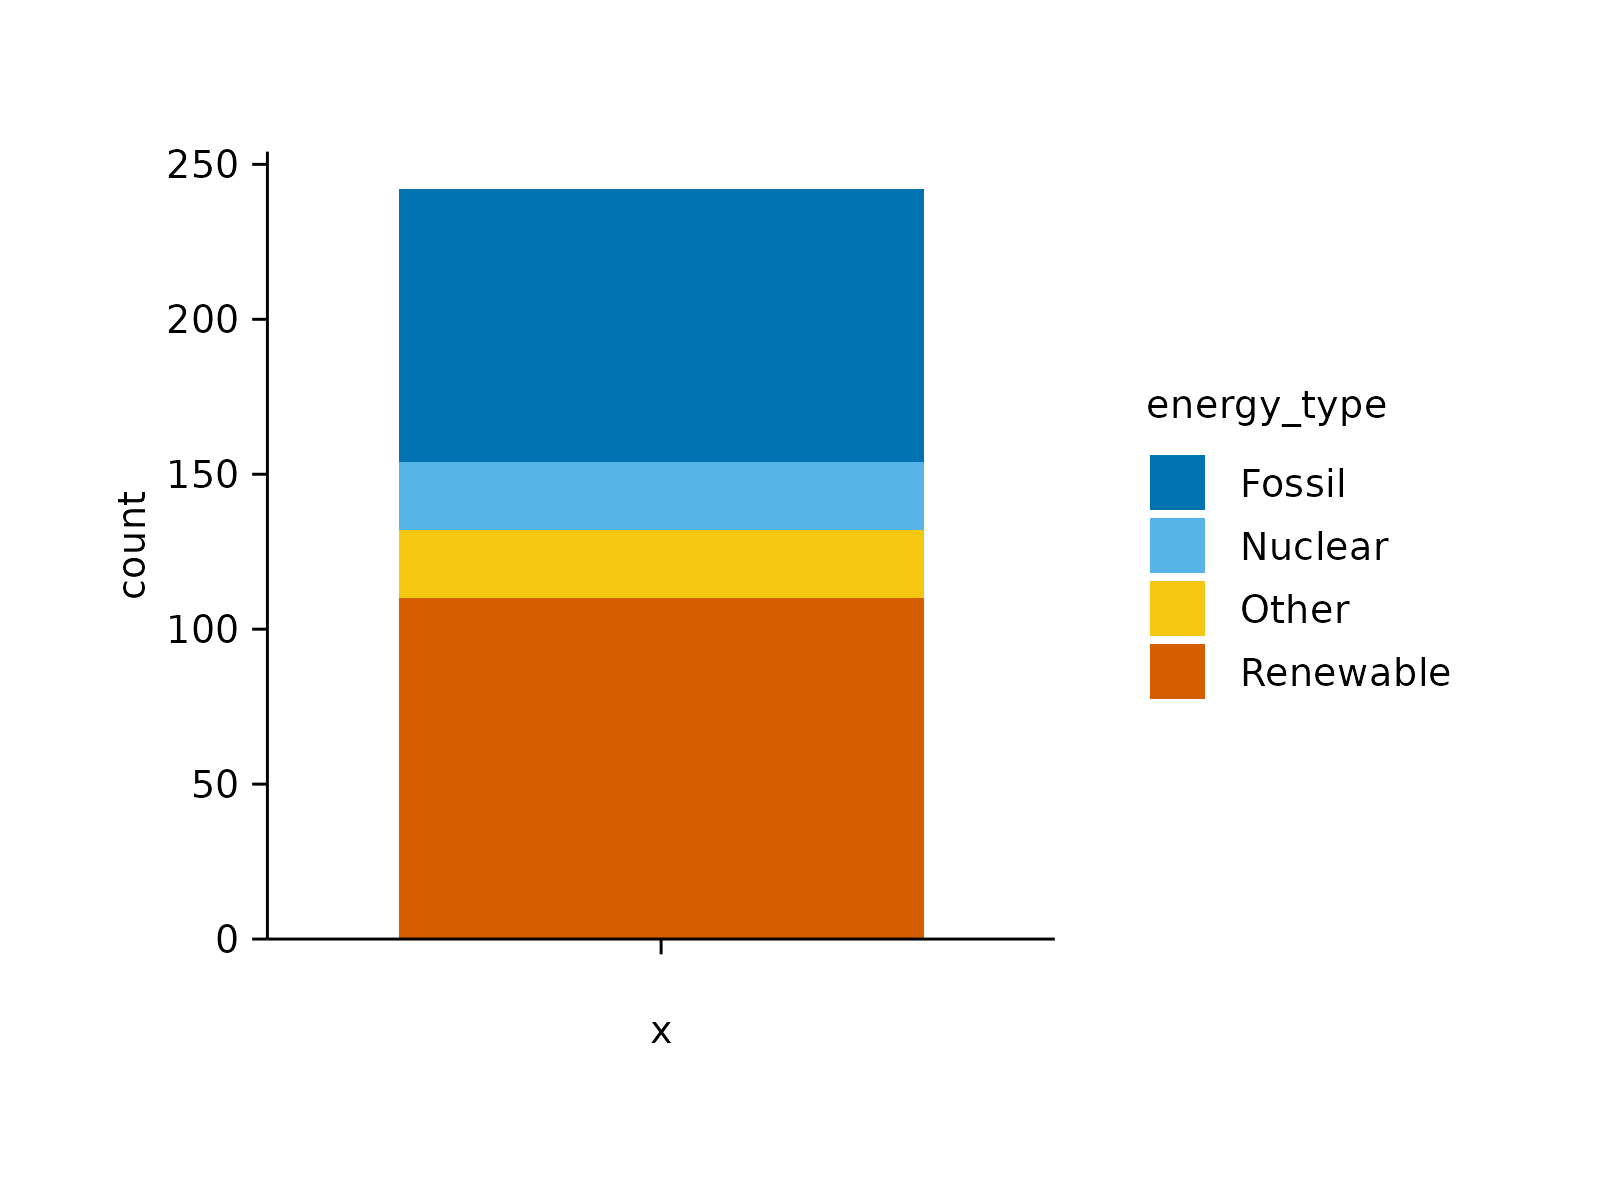
# for a `count` only provide `color`
# `count` of the data points in each `energy_type` category
energy |>
tidyplot(color = energy_type) |>
add_barstack_absolute()
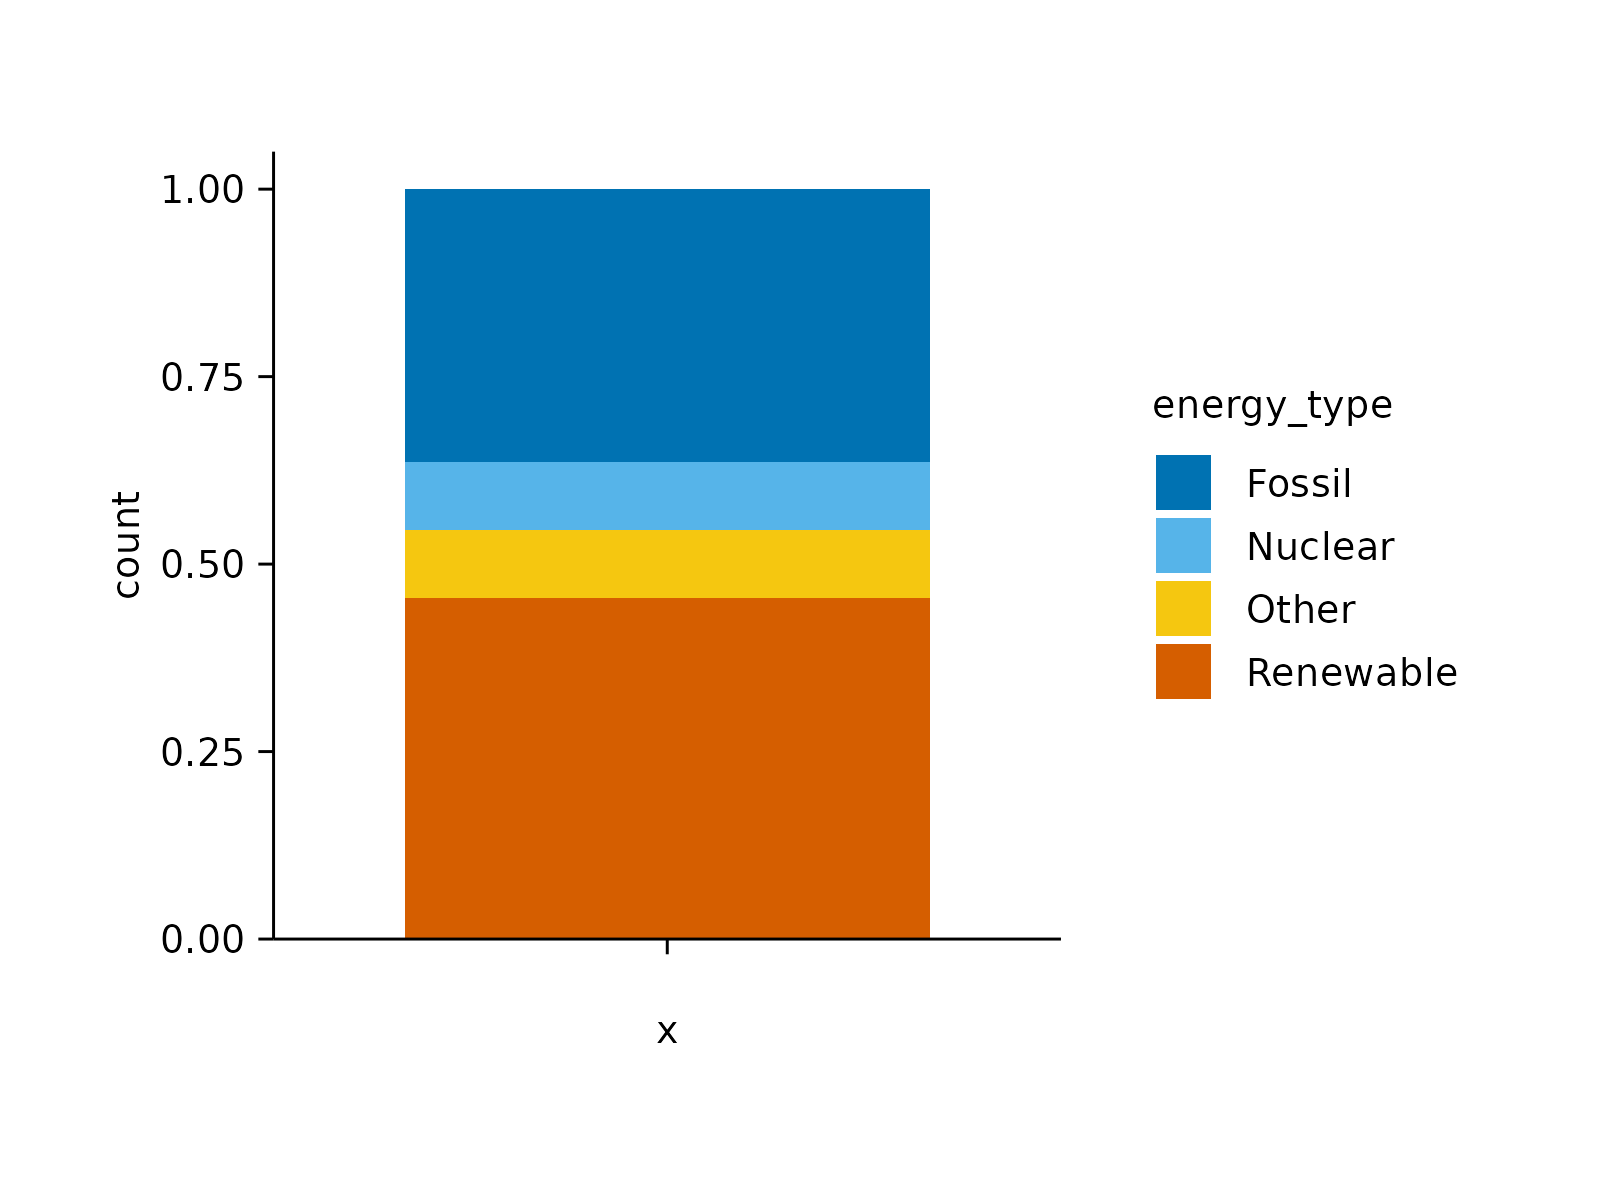
 energy |>
tidyplot(color = energy_type) |>
add_barstack_relative()
energy |>
tidyplot(color = energy_type) |>
add_barstack_relative()
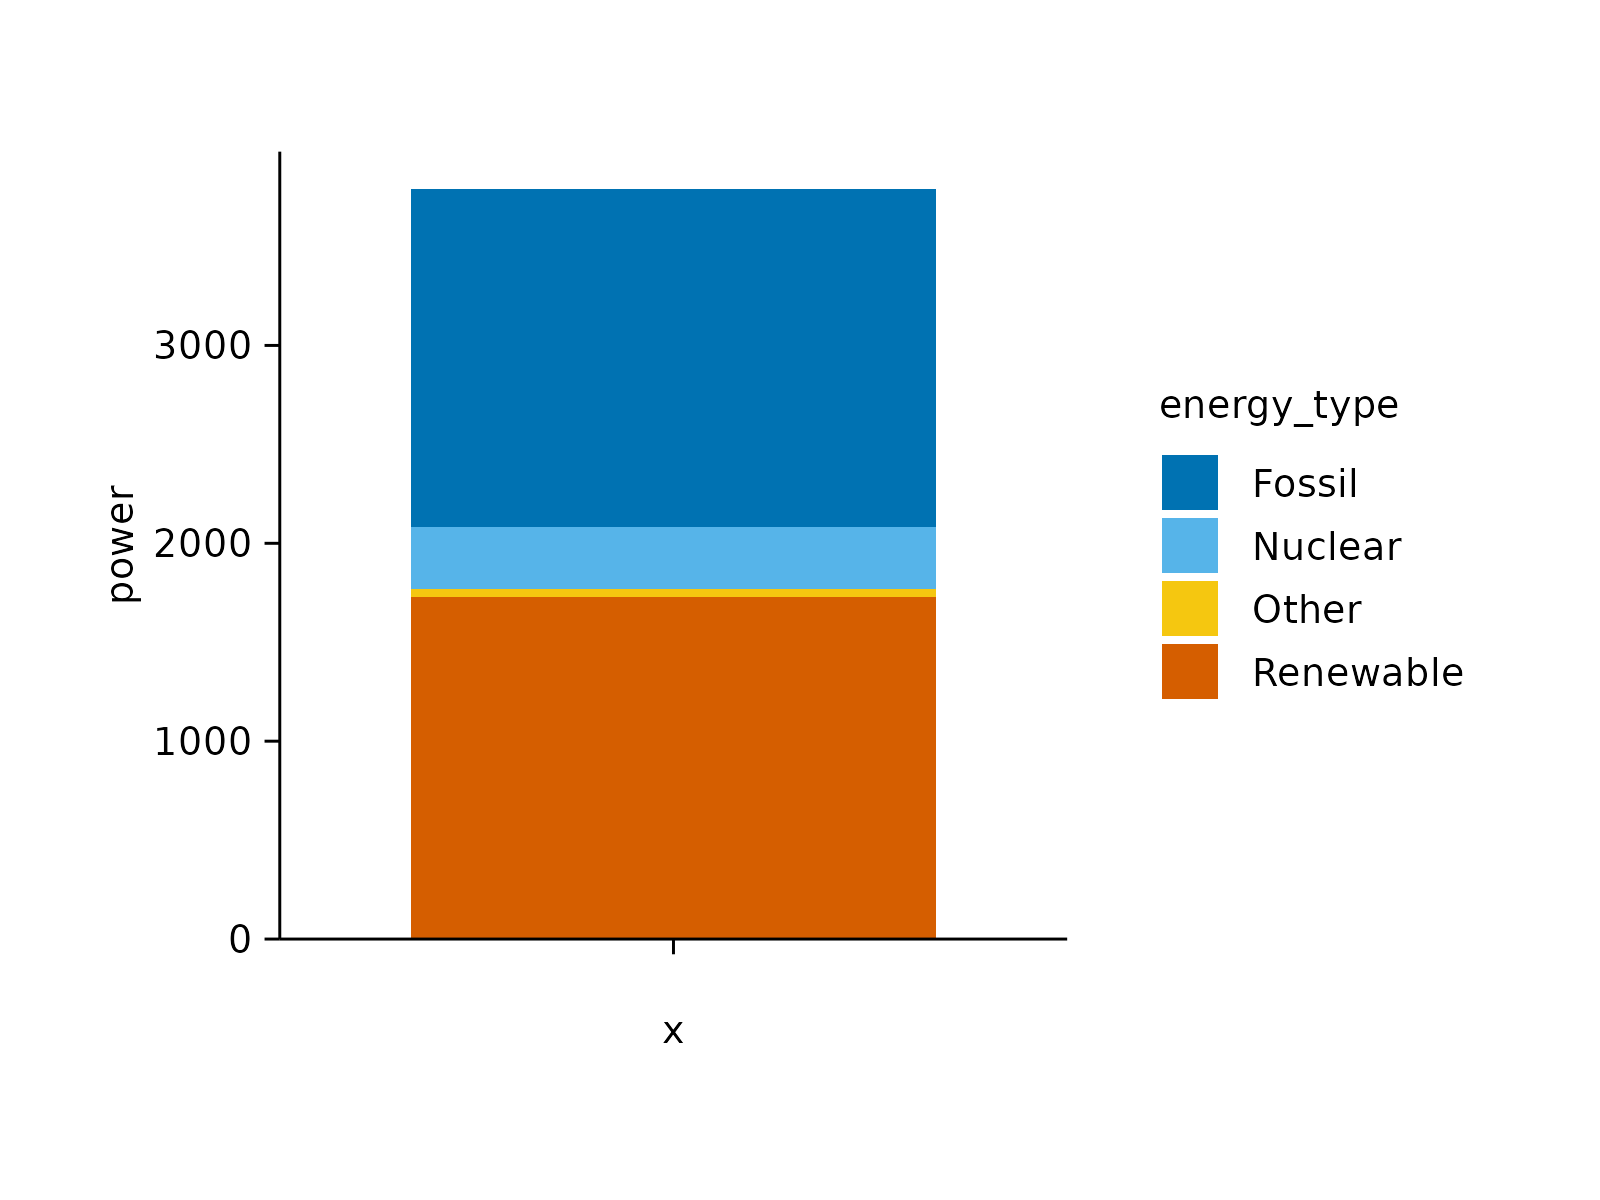
 # for a `sum` provide `color` and `y`
# `sum` of `energy` in each `energy_type` category
energy |>
tidyplot(y = energy, color = energy_type) |>
add_barstack_absolute()
# for a `sum` provide `color` and `y`
# `sum` of `energy` in each `energy_type` category
energy |>
tidyplot(y = energy, color = energy_type) |>
add_barstack_absolute()
 energy |>
tidyplot(y = energy, color = energy_type) |>
add_barstack_relative()
energy |>
tidyplot(y = energy, color = energy_type) |>
add_barstack_relative()
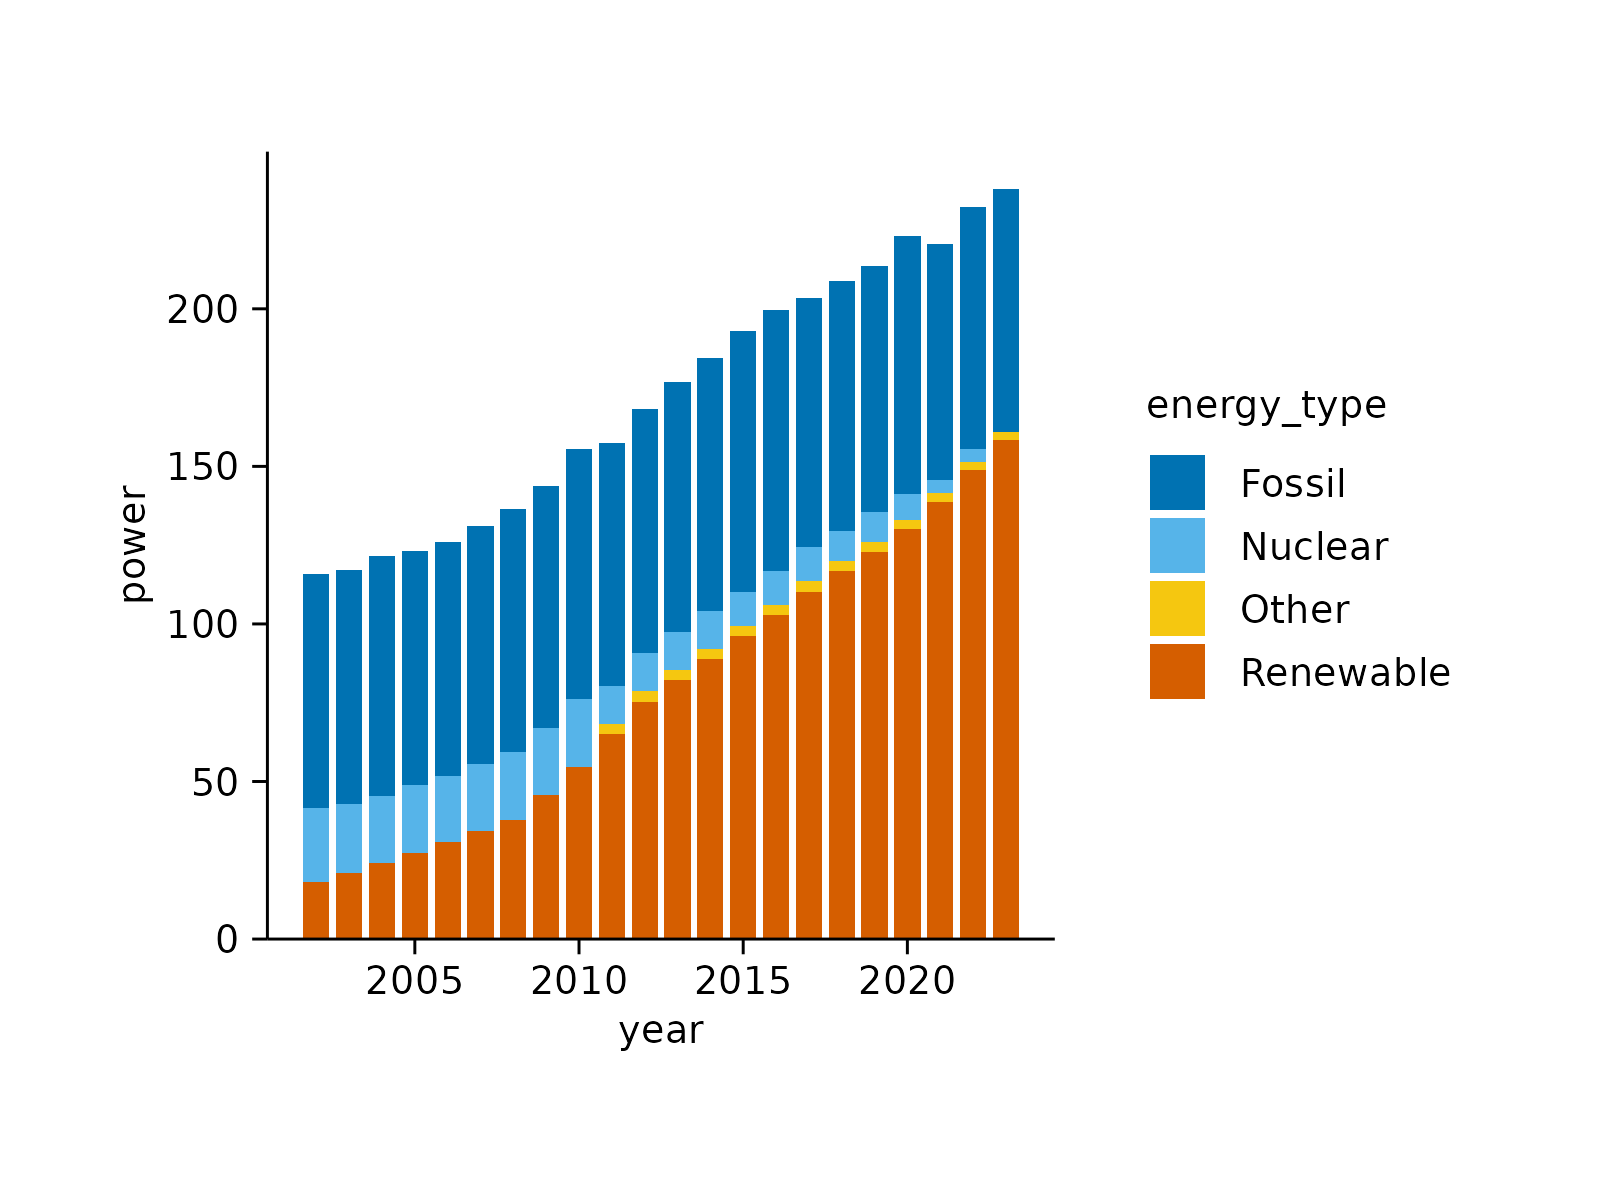
 # Include variable on second axis
energy |>
tidyplot(x = year, y = energy, color = energy_type) |>
add_barstack_absolute()
# Include variable on second axis
energy |>
tidyplot(x = year, y = energy, color = energy_type) |>
add_barstack_absolute()
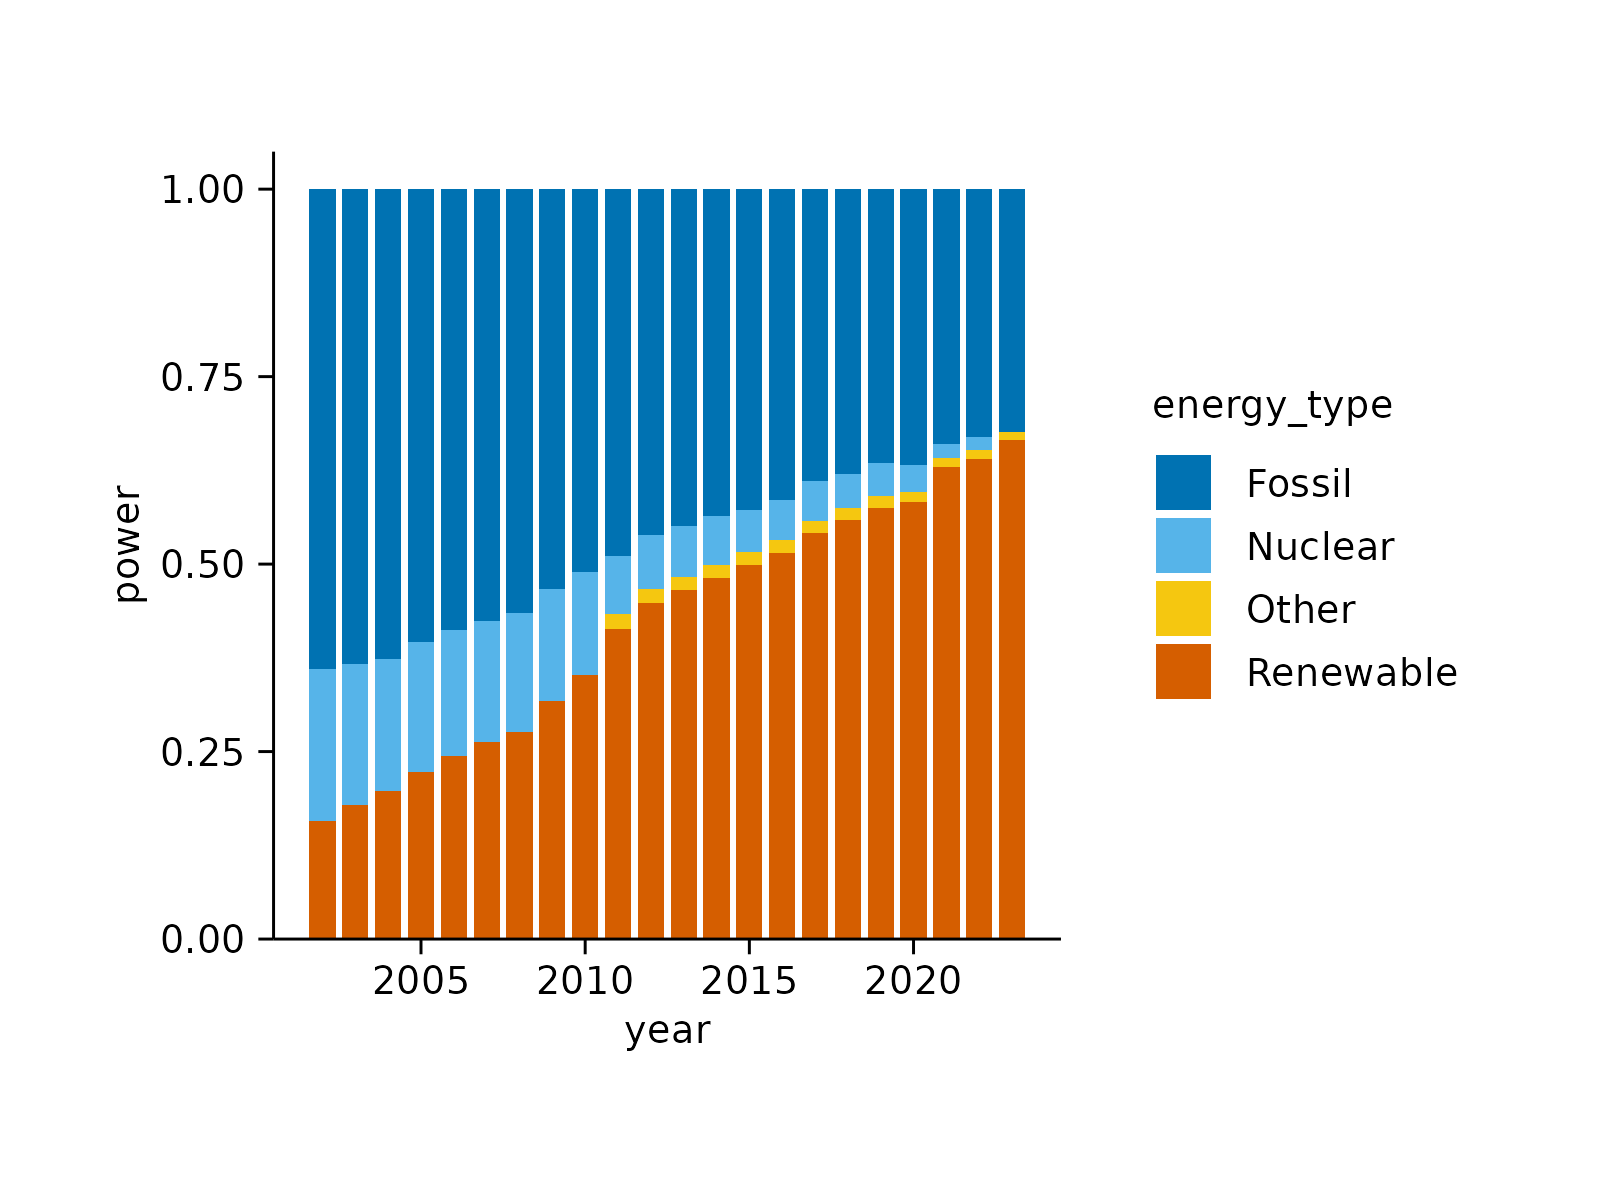
 energy |>
tidyplot(x = year, y = energy, color = energy_type) |>
add_barstack_relative()
energy |>
tidyplot(x = year, y = energy, color = energy_type) |>
add_barstack_relative()
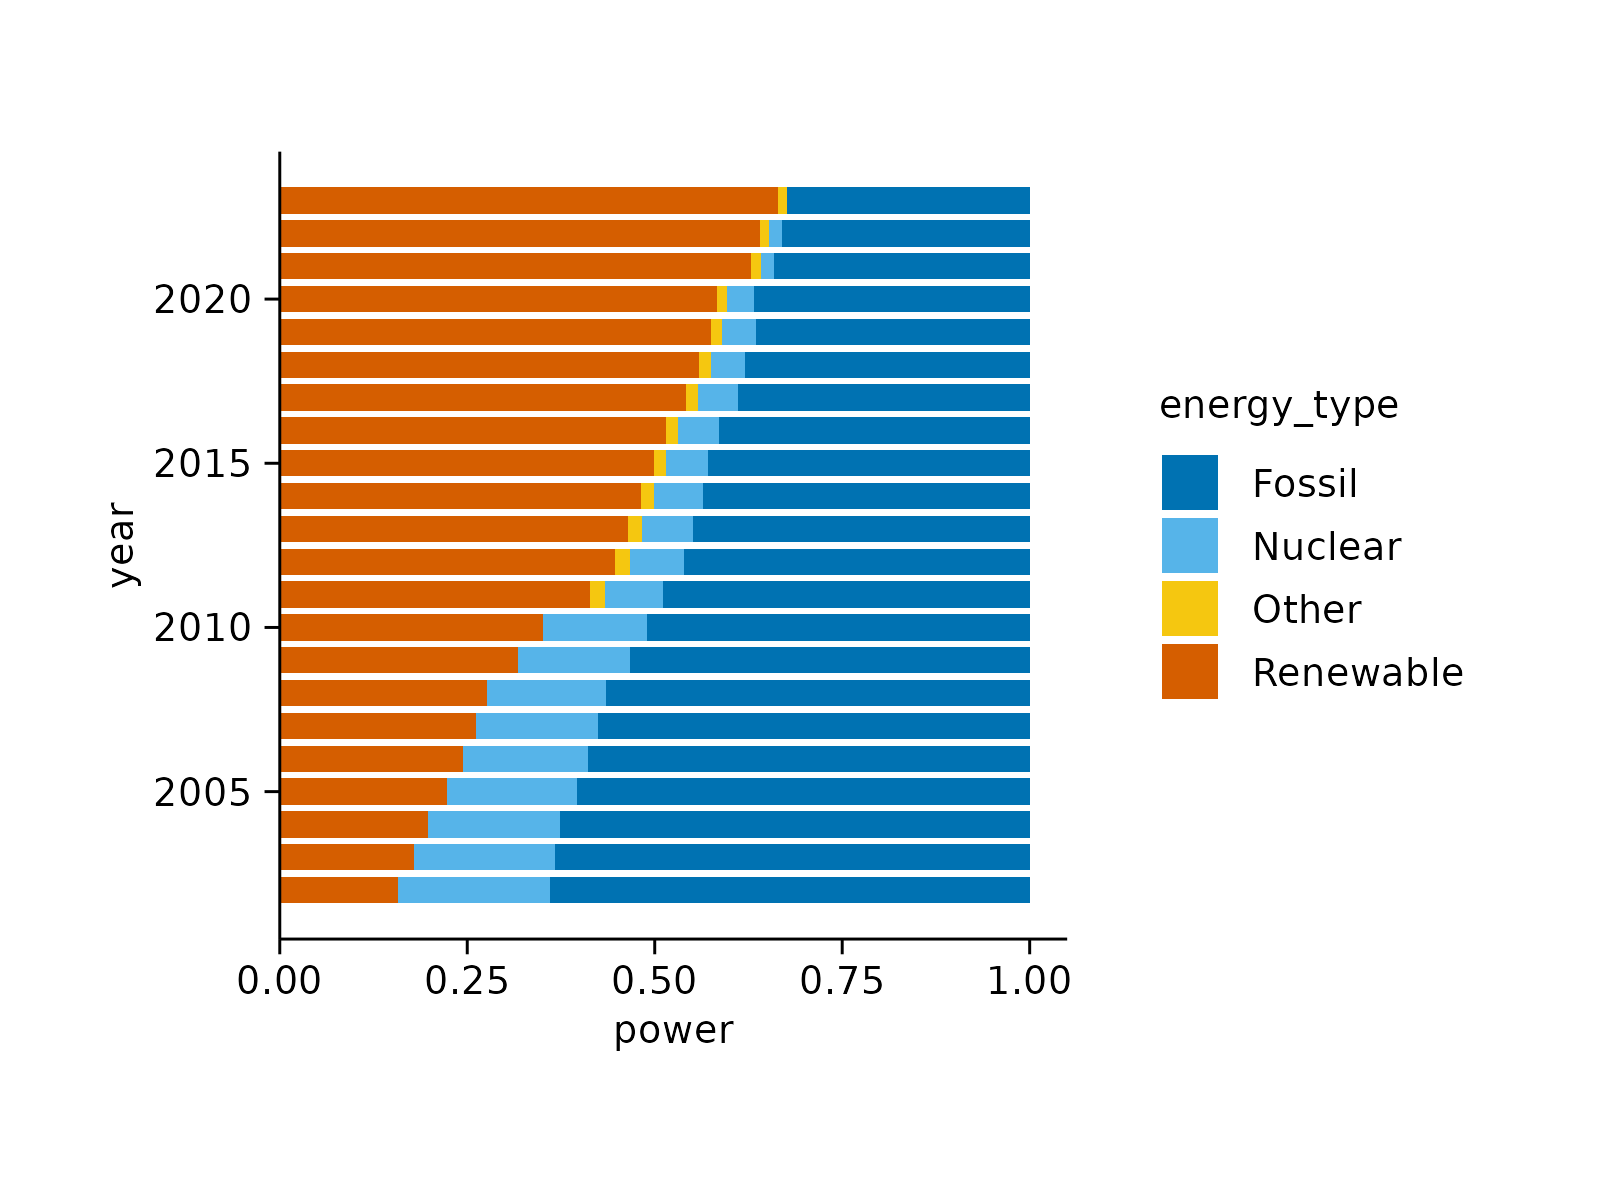
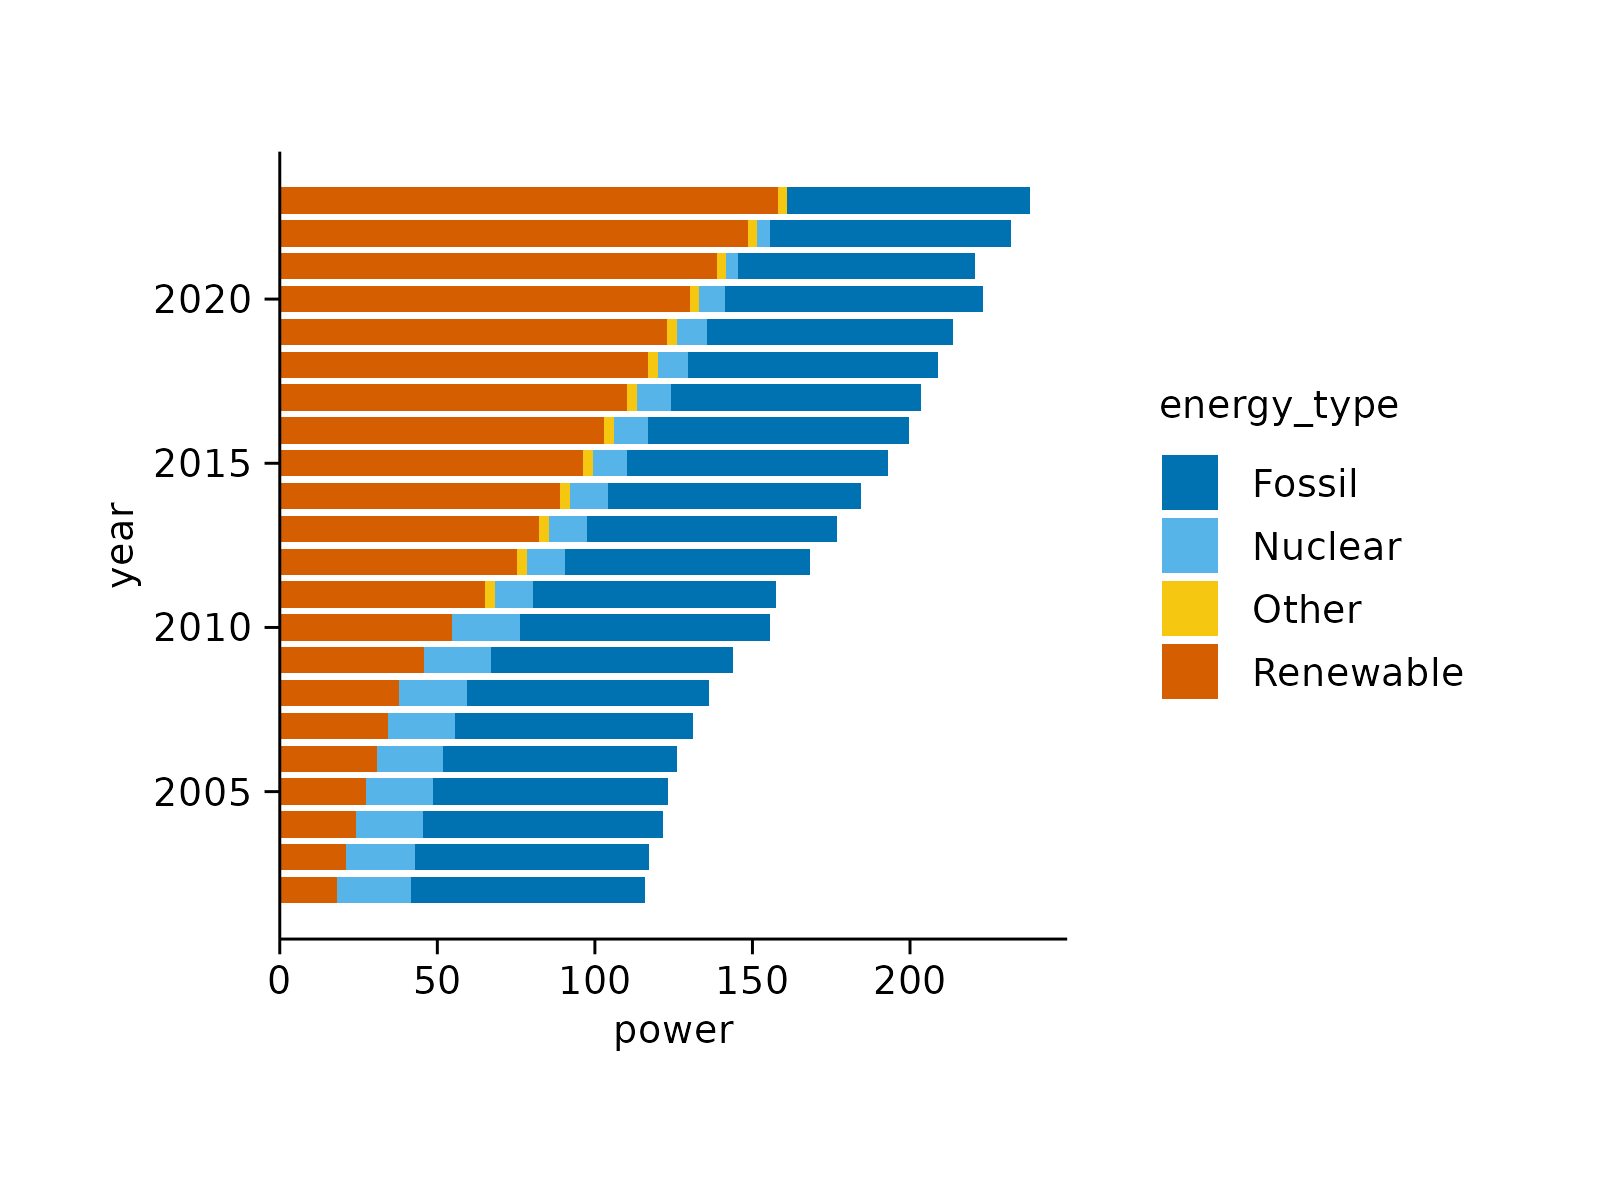
 # Flip x and y-axis
energy |>
tidyplot(x = energy, y = year, color = energy_type) |>
add_barstack_absolute(orientation = "y")
# Flip x and y-axis
energy |>
tidyplot(x = energy, y = year, color = energy_type) |>
add_barstack_absolute(orientation = "y")
 energy |>
tidyplot(x = energy, y = year, color = energy_type) |>
add_barstack_relative(orientation = "y")
energy |>
tidyplot(x = energy, y = year, color = energy_type) |>
add_barstack_relative(orientation = "y")