Adjust titles and caption
Usage
adjust_title(
  plot,
  title = ggplot2::waiver(),
  fontsize = NULL,
  family = NULL,
  face = NULL,
  color = NULL,
  ...
)

adjust_x_axis_title(
  plot,
  title = ggplot2::waiver(),
  fontsize = NULL,
  family = NULL,
  face = NULL,
  color = NULL,
  ...
)

adjust_y_axis_title(
  plot,
  title = ggplot2::waiver(),
  fontsize = NULL,
  family = NULL,
  face = NULL,
  color = NULL,
  ...
)

adjust_caption(
  plot,
  caption = ggplot2::waiver(),
  fontsize = NULL,
  family = NULL,
  face = NULL,
  color = NULL,
  ...
)
Arguments
- plot
A
tidyplotgenerated with the functiontidyplot().- title
Plot or axes title.
- fontsize
Font size in points. Defaults to
7.- family
The typeface to use. The validity of this value will depend on the graphics device being used for rendering the plot. See the systemfonts vignette for guidance on the best way to access fonts installed on your computer. The values
"sans","serif", and"mono"should always be valid and will select the default typeface for the respective styles. However, what is considered default is dependant on the graphics device and the operating system.- face
Font face ("plain", "italic", "bold", "bold.italic")
- color
A hex color for the stroke color. For example,
"#FFFFFF"for white.- ...
Arguments passed on to
ggplot2::element_text().- caption
Plot caption.
Details
Adjust the plot title, axis titles and caption
All functions support plotmath expressions to include special characters. See examples and Advanced plotting.
Examples
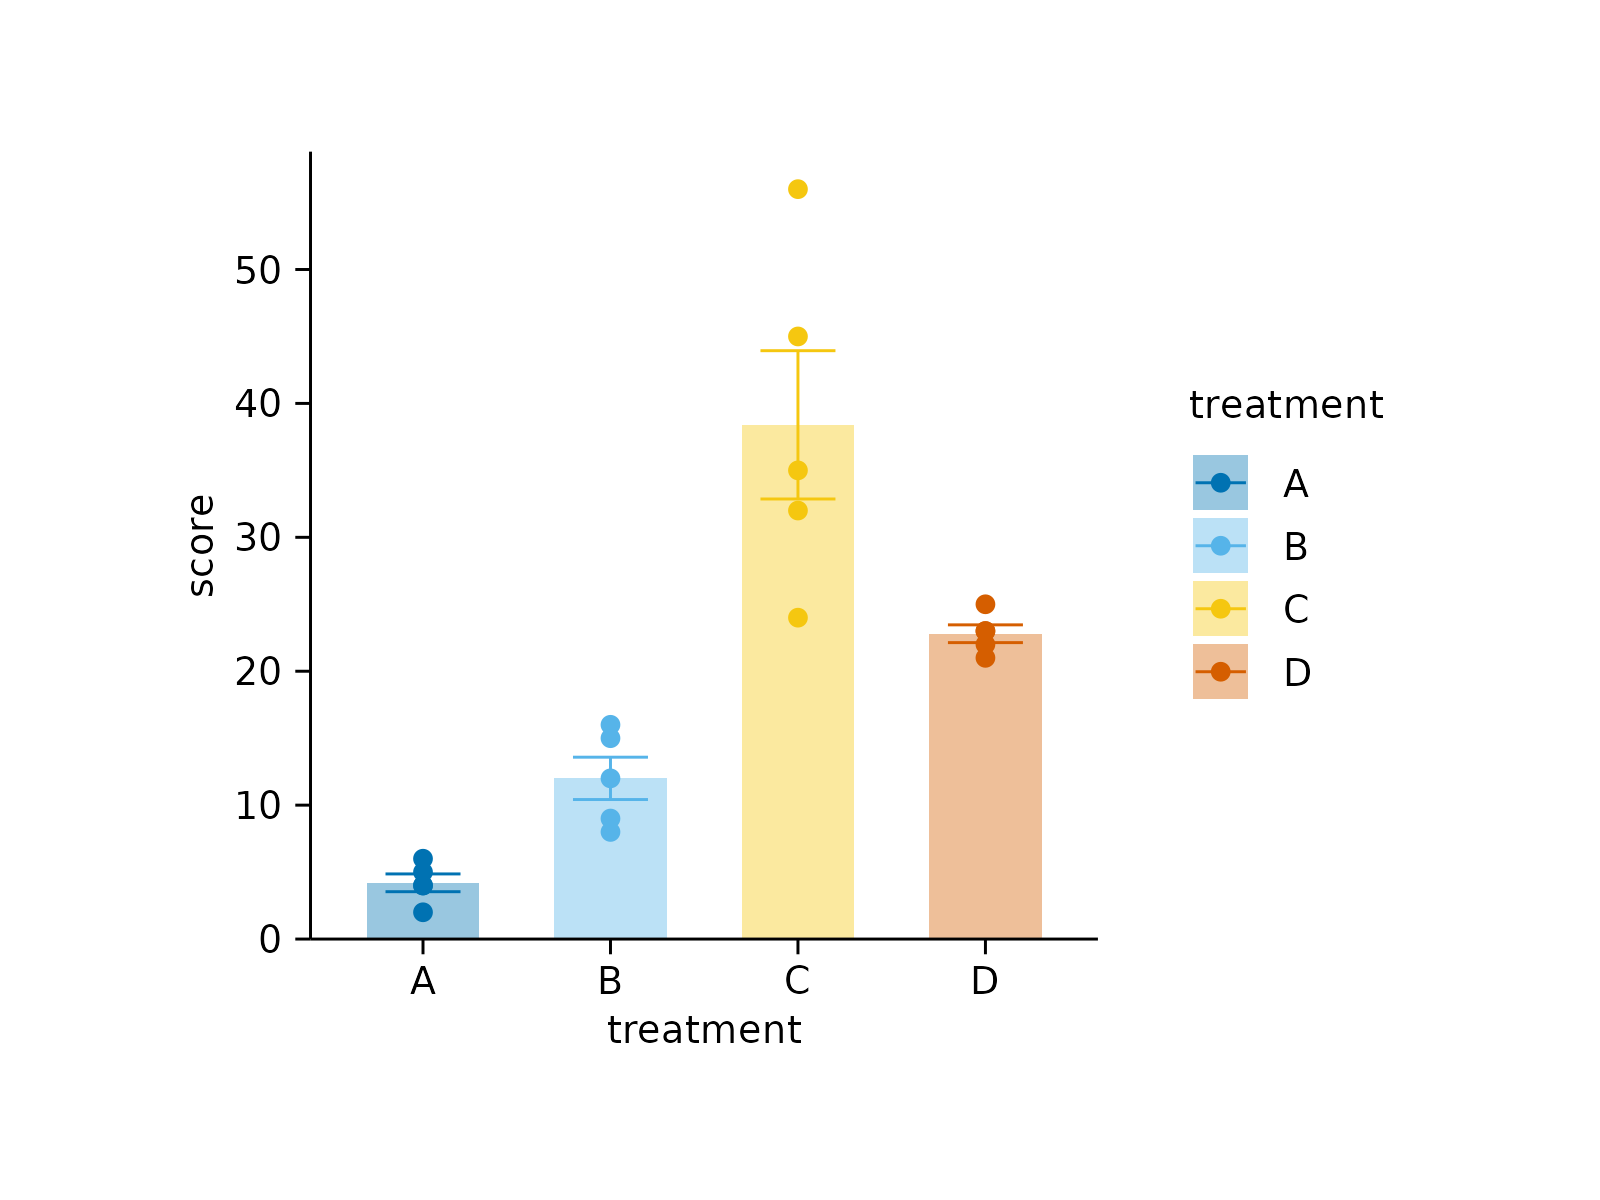
# Plot without adjustments
study |>
tidyplot(x = treatment, y = score, color = treatment) |>
add_data_points() |>
add_mean_bar(alpha = 0.4) |>
add_sem_errorbar()
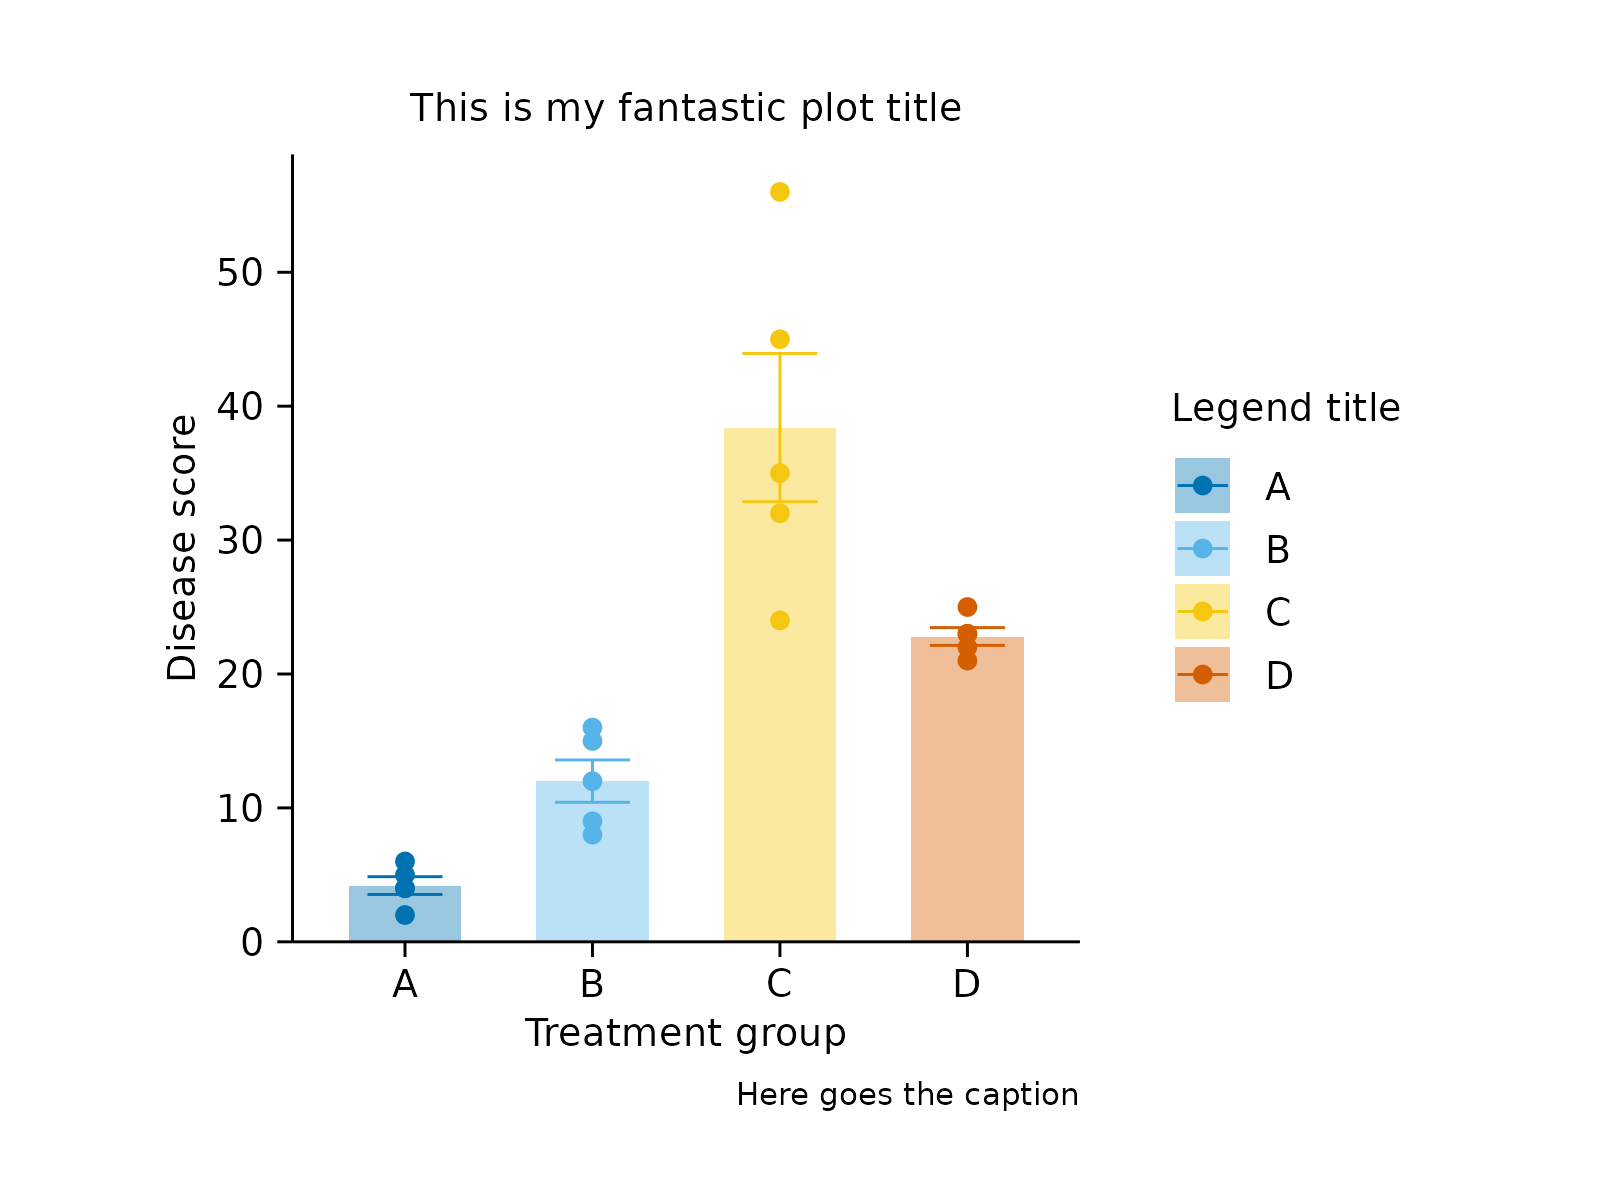
 # Adjust description
study |>
tidyplot(x = treatment, y = score, color = treatment) |>
add_data_points() |>
add_mean_bar(alpha = 0.4) |>
add_sem_errorbar() |>
adjust_title("This is my fantastic plot title") |>
adjust_x_axis_title("Treatment group") |>
adjust_y_axis_title("Disease score") |>
adjust_legend_title("Legend title") |>
adjust_caption("Here goes the caption")
# Adjust description
study |>
tidyplot(x = treatment, y = score, color = treatment) |>
add_data_points() |>
add_mean_bar(alpha = 0.4) |>
add_sem_errorbar() |>
adjust_title("This is my fantastic plot title") |>
adjust_x_axis_title("Treatment group") |>
adjust_y_axis_title("Disease score") |>
adjust_legend_title("Legend title") |>
adjust_caption("Here goes the caption")
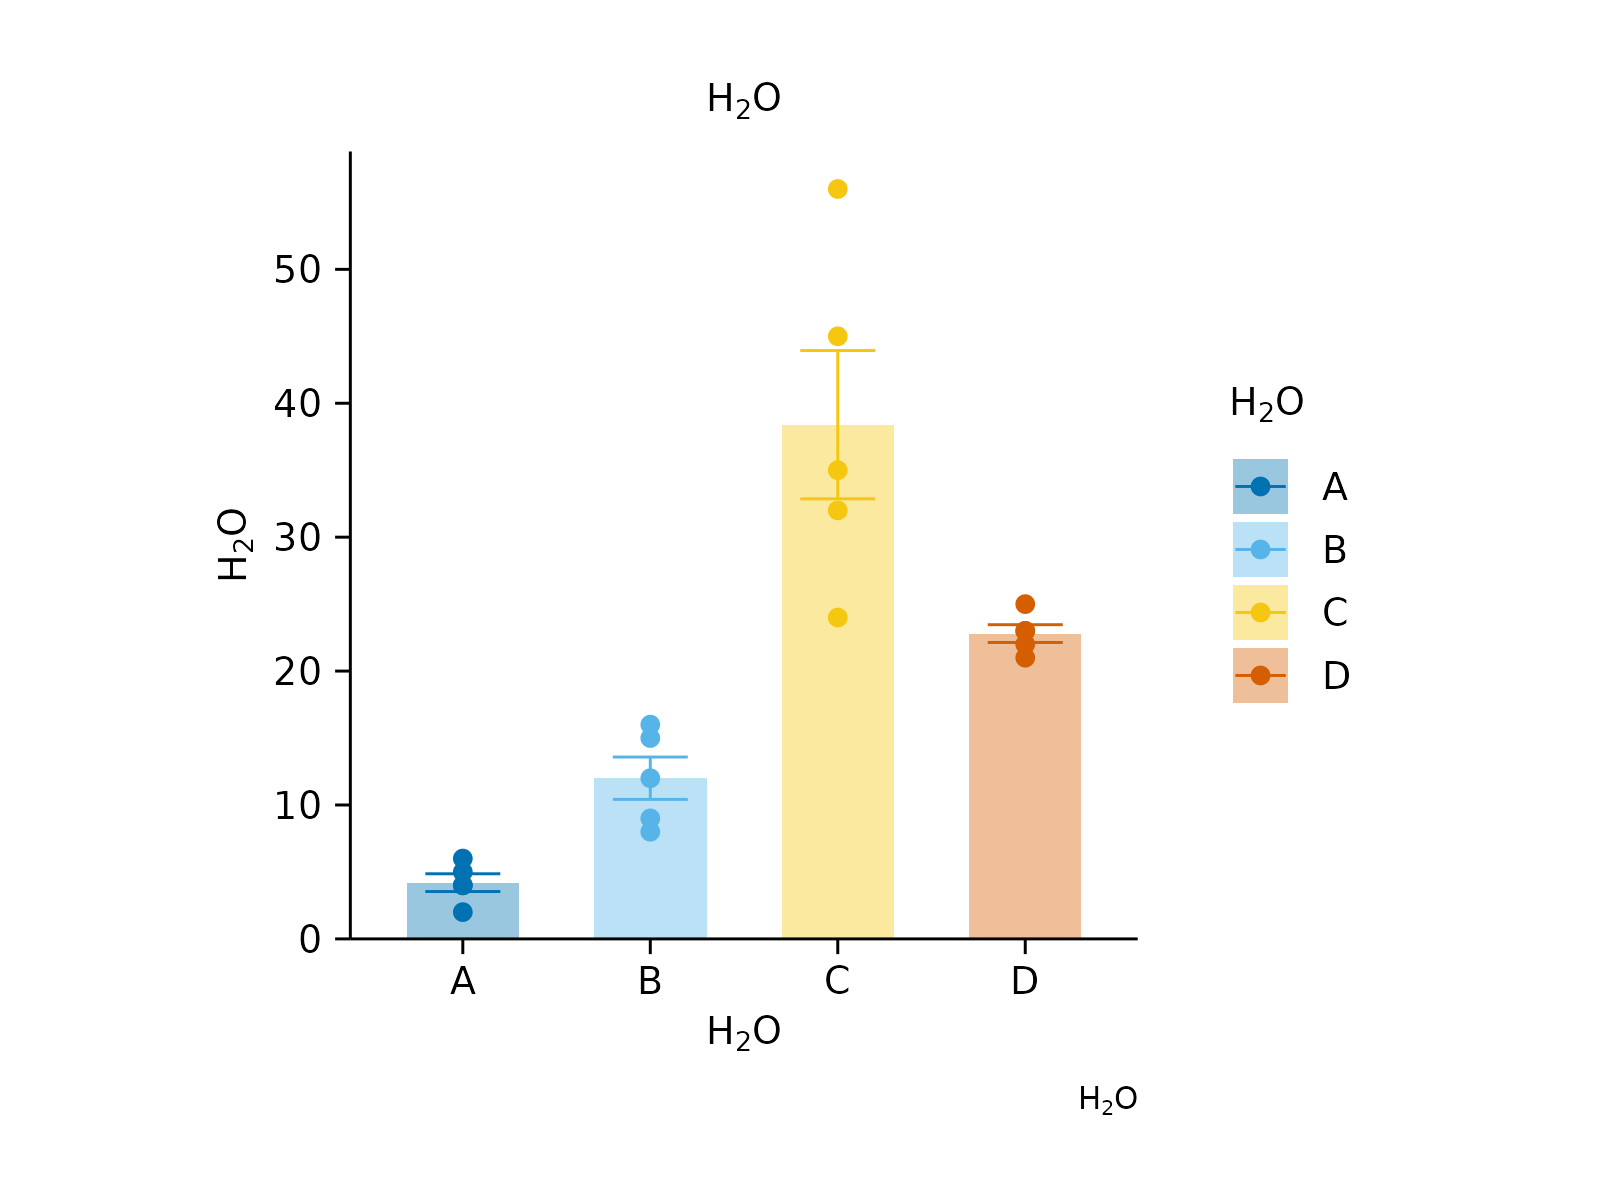
 # Plotmath expressions
study |>
tidyplot(x = treatment, y = score, color = treatment) |>
add_data_points() |>
add_mean_bar(alpha = 0.4) |>
add_sem_errorbar() |>
adjust_title("$H[2]*O$") |>
adjust_x_axis_title("$H[2]*O$") |>
adjust_y_axis_title("$H[2]*O$") |>
adjust_legend_title("$H[2]*O$") |>
adjust_caption("$H[2]*O$")
# Plotmath expressions
study |>
tidyplot(x = treatment, y = score, color = treatment) |>
add_data_points() |>
add_mean_bar(alpha = 0.4) |>
add_sem_errorbar() |>
adjust_title("$H[2]*O$") |>
adjust_x_axis_title("$H[2]*O$") |>
adjust_y_axis_title("$H[2]*O$") |>
adjust_legend_title("$H[2]*O$") |>
adjust_caption("$H[2]*O$")