Adjust legend
Usage
adjust_legend_title(
  plot,
  title = ggplot2::waiver(),
  fontsize = NULL,
  family = NULL,
  face = NULL,
  color = NULL,
  ...
)

adjust_legend_position(plot, position = "right")
Arguments
- plot
A
tidyplotgenerated with the functiontidyplot().- title
Legend title.
- fontsize
Font size in points. Defaults to
7.- family
The typeface to use. The validity of this value will depend on the graphics device being used for rendering the plot. See the systemfonts vignette for guidance on the best way to access fonts installed on your computer. The values
"sans","serif", and"mono"should always be valid and will select the default typeface for the respective styles. However, what is considered default is dependant on the graphics device and the operating system.- face
Font face ("plain", "italic", "bold", "bold.italic")
- color
A hex color for the stroke color. For example,
"#FFFFFF"for white.- ...
Arguments passed on to
ggplot2::element_text().- position
The position of the legend. Can be one of
c("right", "left", "bottom", "top", "none"). Defaults to"right".
Details
The
titleargument ofadjust_legend_title()supports plotmath expressions to include special characters. See examples and Advanced plotting.
Examples
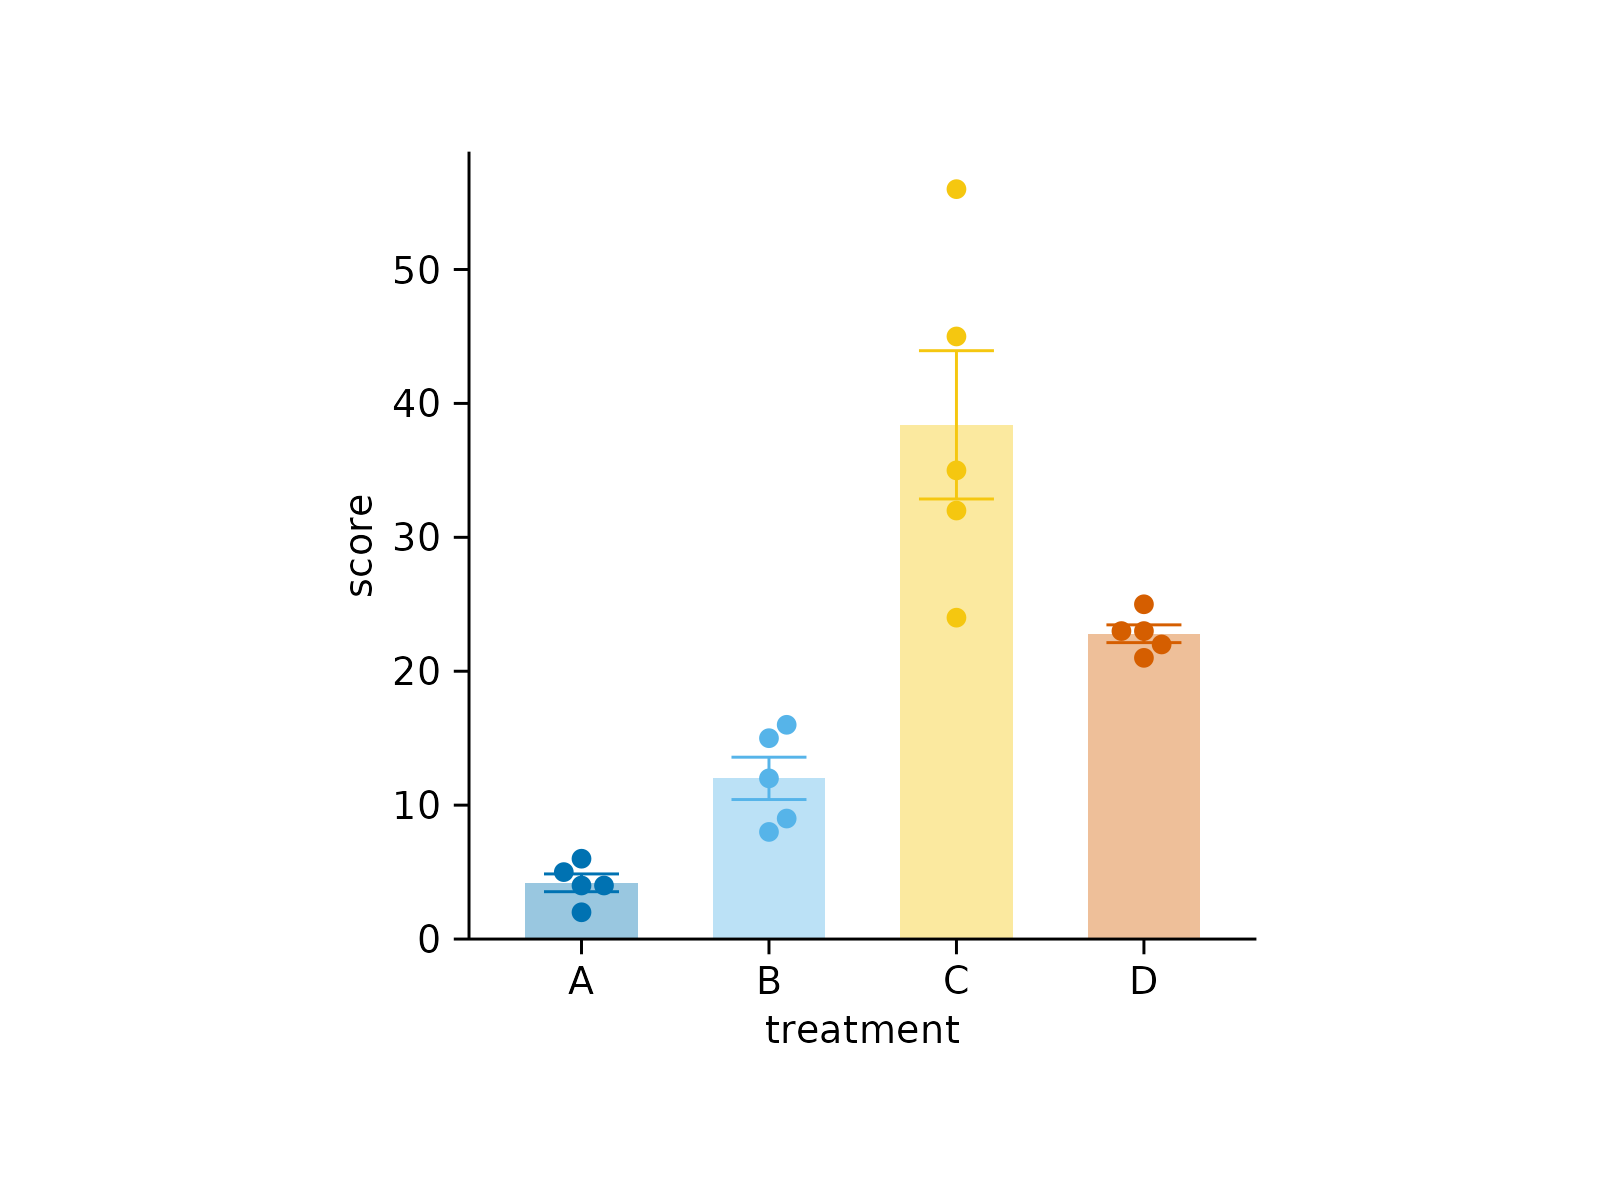
# Plot without adjustments
study |>
tidyplot(x = treatment, y = score, color = treatment) |>
add_data_points_beeswarm() |>
add_mean_bar(alpha = 0.4) |>
add_sem_errorbar()
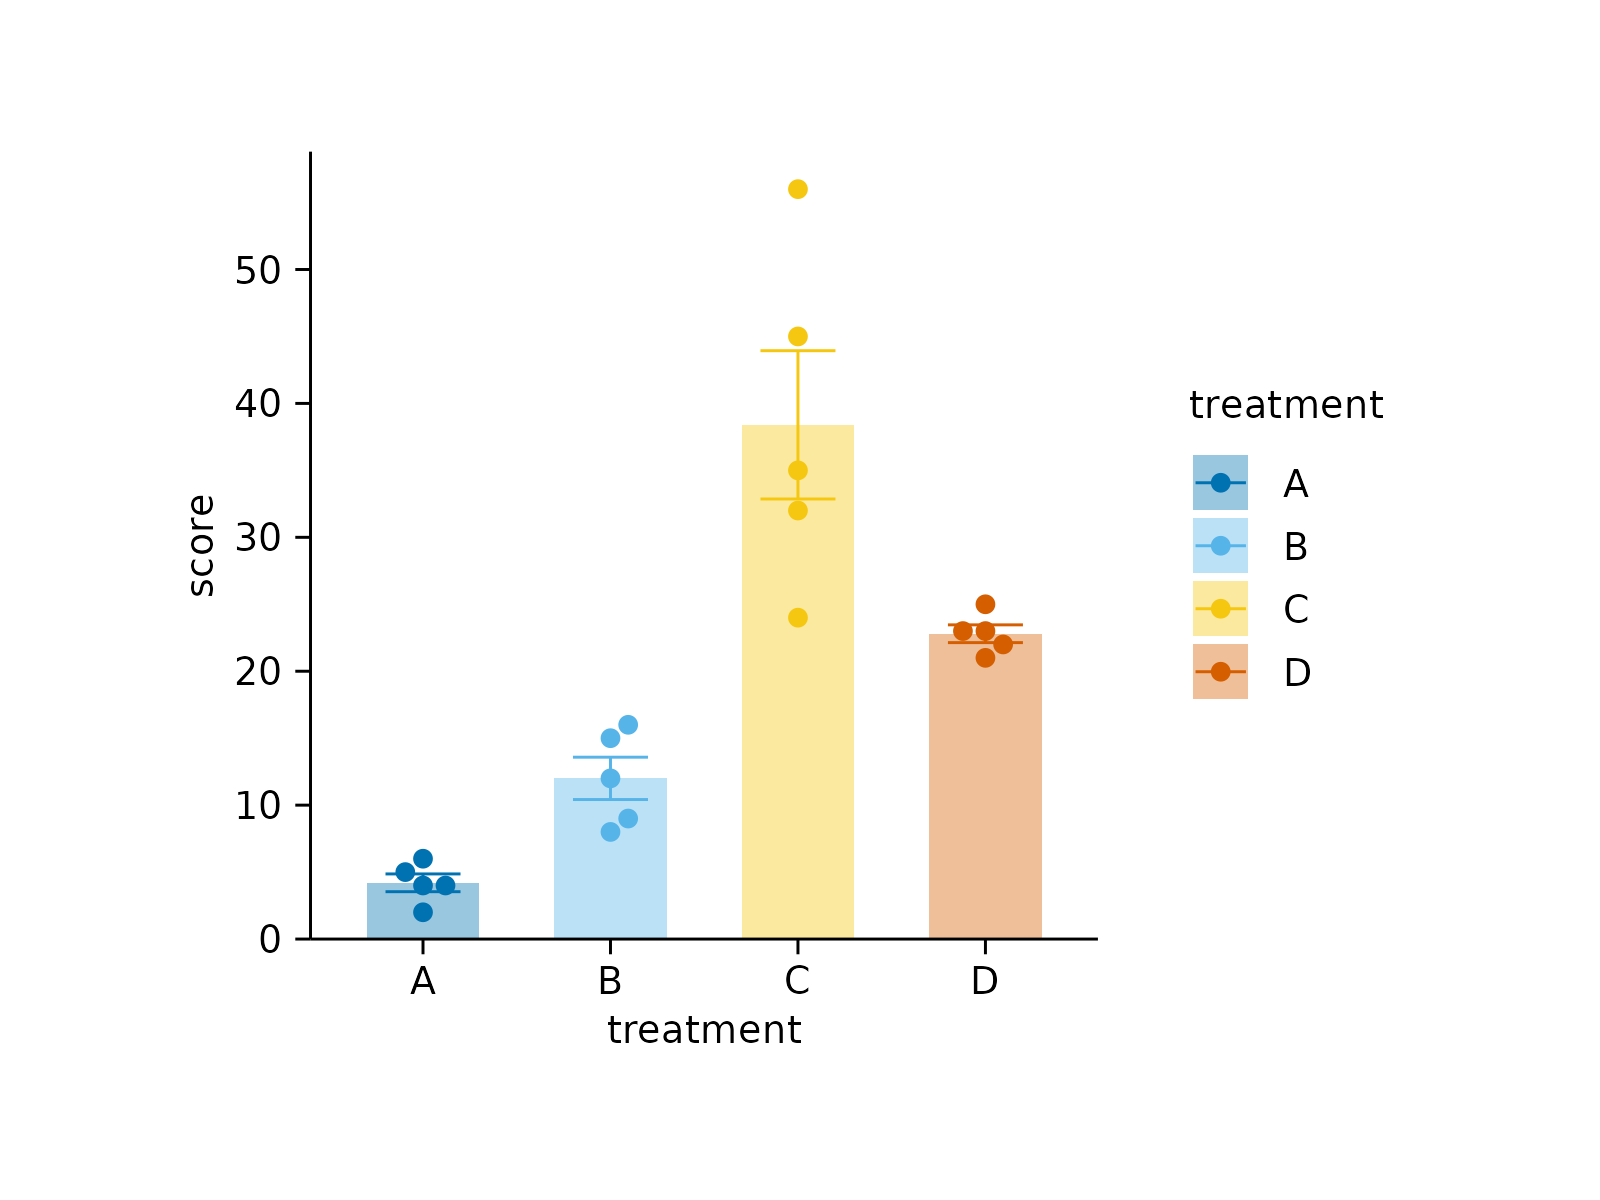 # New title
study |>
tidyplot(x = treatment, y = score, color = treatment) |>
add_data_points_beeswarm() |>
add_mean_bar(alpha = 0.4) |>
add_sem_errorbar() |>
adjust_legend_title("My new legend title")
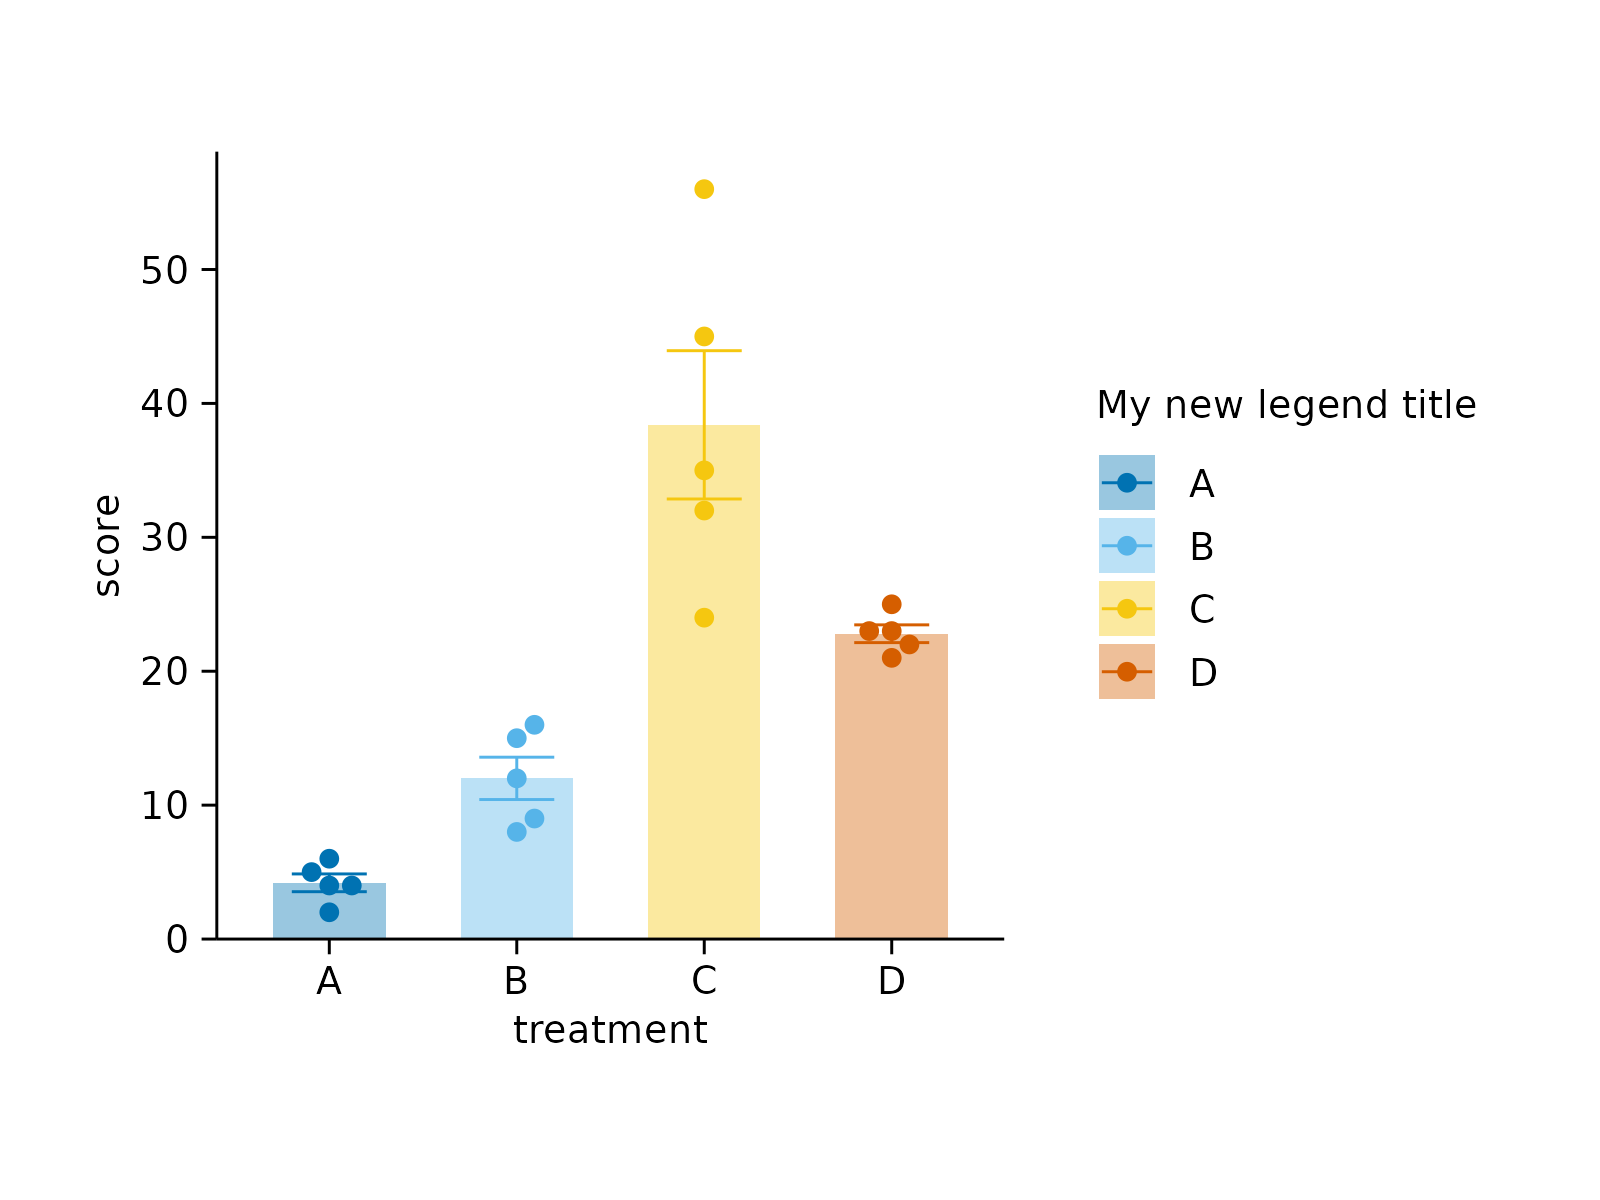
# New title
study |>
tidyplot(x = treatment, y = score, color = treatment) |>
add_data_points_beeswarm() |>
add_mean_bar(alpha = 0.4) |>
add_sem_errorbar() |>
adjust_legend_title("My new legend title")
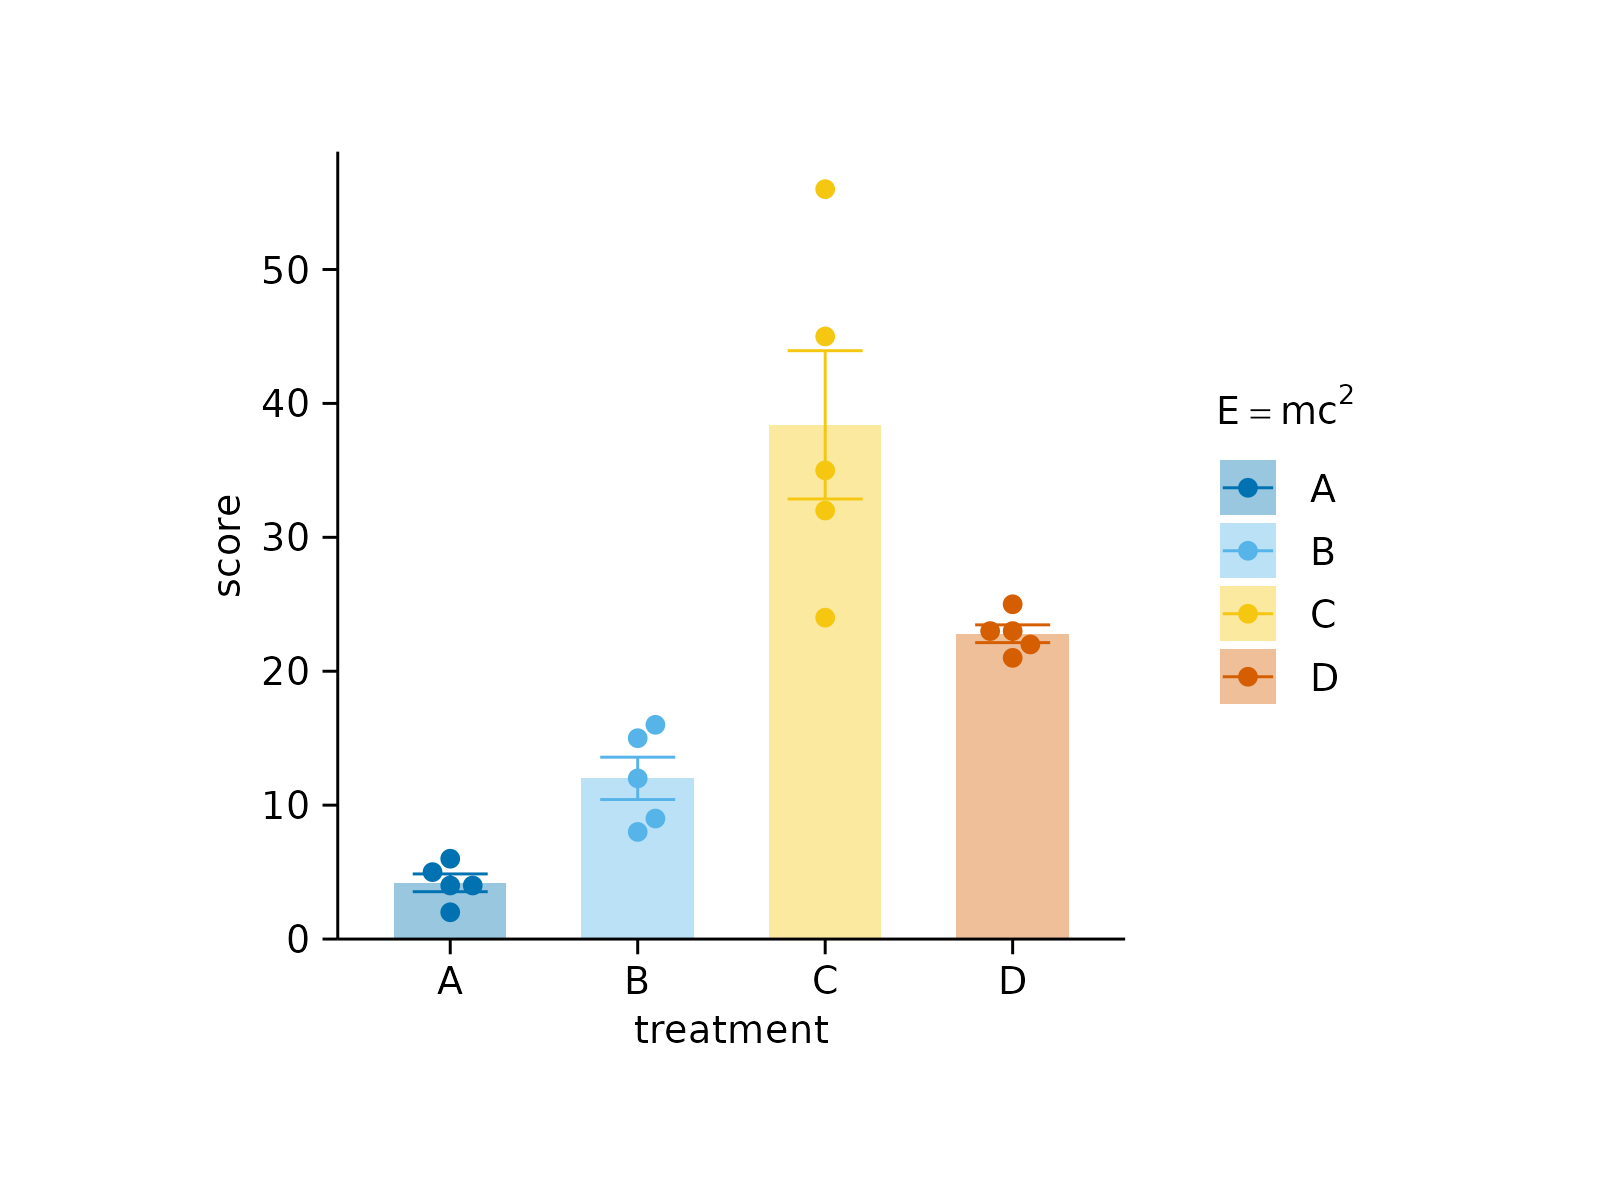
 # New title with plotmath expression
study |>
tidyplot(x = treatment, y = score, color = treatment) |>
add_data_points_beeswarm() |>
add_mean_bar(alpha = 0.4) |>
add_sem_errorbar() |>
adjust_legend_title("$E==m*c^{2}$")
# New title with plotmath expression
study |>
tidyplot(x = treatment, y = score, color = treatment) |>
add_data_points_beeswarm() |>
add_mean_bar(alpha = 0.4) |>
add_sem_errorbar() |>
adjust_legend_title("$E==m*c^{2}$")
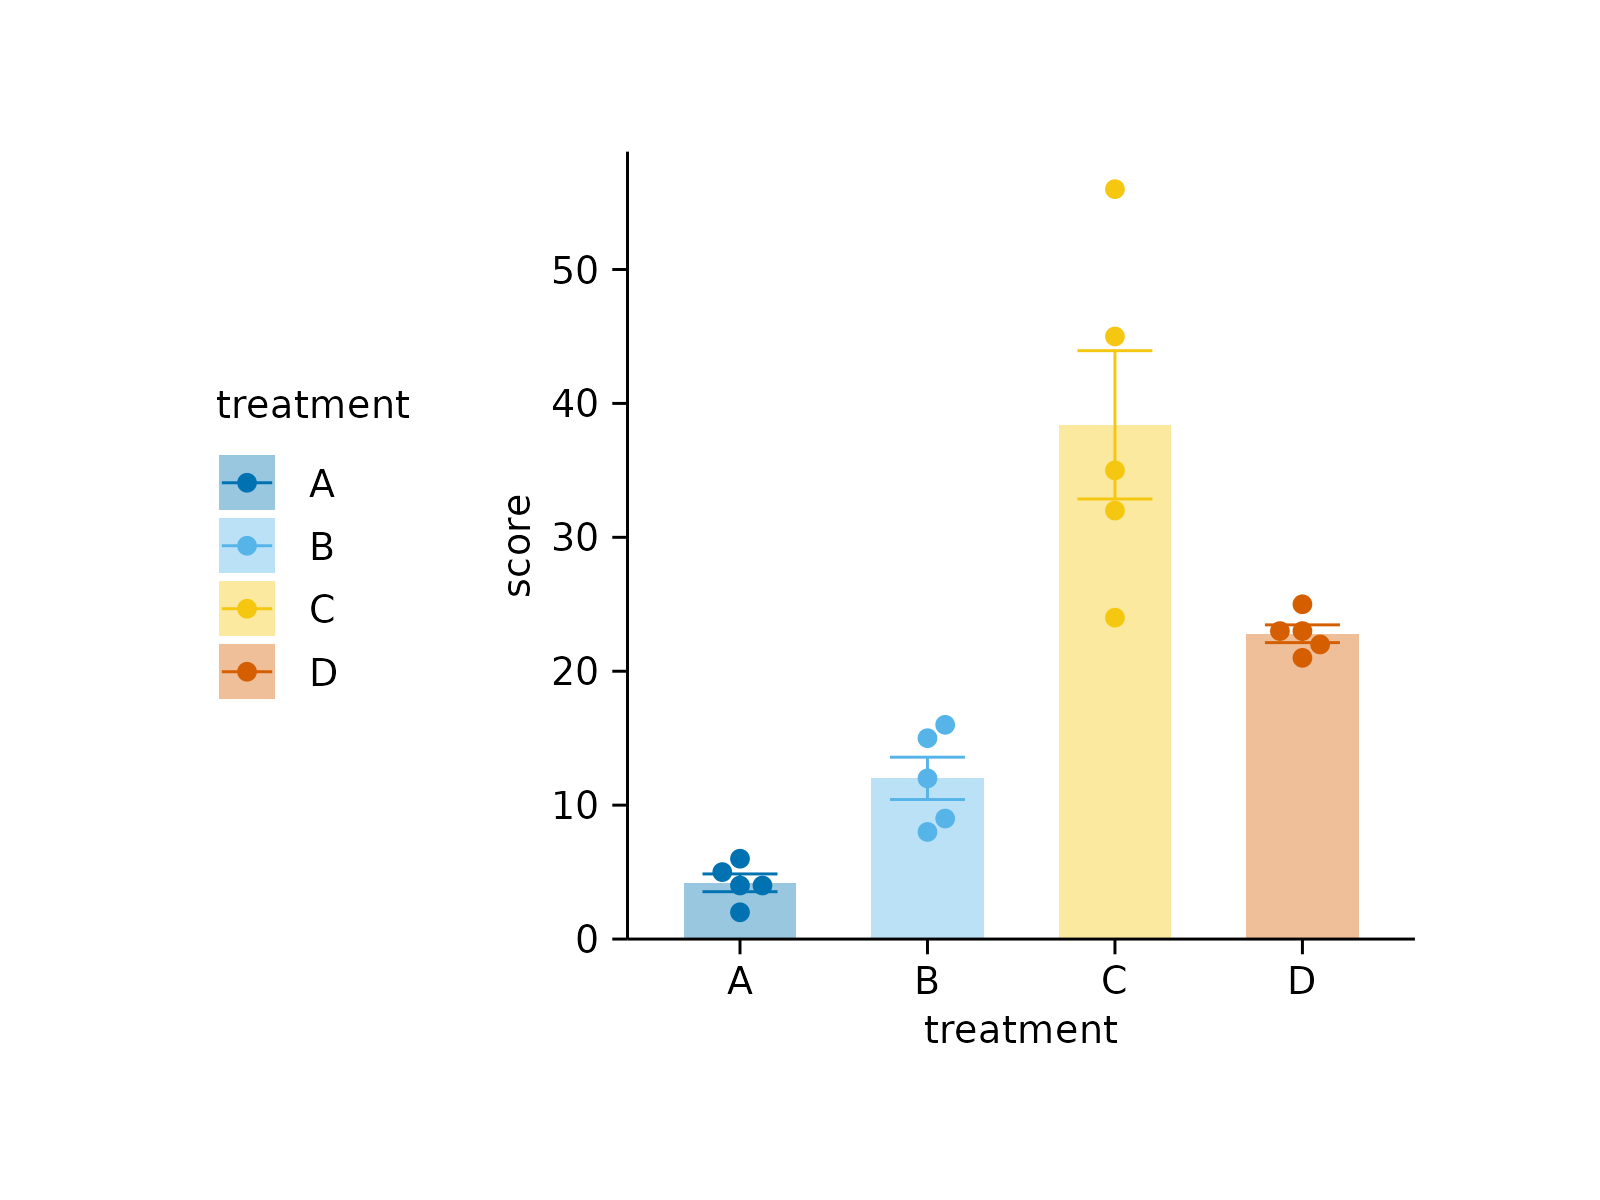
 # Alternative legend positions
study |>
tidyplot(x = treatment, y = score, color = treatment) |>
add_data_points_beeswarm() |>
add_mean_bar(alpha = 0.4) |>
add_sem_errorbar() |>
adjust_legend_position("left")
# Alternative legend positions
study |>
tidyplot(x = treatment, y = score, color = treatment) |>
add_data_points_beeswarm() |>
add_mean_bar(alpha = 0.4) |>
add_sem_errorbar() |>
adjust_legend_position("left")
 study |>
tidyplot(x = treatment, y = score, color = treatment) |>
add_data_points_beeswarm() |>
add_mean_bar(alpha = 0.4) |>
add_sem_errorbar() |>
adjust_legend_position("top")
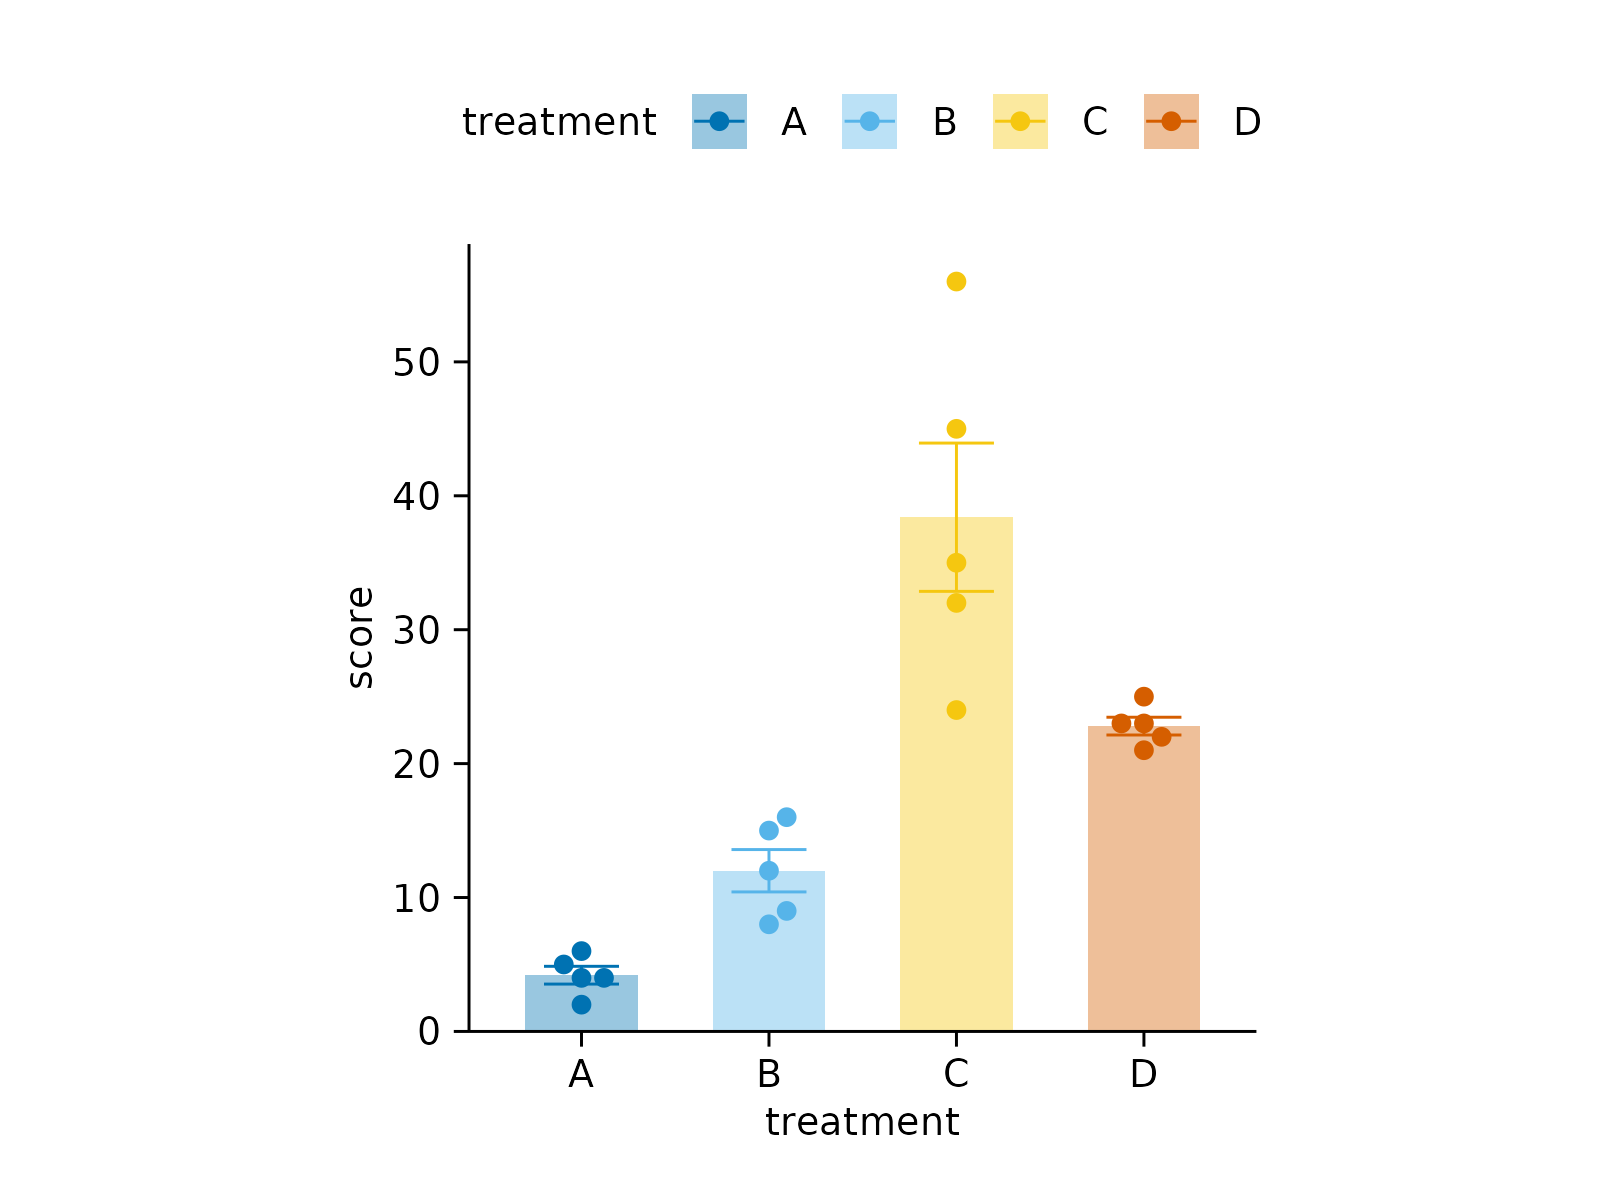
study |>
tidyplot(x = treatment, y = score, color = treatment) |>
add_data_points_beeswarm() |>
add_mean_bar(alpha = 0.4) |>
add_sem_errorbar() |>
adjust_legend_position("top")
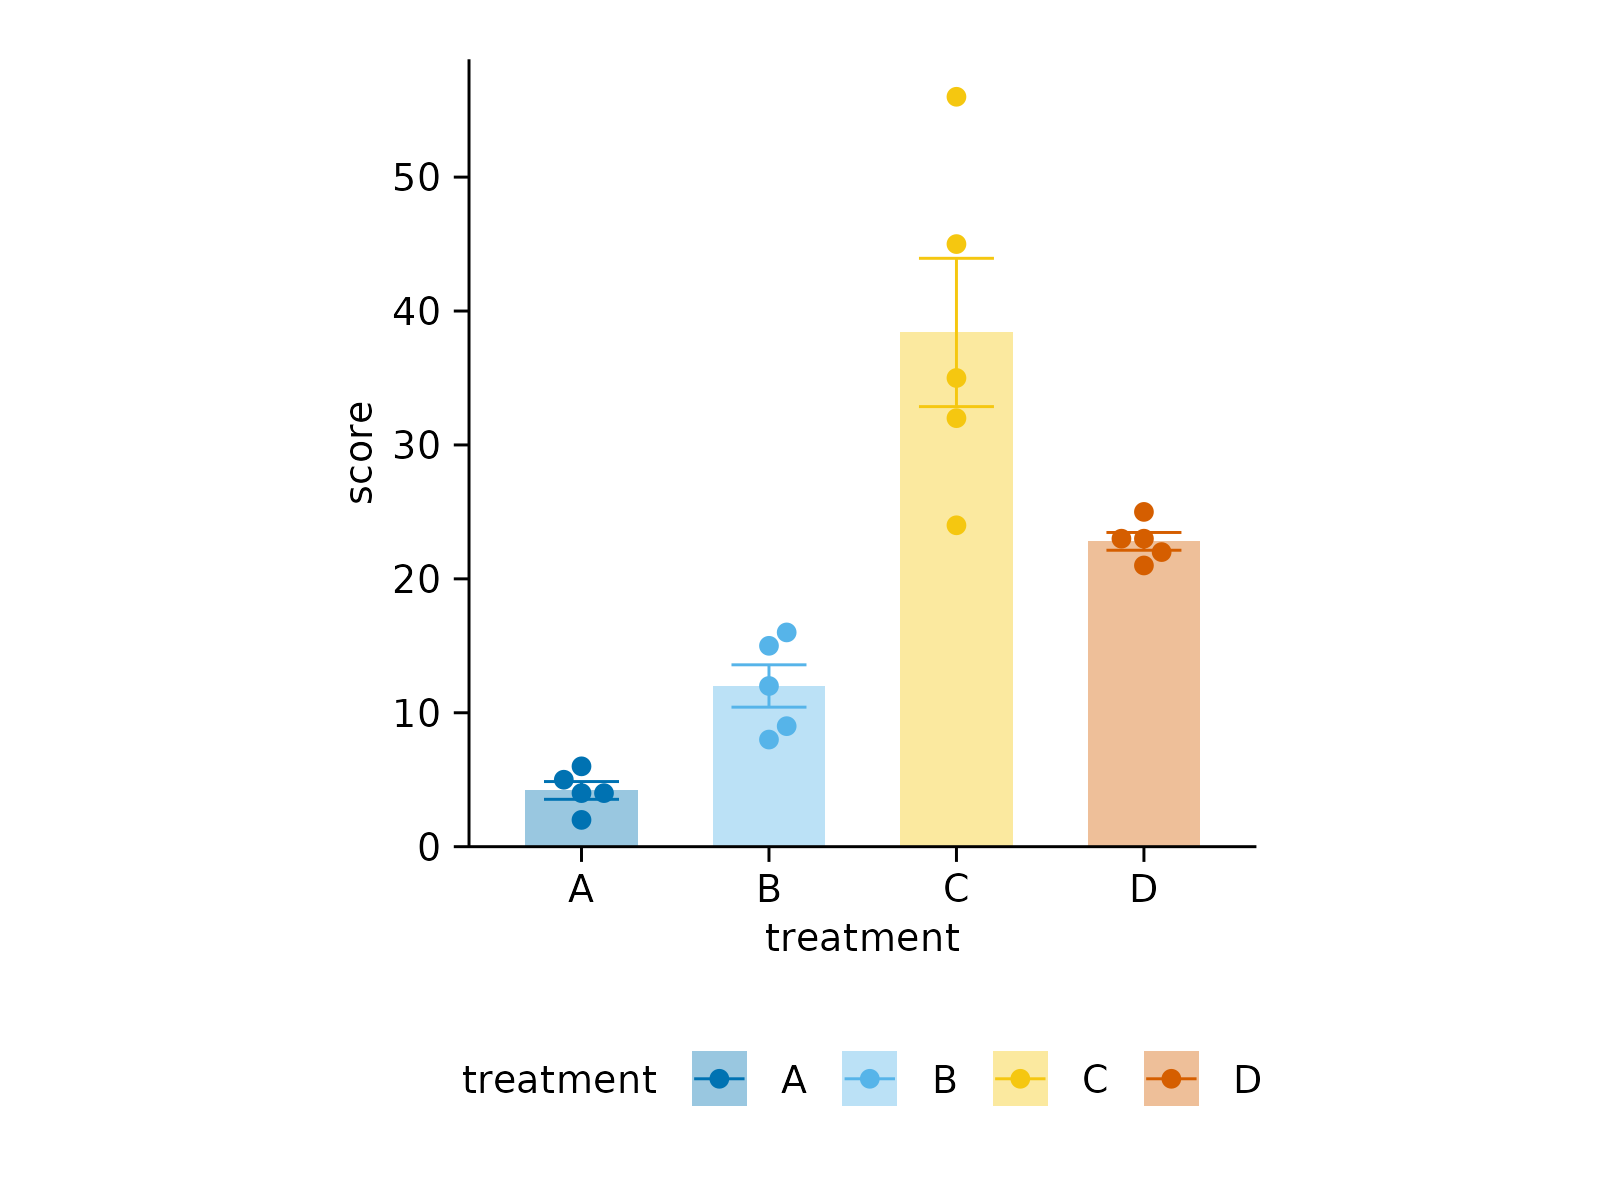
 study |>
tidyplot(x = treatment, y = score, color = treatment) |>
add_data_points_beeswarm() |>
add_mean_bar(alpha = 0.4) |>
add_sem_errorbar() |>
adjust_legend_position("bottom")
study |>
tidyplot(x = treatment, y = score, color = treatment) |>
add_data_points_beeswarm() |>
add_mean_bar(alpha = 0.4) |>
add_sem_errorbar() |>
adjust_legend_position("bottom")
 # `position = "none"` hides the legend
study |>
tidyplot(x = treatment, y = score, color = treatment) |>
add_data_points_beeswarm() |>
add_mean_bar(alpha = 0.4) |>
add_sem_errorbar() |>
adjust_legend_position("none")
# `position = "none"` hides the legend
study |>
tidyplot(x = treatment, y = score, color = treatment) |>
add_data_points_beeswarm() |>
add_mean_bar(alpha = 0.4) |>
add_sem_errorbar() |>
adjust_legend_position("none")