Adjust plot area size
Arguments
- plot
A
tidyplotgenerated with the functiontidyplot().- width
Width of the plot area. Defaults to
50.- height
Height of the plot area. Defaults to
50.- unit
Unit of the plot area width and height. Defaults to
mm.
Examples
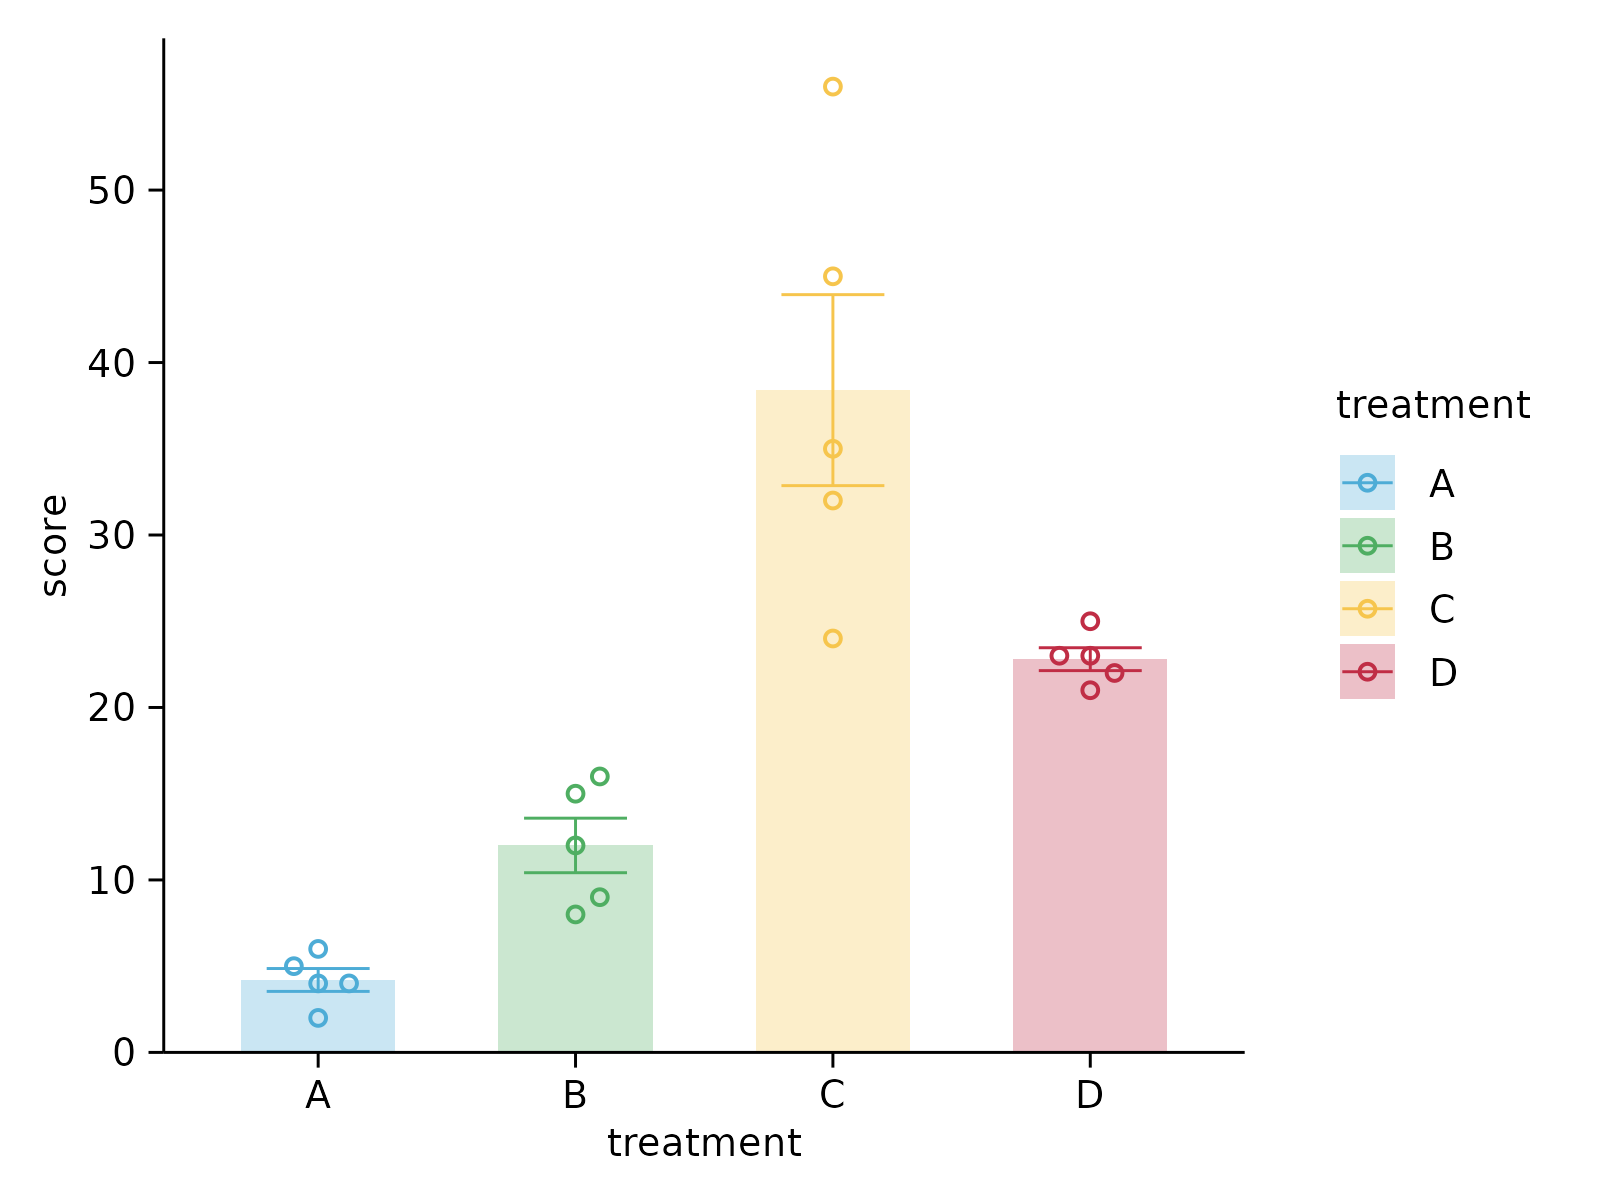
# Plot without adjustments
study %>%
tidyplot(x = treatment, y = score, color = treatment) %>%
add_data_points_beeswarm(shape = 1) %>%
add_mean_bar(alpha = 0.3) %>%
add_sem_bar()
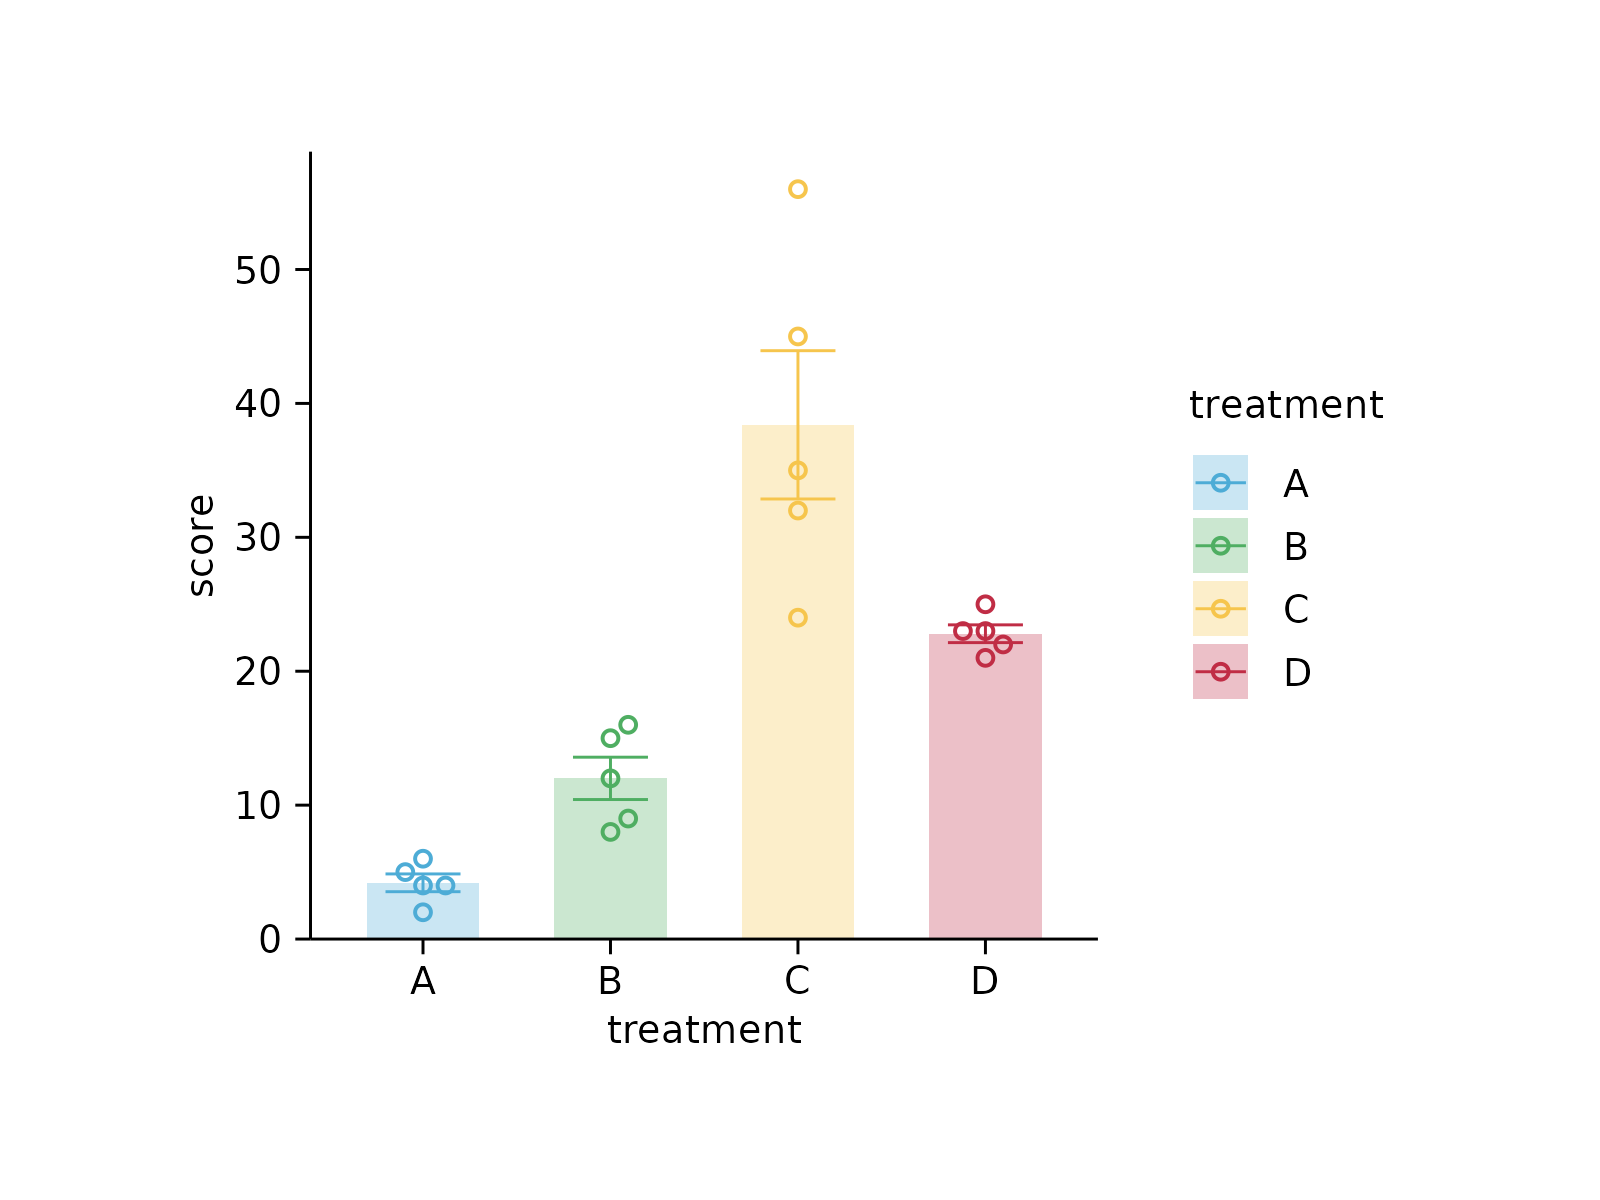 # Resize to 20 x 20 mm
study %>%
tidyplot(x = treatment, y = score, color = treatment) %>%
add_data_points_beeswarm(shape = 1) %>%
add_mean_bar(alpha = 0.3) %>%
add_sem_bar() %>%
adjust_plot_area_size(width = 20, height = 20)
# Resize to 20 x 20 mm
study %>%
tidyplot(x = treatment, y = score, color = treatment) %>%
add_data_points_beeswarm(shape = 1) %>%
add_mean_bar(alpha = 0.3) %>%
add_sem_bar() %>%
adjust_plot_area_size(width = 20, height = 20)
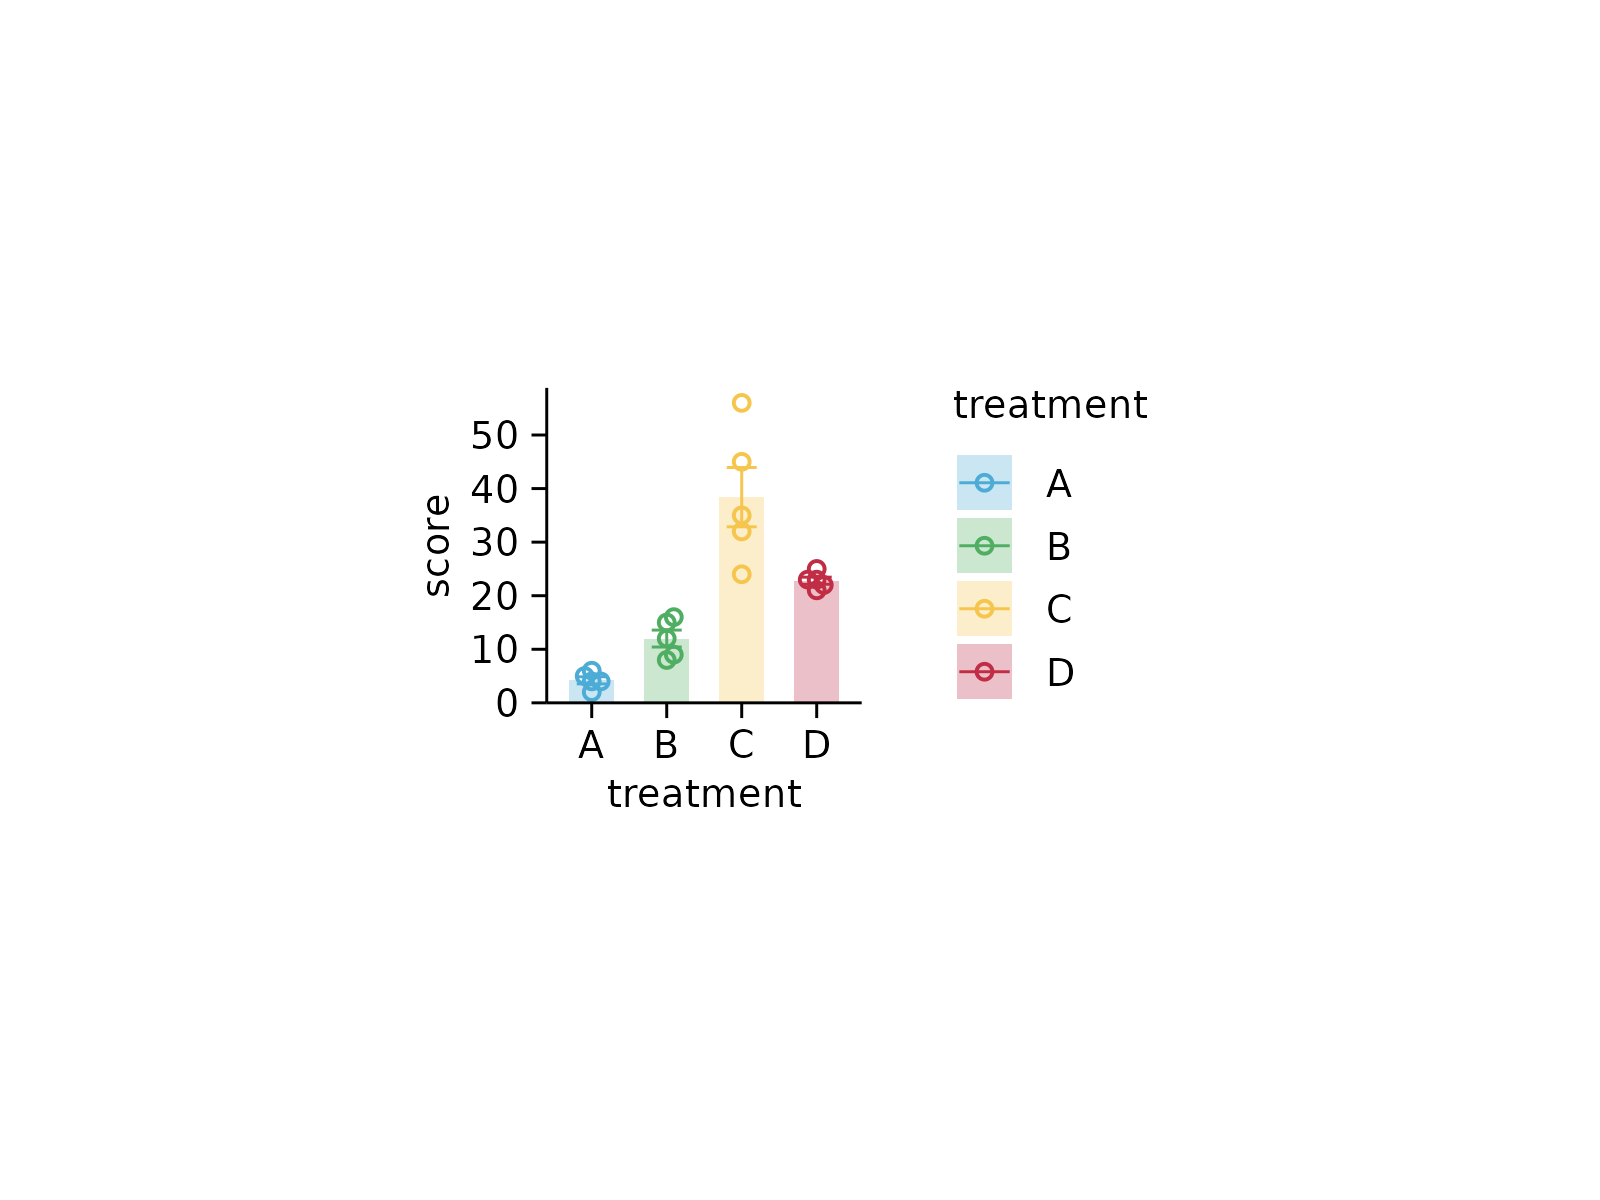 # Resize to 4 x 4 cm
study %>%
tidyplot(x = treatment, y = score, color = treatment) %>%
add_data_points_beeswarm(shape = 1) %>%
add_mean_bar(alpha = 0.3) %>%
add_sem_bar() %>%
adjust_plot_area_size(width = 4, height = 4, unit = "cm")
# Resize to 4 x 4 cm
study %>%
tidyplot(x = treatment, y = score, color = treatment) %>%
add_data_points_beeswarm(shape = 1) %>%
add_mean_bar(alpha = 0.3) %>%
add_sem_bar() %>%
adjust_plot_area_size(width = 4, height = 4, unit = "cm")
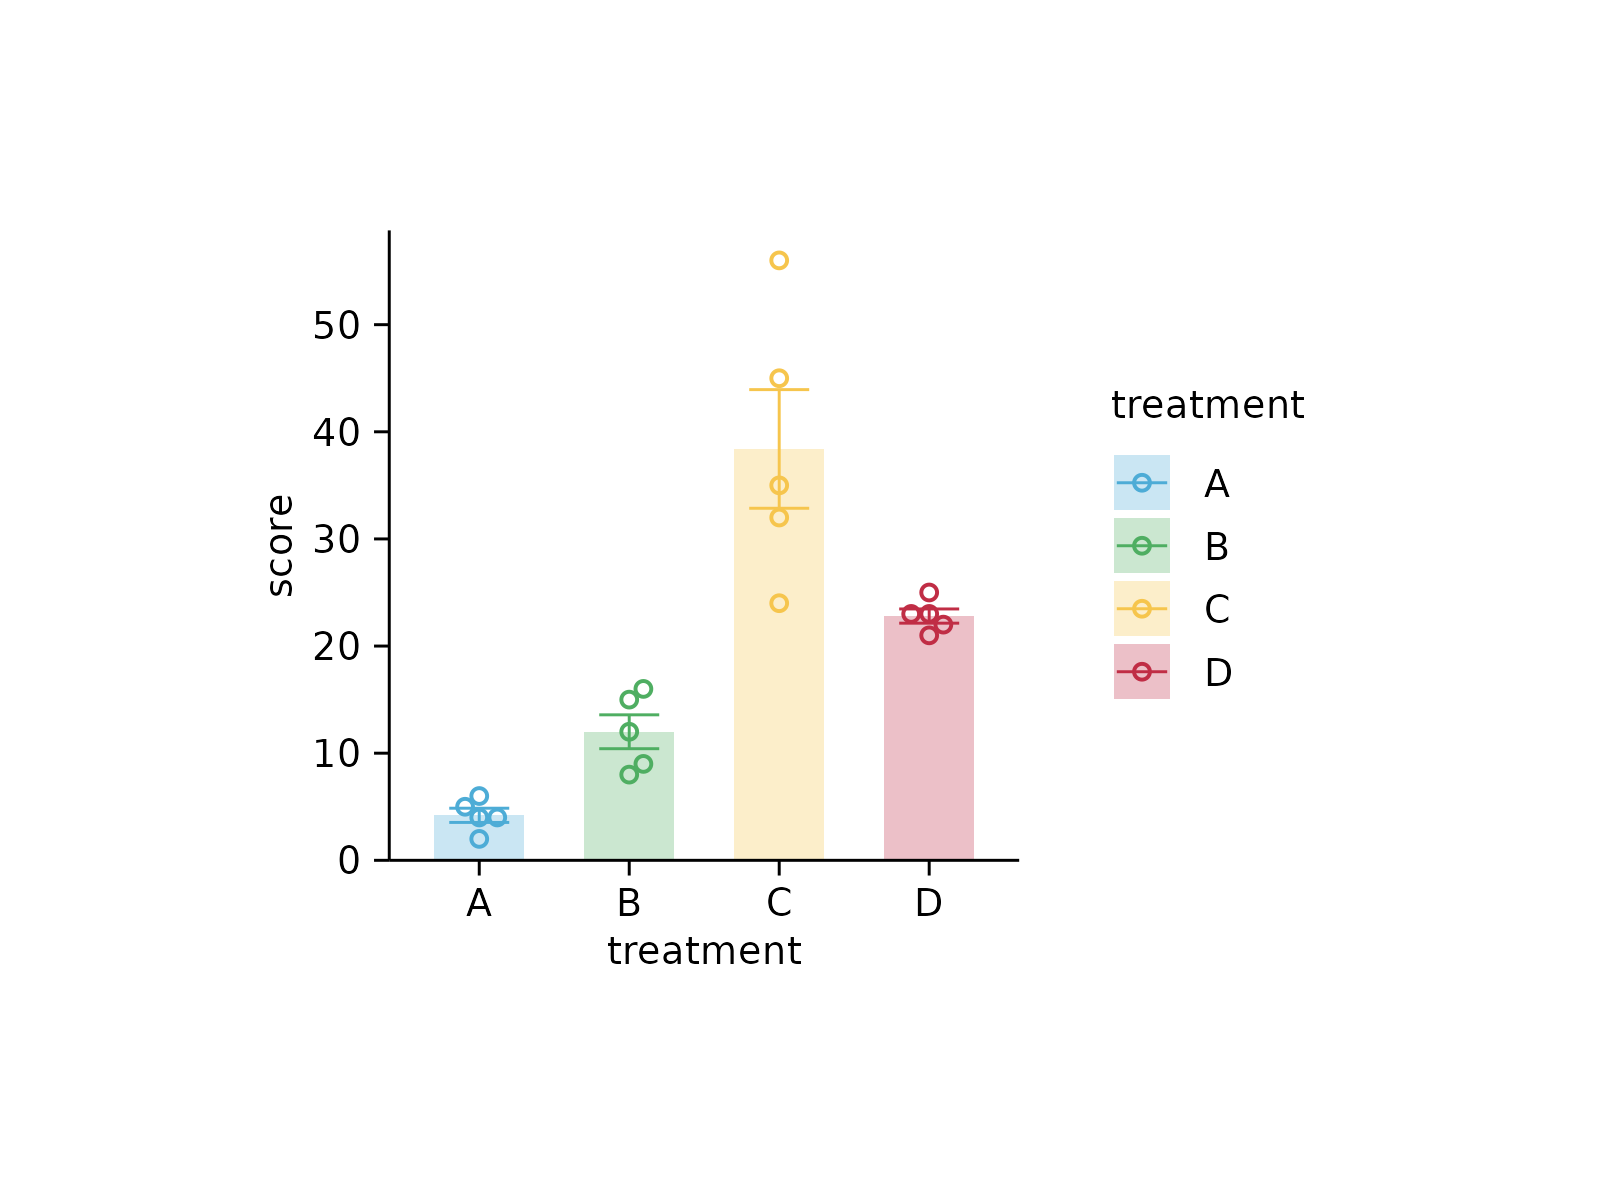 # Remove absolute dimensions and take all available space. This is the ggplot2 default.
study %>%
tidyplot(x = treatment, y = score, color = treatment) %>%
add_data_points_beeswarm(shape = 1) %>%
add_mean_bar(alpha = 0.3) %>%
add_sem_bar() %>%
adjust_plot_area_size(width = NA, height = NA)
# Remove absolute dimensions and take all available space. This is the ggplot2 default.
study %>%
tidyplot(x = treatment, y = score, color = treatment) %>%
add_data_points_beeswarm(shape = 1) %>%
add_mean_bar(alpha = 0.3) %>%
add_sem_bar() %>%
adjust_plot_area_size(width = NA, height = NA)