add_sem_bar()adds the standard error of mean.add_range_bar()adds the range from smallest to largest value.add_sd_bar()adds the standard deviation.add_ci95_bar()adds the 95% confidence interval.
Usage
add_sem_bar(
  plot,
  dodge_width = NULL,
  width = 0.4,
  linewidth = 0.25,
  preserve = "total",
  ...
)

add_range_bar(
  plot,
  dodge_width = NULL,
  width = 0.4,
  linewidth = 0.25,
  preserve = "total",
  ...
)

add_sd_bar(
  plot,
  dodge_width = NULL,
  width = 0.4,
  linewidth = 0.25,
  preserve = "total",
  ...
)

add_ci95_bar(
  plot,
  dodge_width = NULL,
  width = 0.4,
  linewidth = 0.25,
  preserve = "total",
  ...
)
Arguments
- plot
A
tidyplotgenerated with the functiontidyplot().- dodge_width
For adjusting the distance between grouped objects. Defaults to
0.8.- width
Width of the plot area. Defaults to
50.- linewidth
Thickness of the line in points (pt). Typical values range between
0.25and1.- preserve
Should dodging preserve the
"total"width of all elements at a position, or the width of a"single"element?- ...
Arguments passed on to the
geomfunction.
Examples
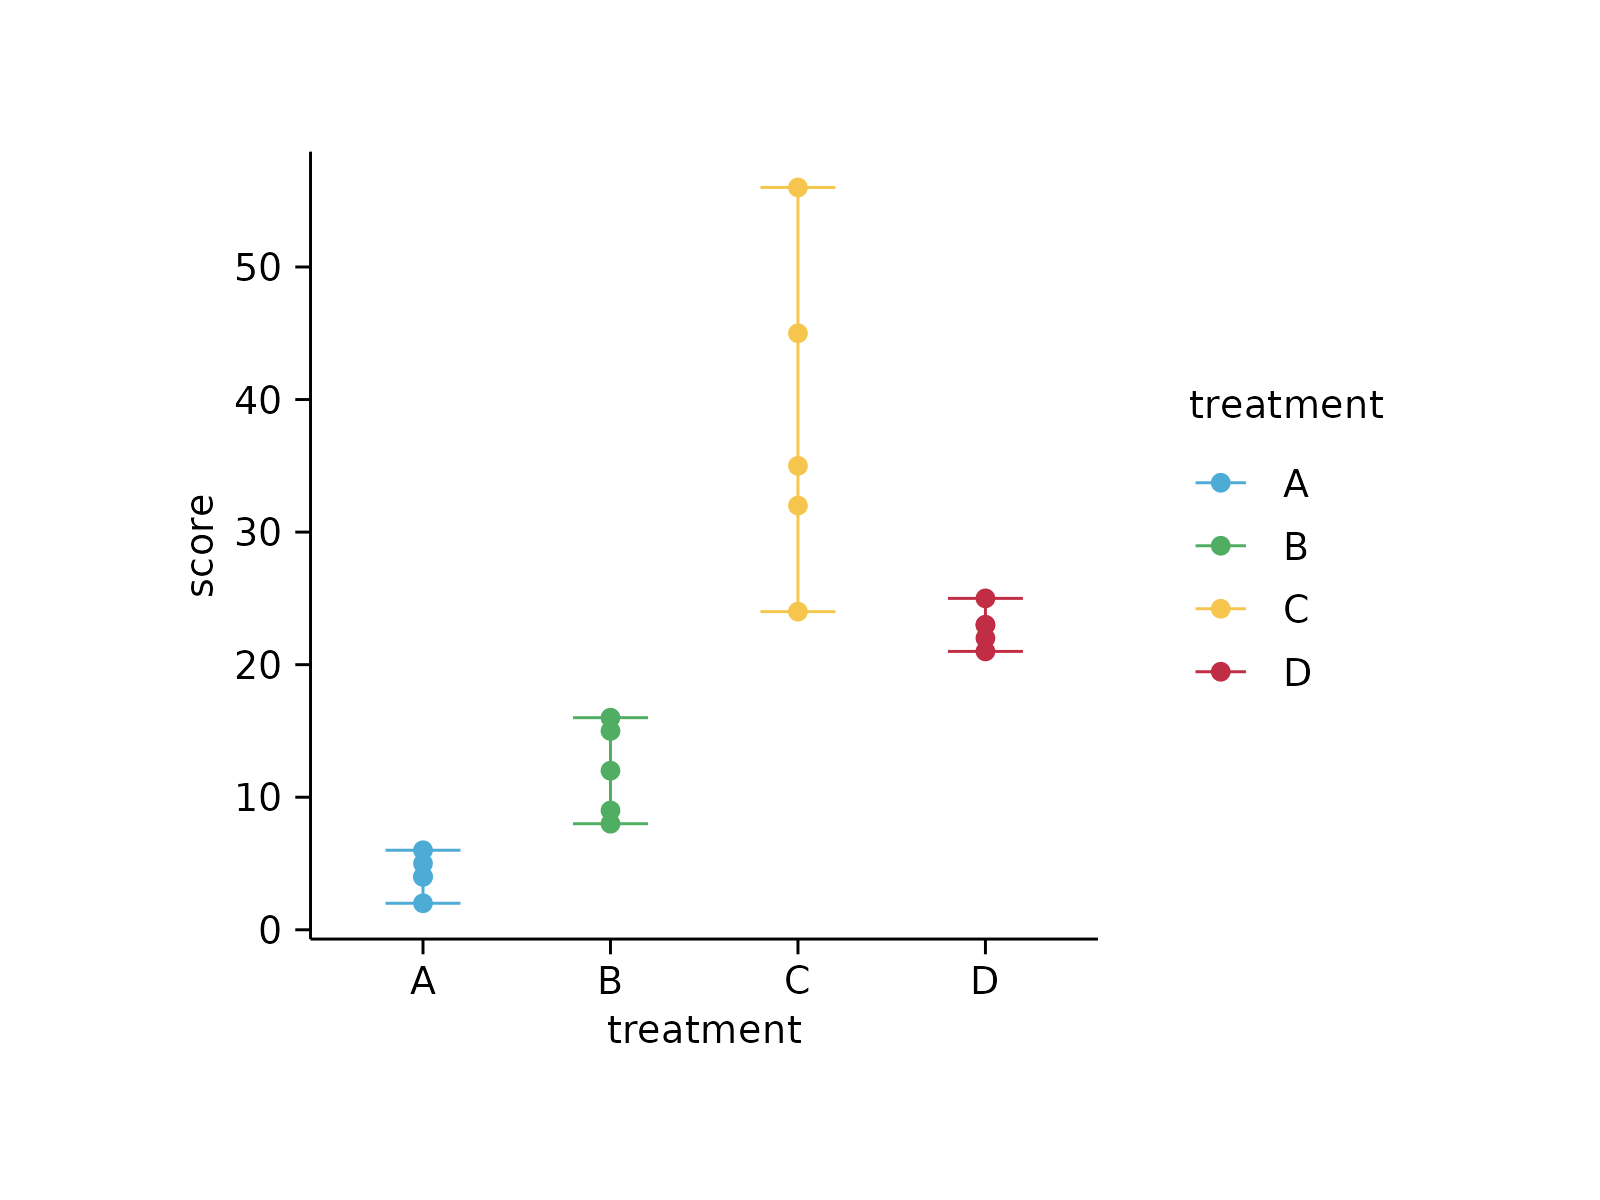
# Standard error of the mean
study %>%
tidyplot(x = treatment, y = score, color = treatment) %>%
add_data_points() %>%
add_sem_bar()
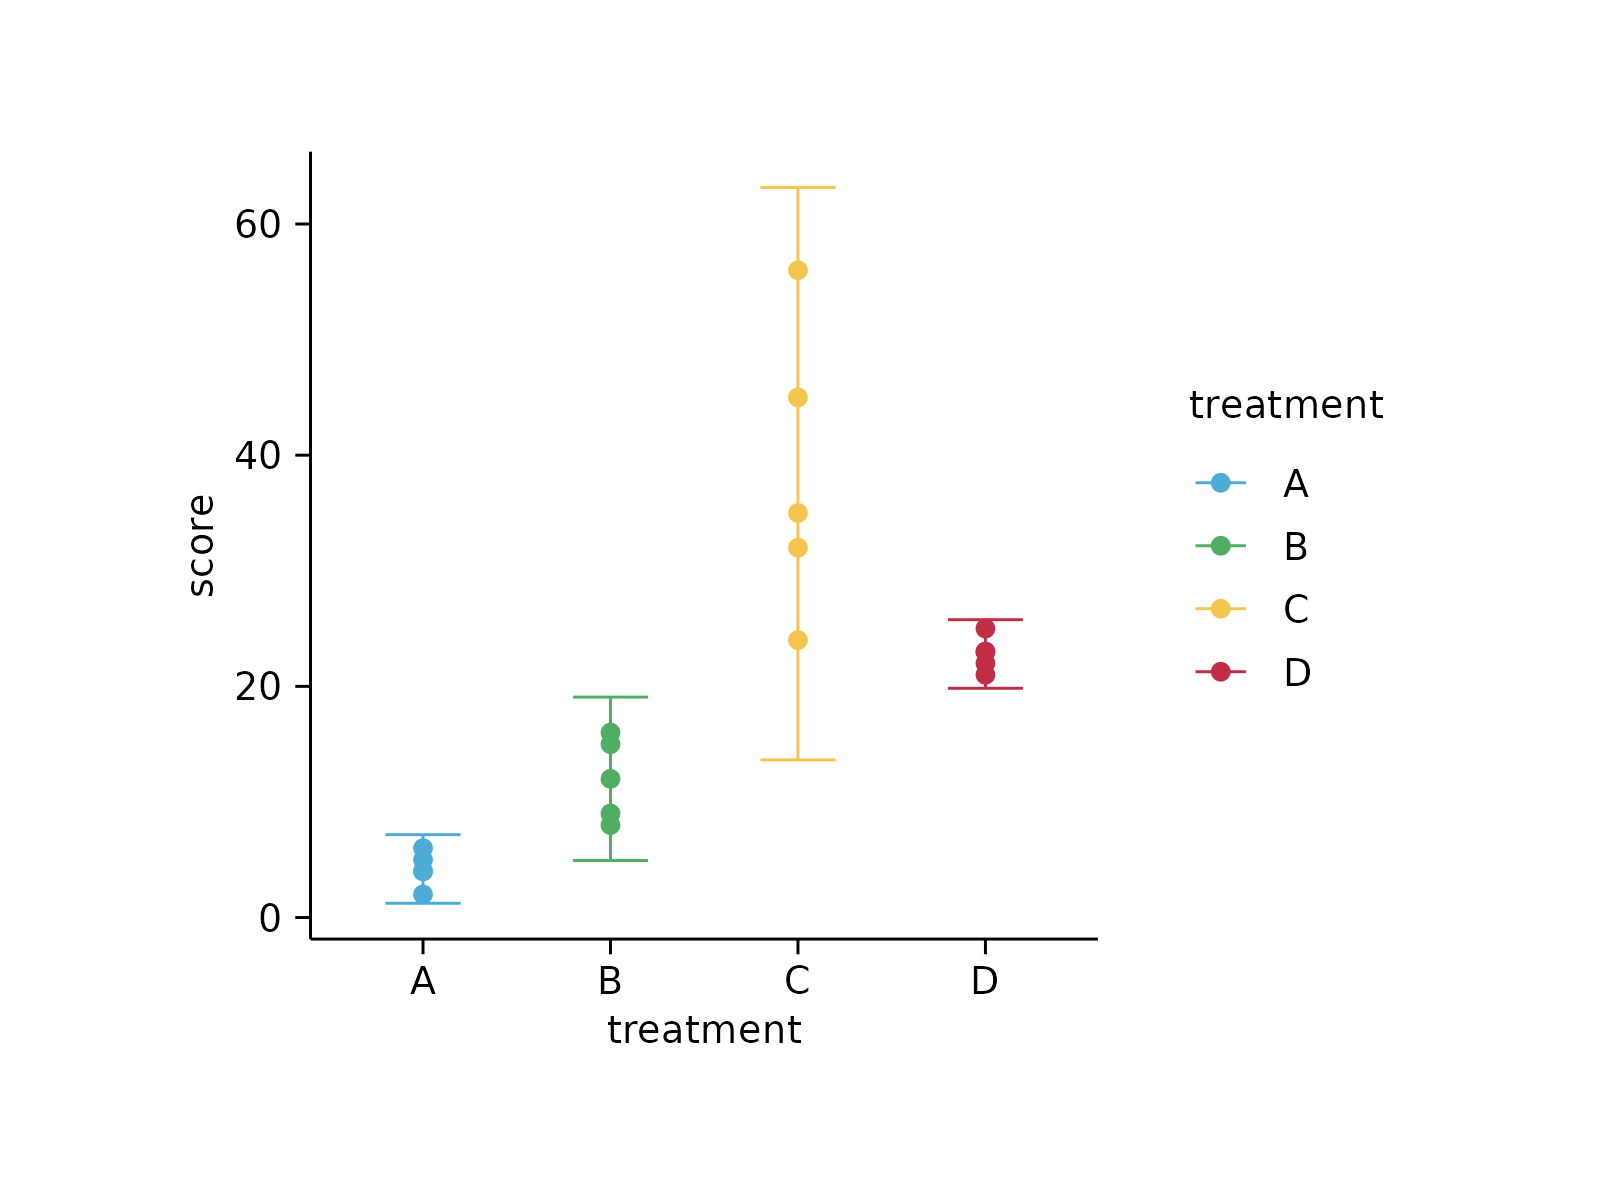
 # Range from minimum to maximum value
study %>%
tidyplot(x = treatment, y = score, color = treatment) %>%
add_data_points() %>%
add_range_bar()
# Range from minimum to maximum value
study %>%
tidyplot(x = treatment, y = score, color = treatment) %>%
add_data_points() %>%
add_range_bar()
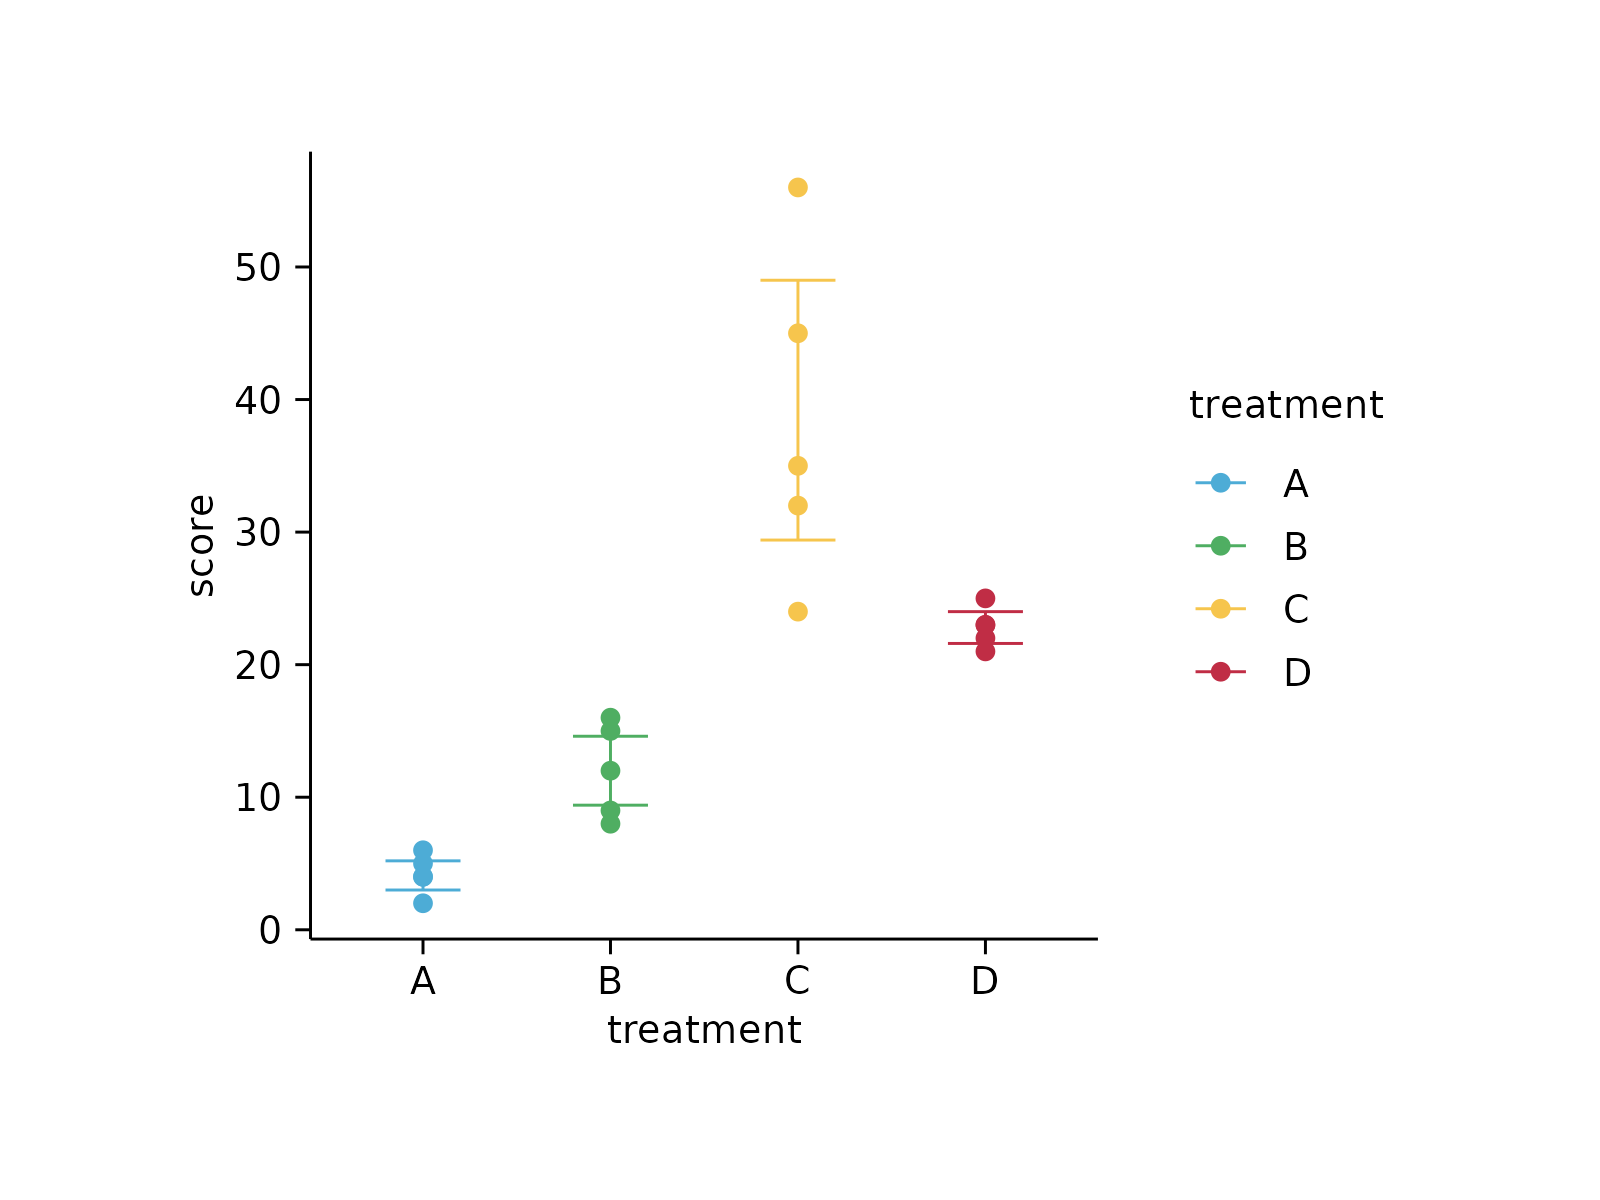
 # Standard deviation
study %>%
tidyplot(x = treatment, y = score, color = treatment) %>%
add_data_points() %>%
add_sd_bar()
# Standard deviation
study %>%
tidyplot(x = treatment, y = score, color = treatment) %>%
add_data_points() %>%
add_sd_bar()
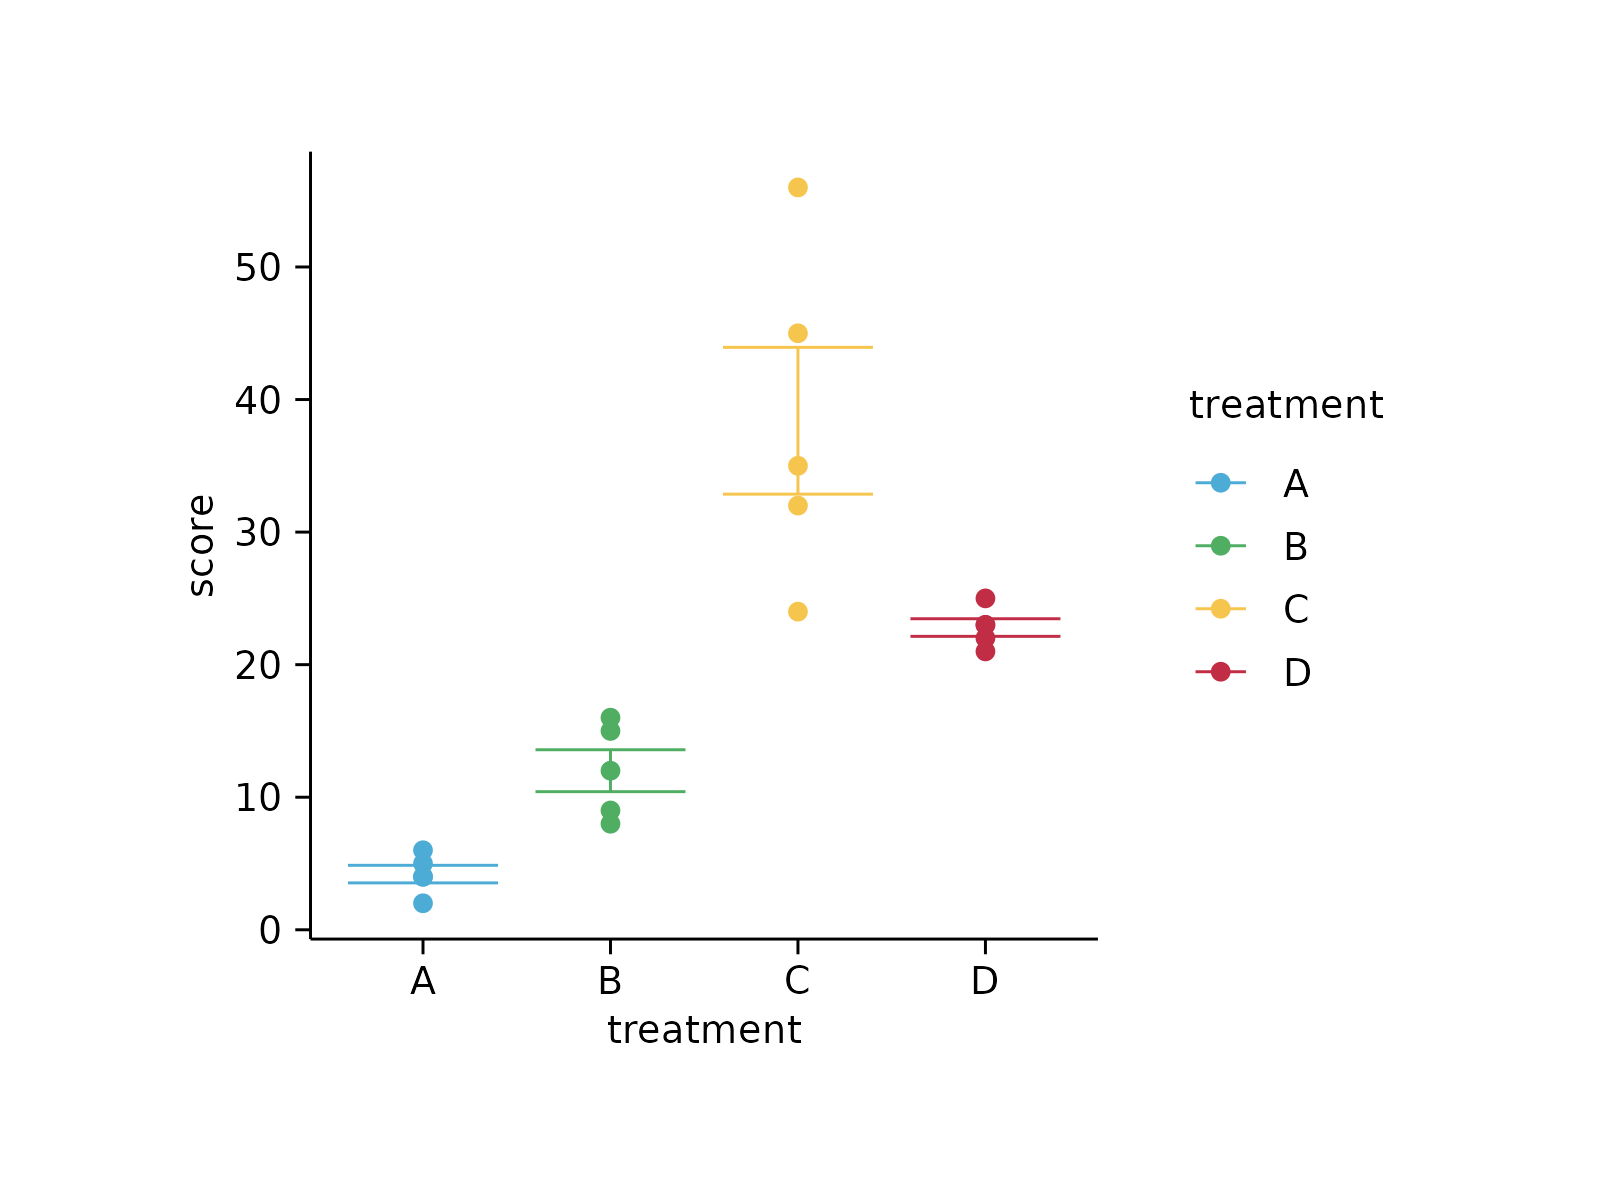
 # 95% confidence interval
study %>%
tidyplot(x = treatment, y = score, color = treatment) %>%
add_data_points() %>%
add_ci95_bar()
# 95% confidence interval
study %>%
tidyplot(x = treatment, y = score, color = treatment) %>%
add_data_points() %>%
add_ci95_bar()
 # Changing arguments: error bar width
study %>%
tidyplot(x = treatment, y = score, color = treatment) %>%
add_data_points() %>%
add_sem_bar(width = 0.8)
# Changing arguments: error bar width
study %>%
tidyplot(x = treatment, y = score, color = treatment) %>%
add_data_points() %>%
add_sem_bar(width = 0.8)
 # Changing arguments: error bar line width
study %>%
tidyplot(x = treatment, y = score, color = treatment) %>%
add_data_points() %>%
add_sem_bar(linewidth = 1)
# Changing arguments: error bar line width
study %>%
tidyplot(x = treatment, y = score, color = treatment) %>%
add_data_points() %>%
add_sem_bar(linewidth = 1)
