Add pre-computed statistics
Usage
add_test_pvalue_manual(
  plot,
  data,
  padding_top = 0.15,
  label = "{tidyplots::format_p_value(p, 0.0001)}",
  label.size = 7/ggplot2::.pt,
  y.position = "y.position",
  xmin = "group1",
  xmax = "group2",
  step.increase = 0.15,
  vjust = -0.25,
  bracket.nudge.y = 0.1,
  bracket.size = 0.3,
  tip.length = 0.03,
  hide.ns = FALSE,
  remove.bracket = FALSE,
  color = plot$tidyplot$ink,
  ...
)

add_test_asterisks_manual(
  plot,
  data,
  padding_top = 0.1,
  label = "p.signif",
  label.size = 10/ggplot2::.pt,
  y.position = "y.position",
  xmin = "group1",
  xmax = "group2",
  step.increase = 0.2,
  vjust = 0.3,
  bracket.nudge.y = 0.15,
  bracket.size = 0.3,
  tip.length = 0.03,
  hide.ns = TRUE,
  remove.bracket = FALSE,
  color = plot$tidyplot$ink,
  ...
)
Arguments
- plot
A
tidyplotgenerated with the functiontidyplot().- data
a data frame containing statitistical test results. The expected default format should contain the following columns:
group1 | group2 | p | y.position | etc.group1andgroup2are the groups that have been compared.pis the resulting p-value.y.positionis the y coordinates of the p-values in the plot.- padding_top
Extra padding above the data points to accommodate the statistical comparisons.
- label
the column containing the label (e.g.: label = "p" or label = "p.adj"), where
pis the p-value. Can be also an expression that can be formatted by theglue()package. For example, when specifying label = "t-test, p = {p}", the expression {p} will be replaced by its value.- label.size
Font size of label text.
- y.position
column containing the coordinates (in data units) to be used for absolute positioning of the label. Default value is "y.position". Can be also a numeric vector.
- xmin
column containing the position of the left sides of the brackets. Default value is "group1".
- xmax
(optional) column containing the position of the right sides of the brackets. Default value is "group2". If NULL, the p-values are plotted as a simple text.
- step.increase
numeric vector with the increase in fraction of total height for every additional comparison to minimize overlap.
- vjust
move the text up or down relative to the bracket. Can be also a column name available in the data.
- bracket.nudge.y
Vertical adjustment to nudge brackets by. Useful to move up or move down the bracket. If positive value, brackets will be moved up; if negative value, brackets are moved down.
- bracket.size
Width of the lines of the bracket.
- tip.length
numeric vector with the fraction of total height that the bar goes down to indicate the precise column. Default is 0.03.
- hide.ns
can be logical value or a character vector.
Case when logical value. If TRUE, hide ns symbol when displaying significance levels. Filter is done by checking the column
p.adj.signif,p.signif,p.adjandp.Case when character value. Possible values are "p" or "p.adj", for filtering out non significant.
- remove.bracket
logical, if
TRUE, brackets are removed from the plot. Considered only in the situation, where comparisons are performed against reference group or against "all".- color
text and line color. Can be variable name in the data for coloring by groups.
- ...
Arguments passed on to
ggpubr::stat_pvalue_manual().
Details
add_test_pvalue_manual()andadd_test_asterisks_manual()useggpubr::stat_pvalue_manual(). Check there for additional arguments. These functions take pre-computed statistics as input via thedataparameter.Known limitation:
add_test_pvalue_manual()andadd_test_asterisks_manual()expect a discrete variable on the x-axis and a continuous variable on the y-axis. To produce horizontal plots, useflip_plot().
Examples
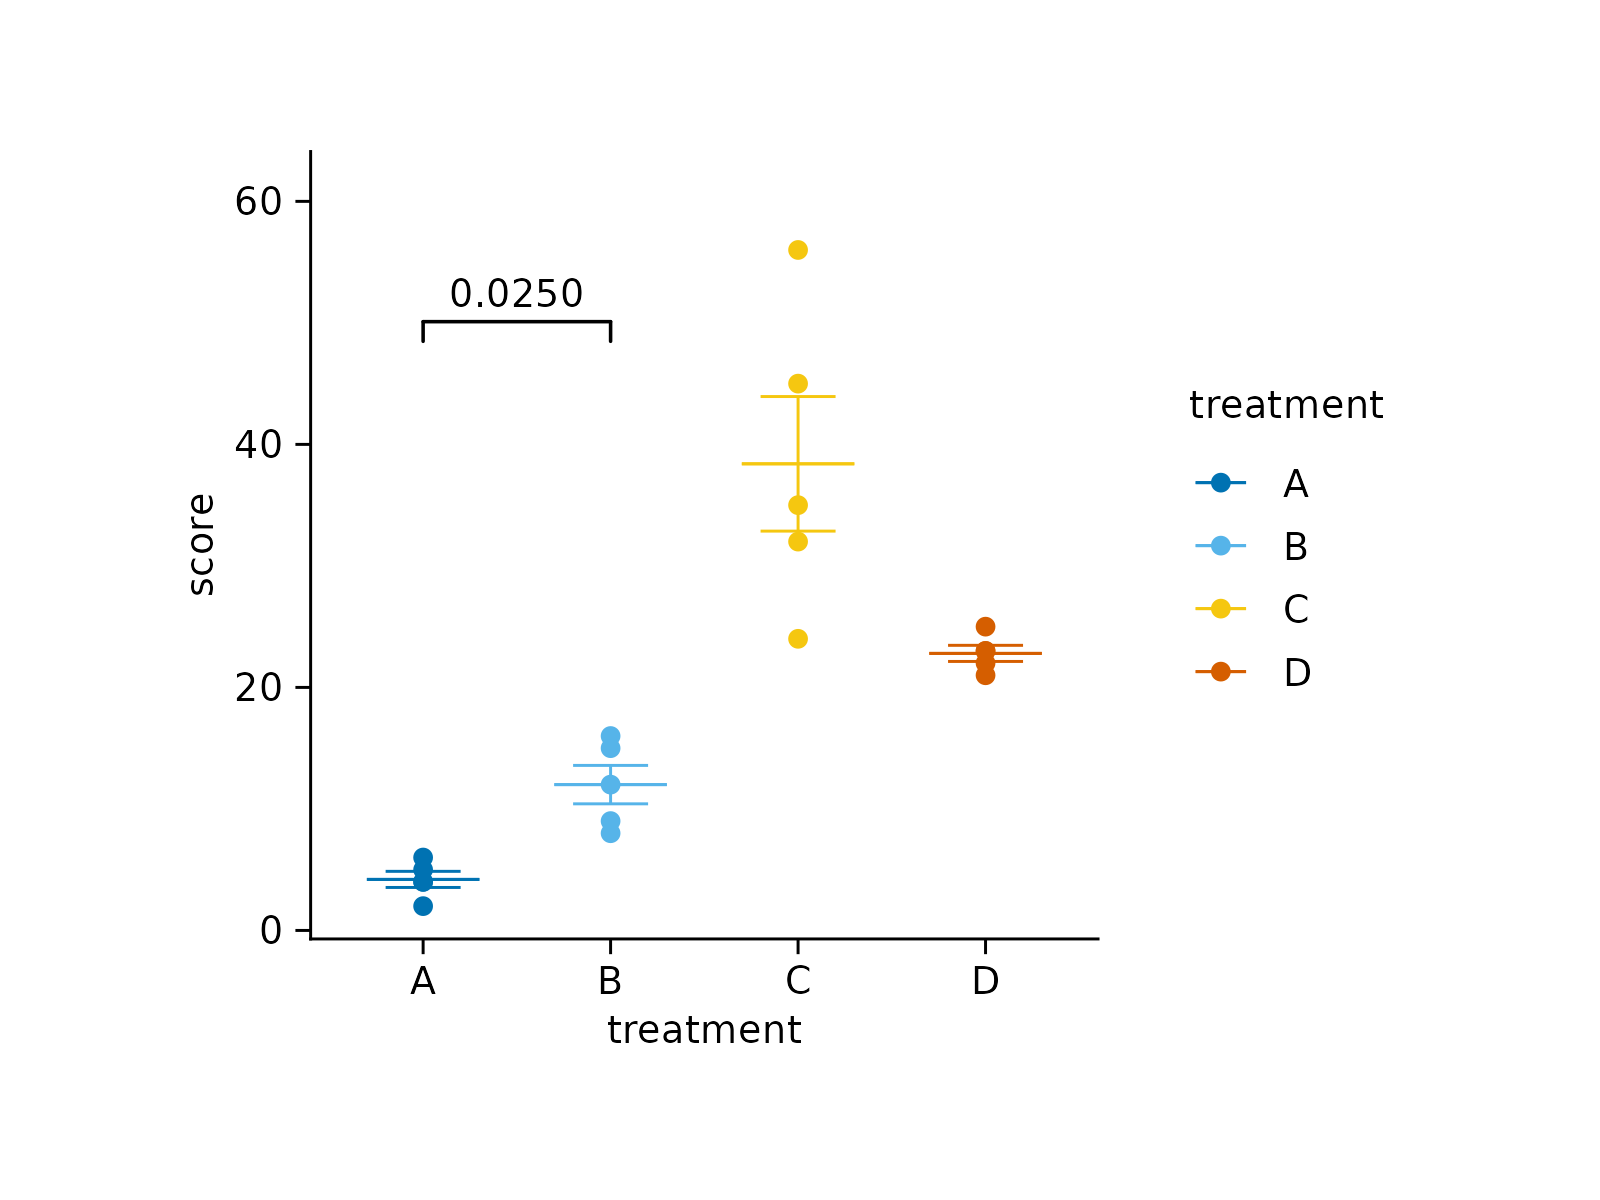
# Add manual p-values from pre-computed statistics
stat_df <- data.frame(
group1 = "A", group2 = "B",
p = 0.025, p.signif = "*",
y.position = 50
)
study |>
tidyplot(x = treatment, y = score, color = treatment) |>
add_mean_dash() |>
add_sem_errorbar() |>
add_data_points() |>
add_test_pvalue_manual(data = stat_df)
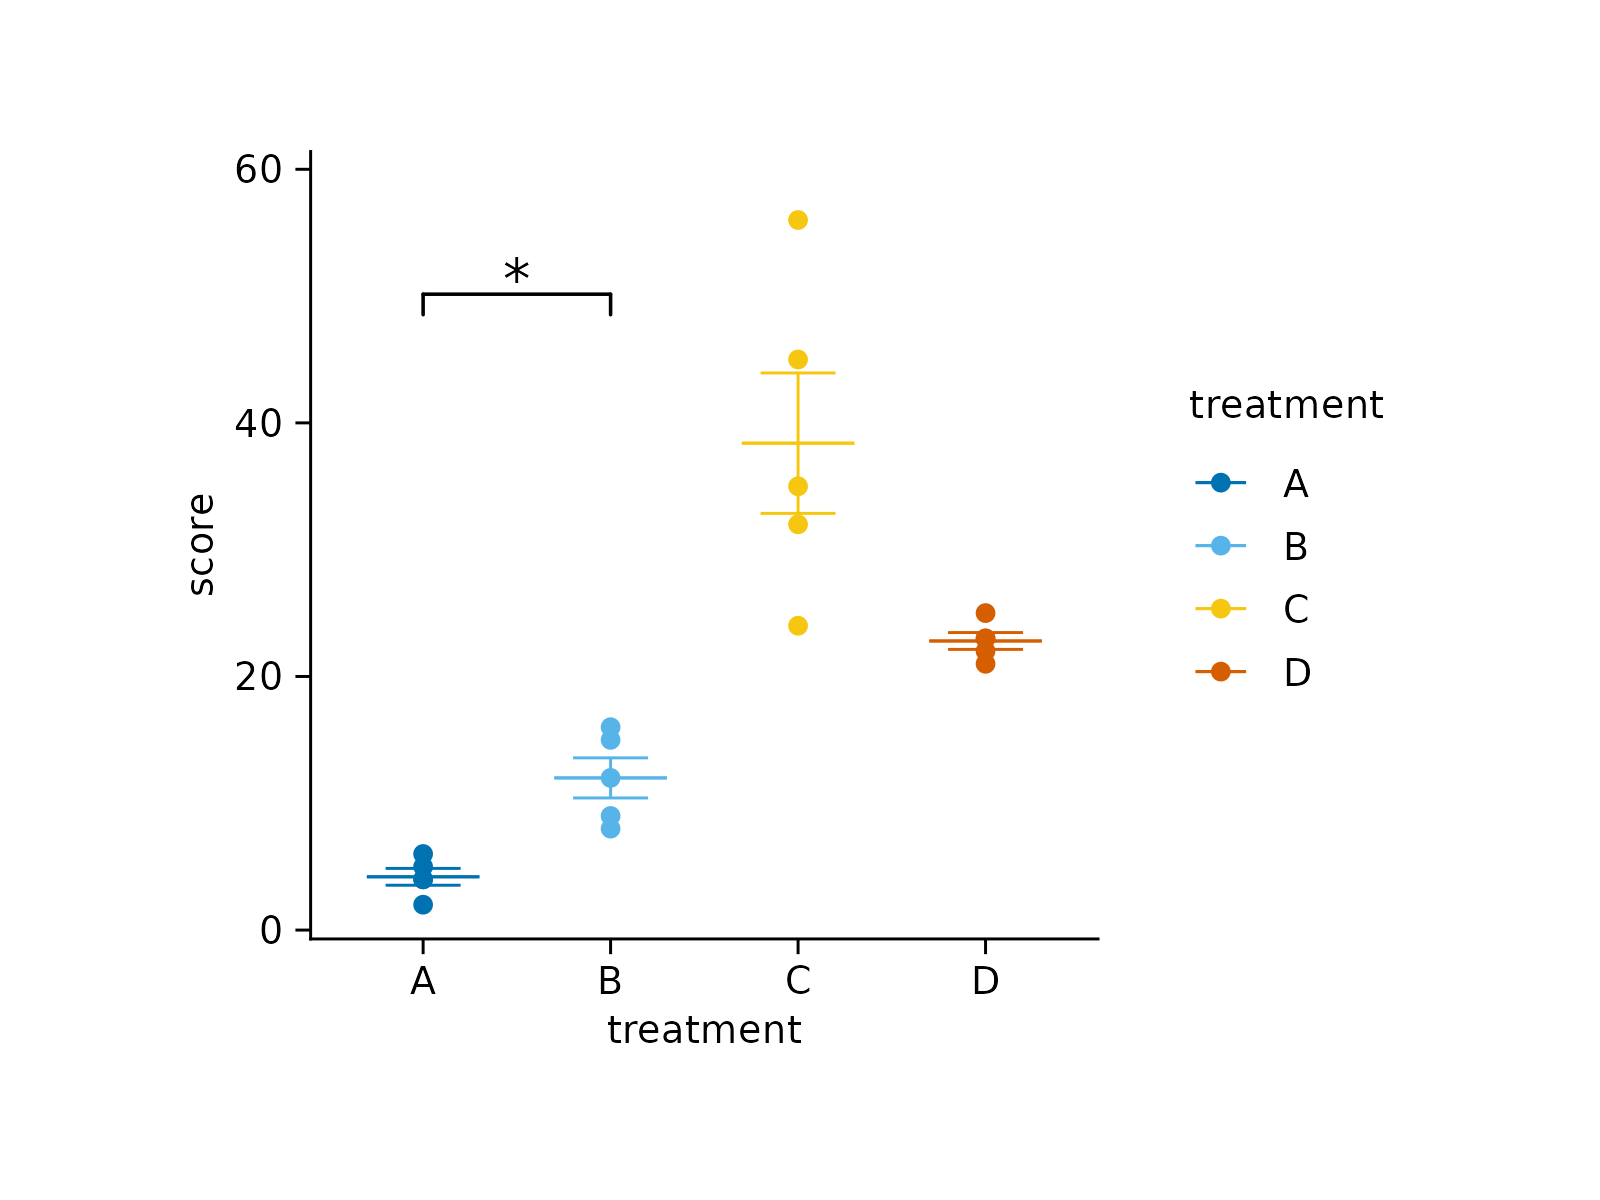
 # Add manual asterisks
study |>
tidyplot(x = treatment, y = score, color = treatment) |>
add_mean_dash() |>
add_sem_errorbar() |>
add_data_points() |>
add_test_asterisks_manual(data = stat_df)
# Add manual asterisks
study |>
tidyplot(x = treatment, y = score, color = treatment) |>
add_mean_dash() |>
add_sem_errorbar() |>
add_data_points() |>
add_test_asterisks_manual(data = stat_df)