Themes
Usage
theme_tidyplot(plot, fontsize = 7)

theme_ggplot2(plot, fontsize = 7)

theme_minimal_xy(plot, fontsize = 7)

theme_minimal_x(plot, fontsize = 7)

theme_minimal_y(plot, fontsize = 7)
Arguments
- plot
A
tidyplotgenerated with the functiontidyplot().- fontsize
Font size in points. Defaults to
7.
Examples
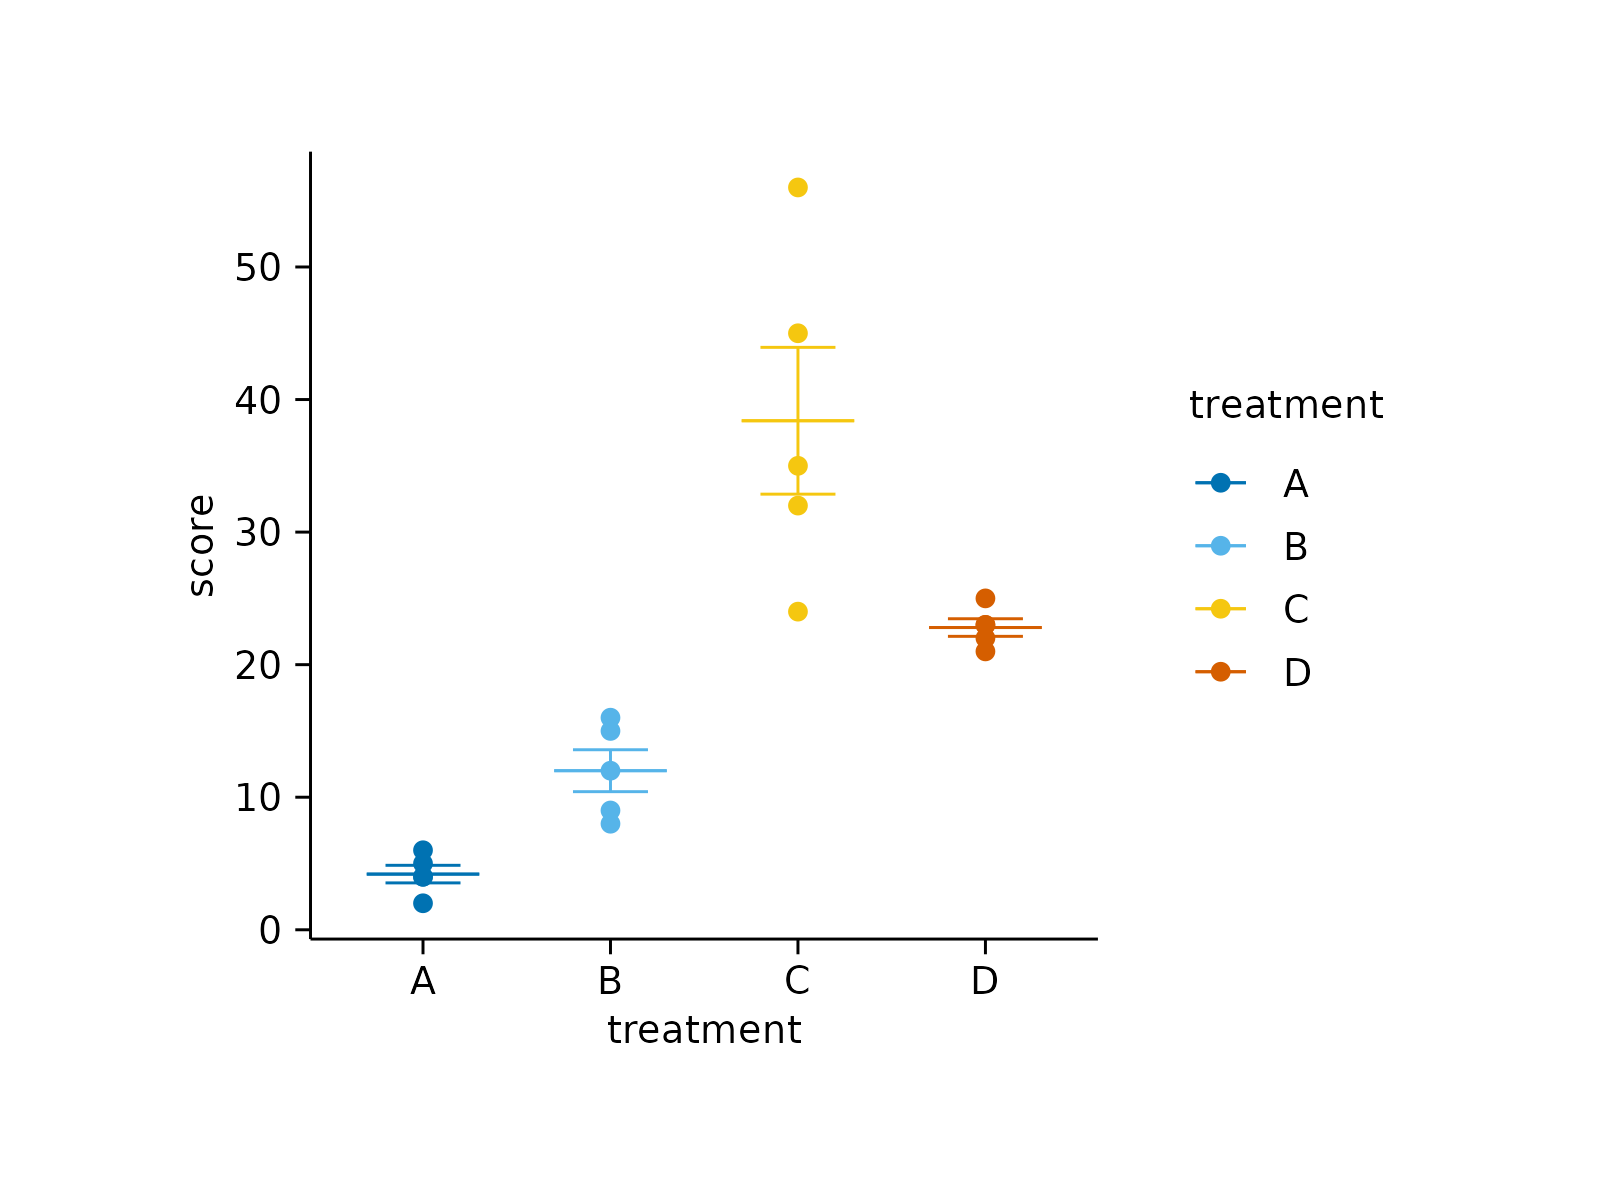
study |>
tidyplot(x = treatment, y = score, color = treatment) |>
add_data_points() |>
add_sem_errorbar() |>
add_mean_dash() |>
theme_tidyplot()
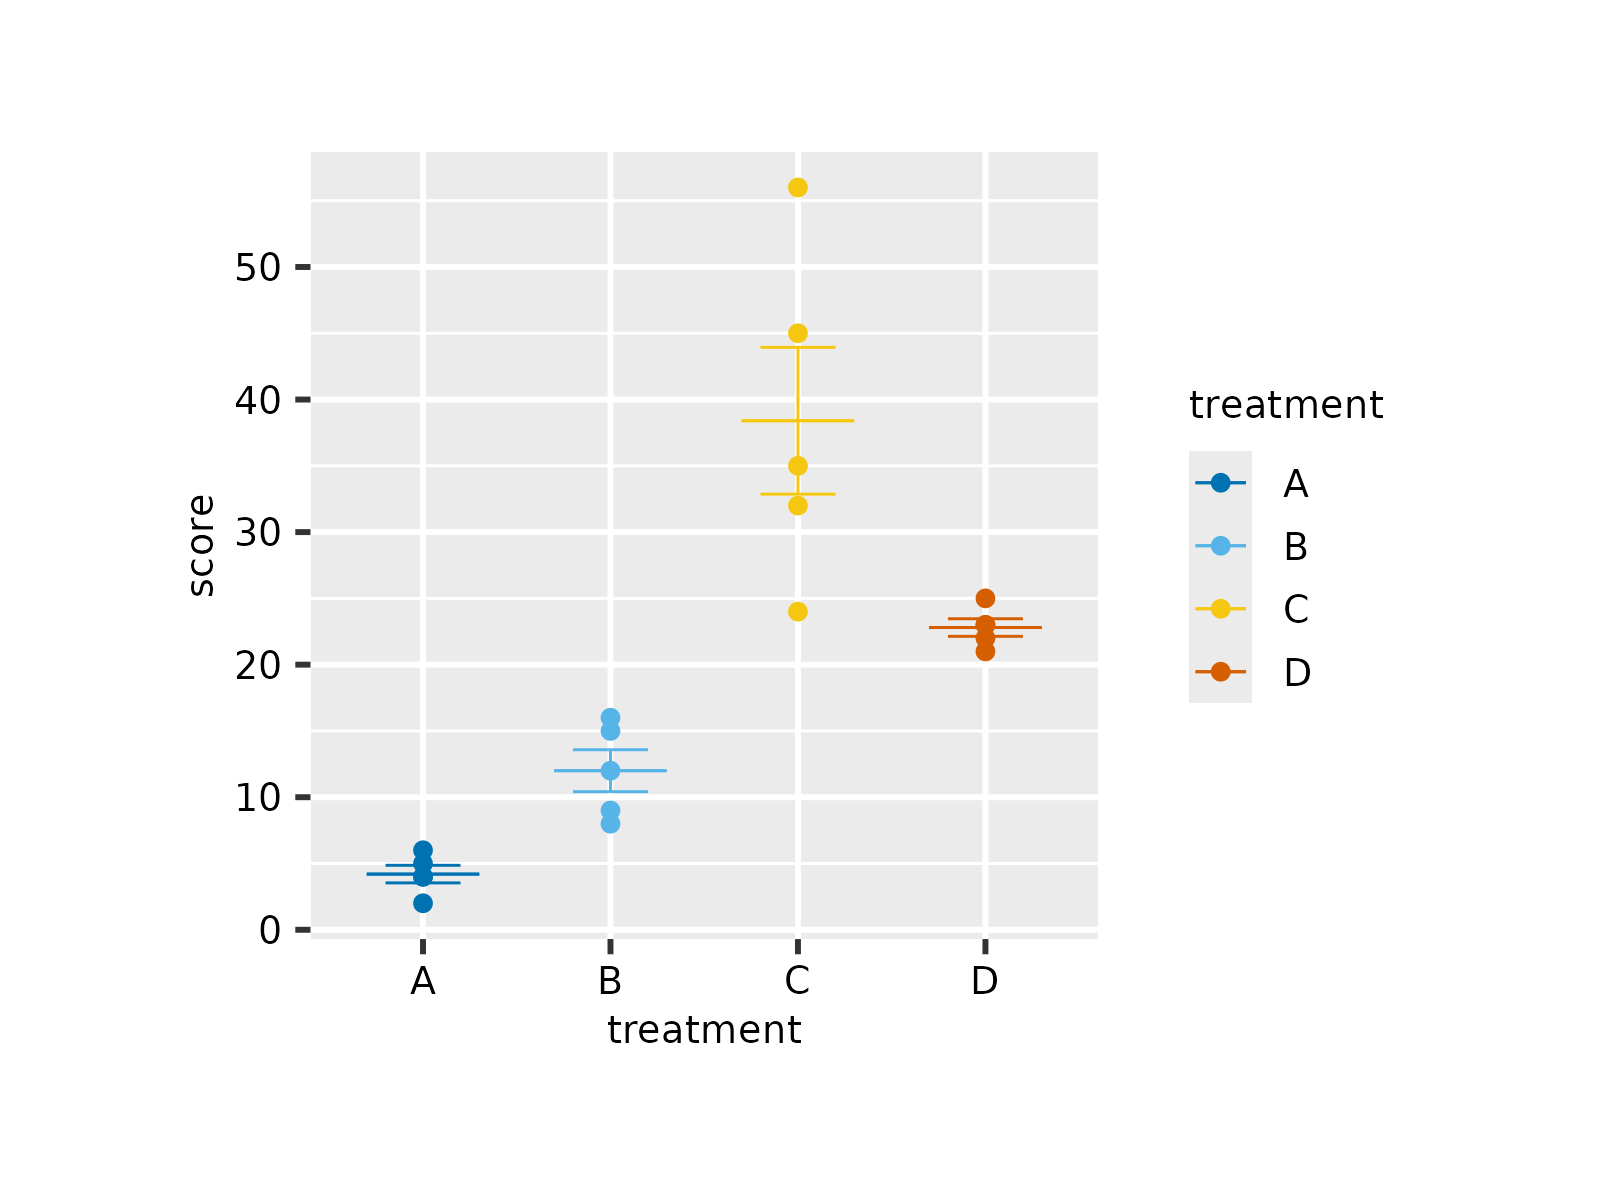
 study |>
tidyplot(x = treatment, y = score, color = treatment) |>
add_data_points() |>
add_sem_errorbar() |>
add_mean_dash() |>
theme_ggplot2()
study |>
tidyplot(x = treatment, y = score, color = treatment) |>
add_data_points() |>
add_sem_errorbar() |>
add_mean_dash() |>
theme_ggplot2()
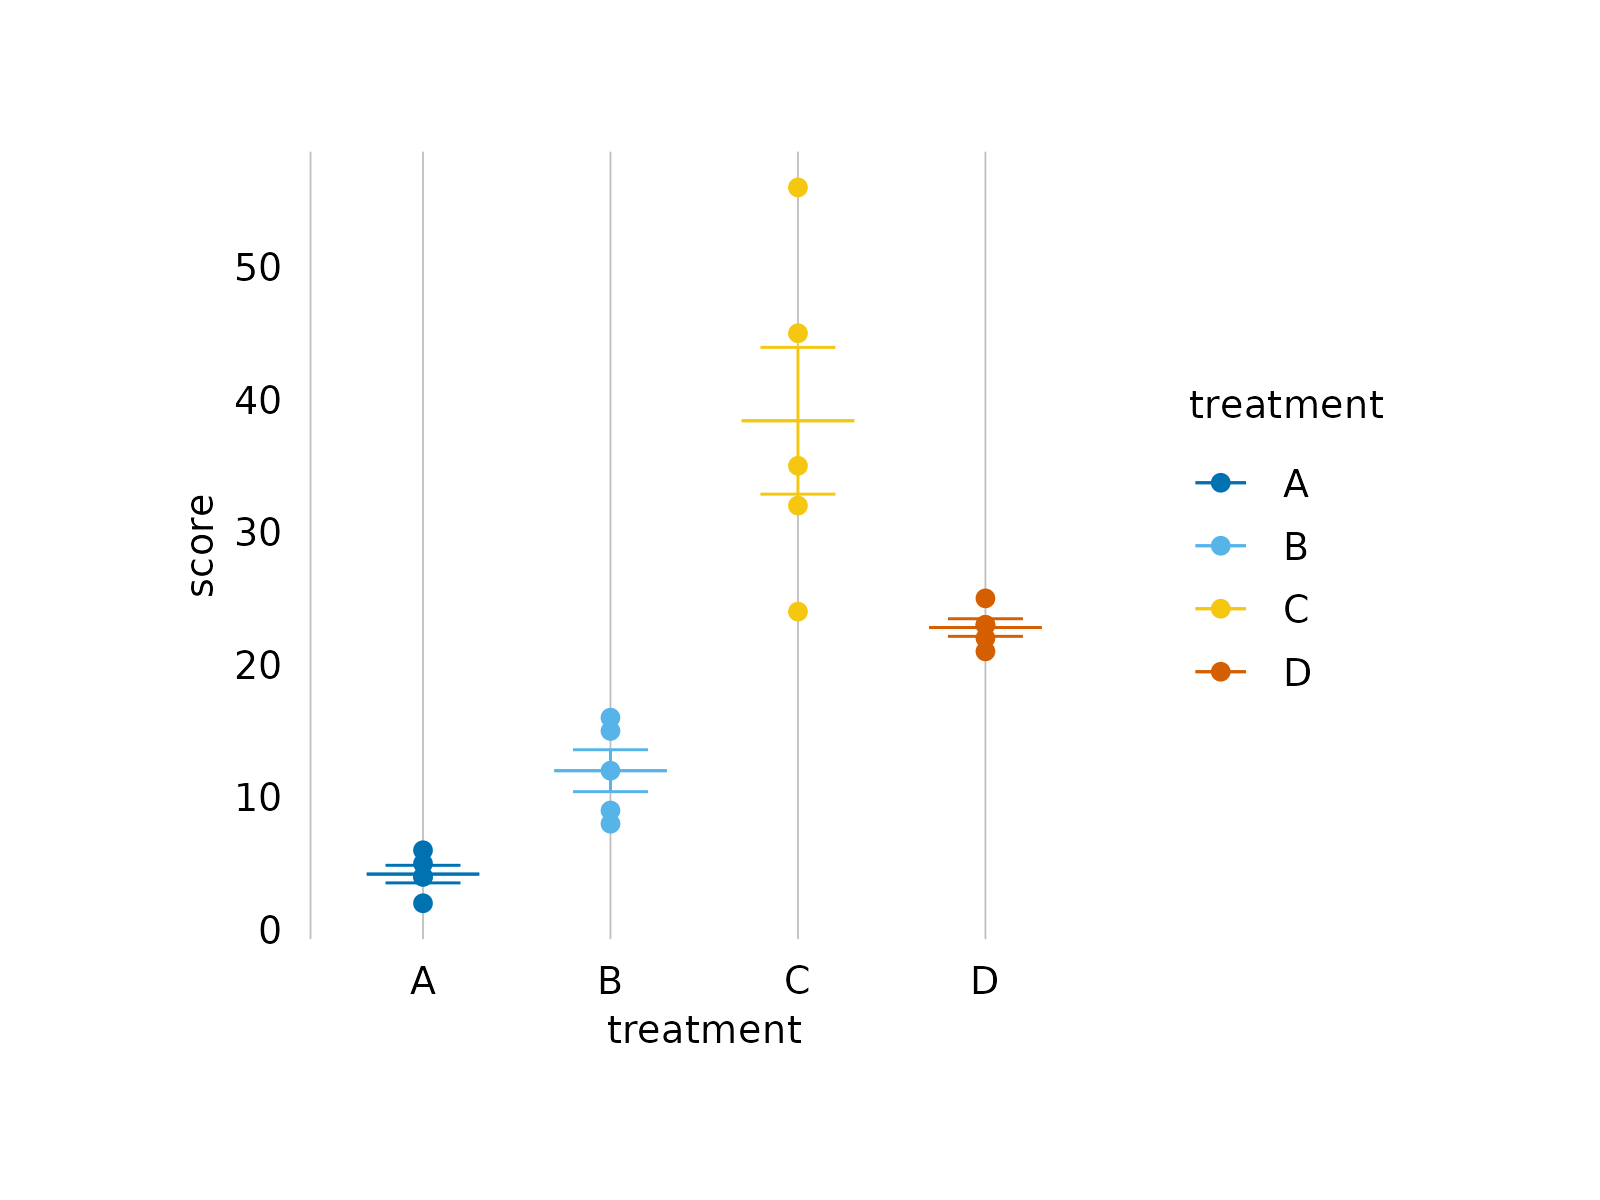
 study |>
tidyplot(x = treatment, y = score, color = treatment) |>
add_data_points() |>
add_sem_errorbar() |>
add_mean_dash() |>
theme_minimal_xy()
study |>
tidyplot(x = treatment, y = score, color = treatment) |>
add_data_points() |>
add_sem_errorbar() |>
add_mean_dash() |>
theme_minimal_xy()
 study |>
tidyplot(x = treatment, y = score, color = treatment) |>
add_data_points() |>
add_sem_errorbar() |>
add_mean_dash() |>
theme_minimal_x()
study |>
tidyplot(x = treatment, y = score, color = treatment) |>
add_data_points() |>
add_sem_errorbar() |>
add_mean_dash() |>
theme_minimal_x()
 study |>
tidyplot(x = treatment, y = score, color = treatment) |>
add_data_points() |>
add_sem_errorbar() |>
add_mean_dash() |>
theme_minimal_y()
study |>
tidyplot(x = treatment, y = score, color = treatment) |>
add_data_points() |>
add_sem_errorbar() |>
add_mean_dash() |>
theme_minimal_y()
