Add pie or donut chart
Usage
add_pie(plot, width = 1, reverse = FALSE, ...)

add_donut(plot, width = 1, reverse = FALSE, ...)
Arguments
- plot
A
tidyplotgenerated with the functiontidyplot().- width
Width of the donut ring.
- reverse
Whether the order should be reversed or not. Defaults to
FALSE, meaning not reversed.- ...
Arguments passed on to the
geomfunction.
Examples
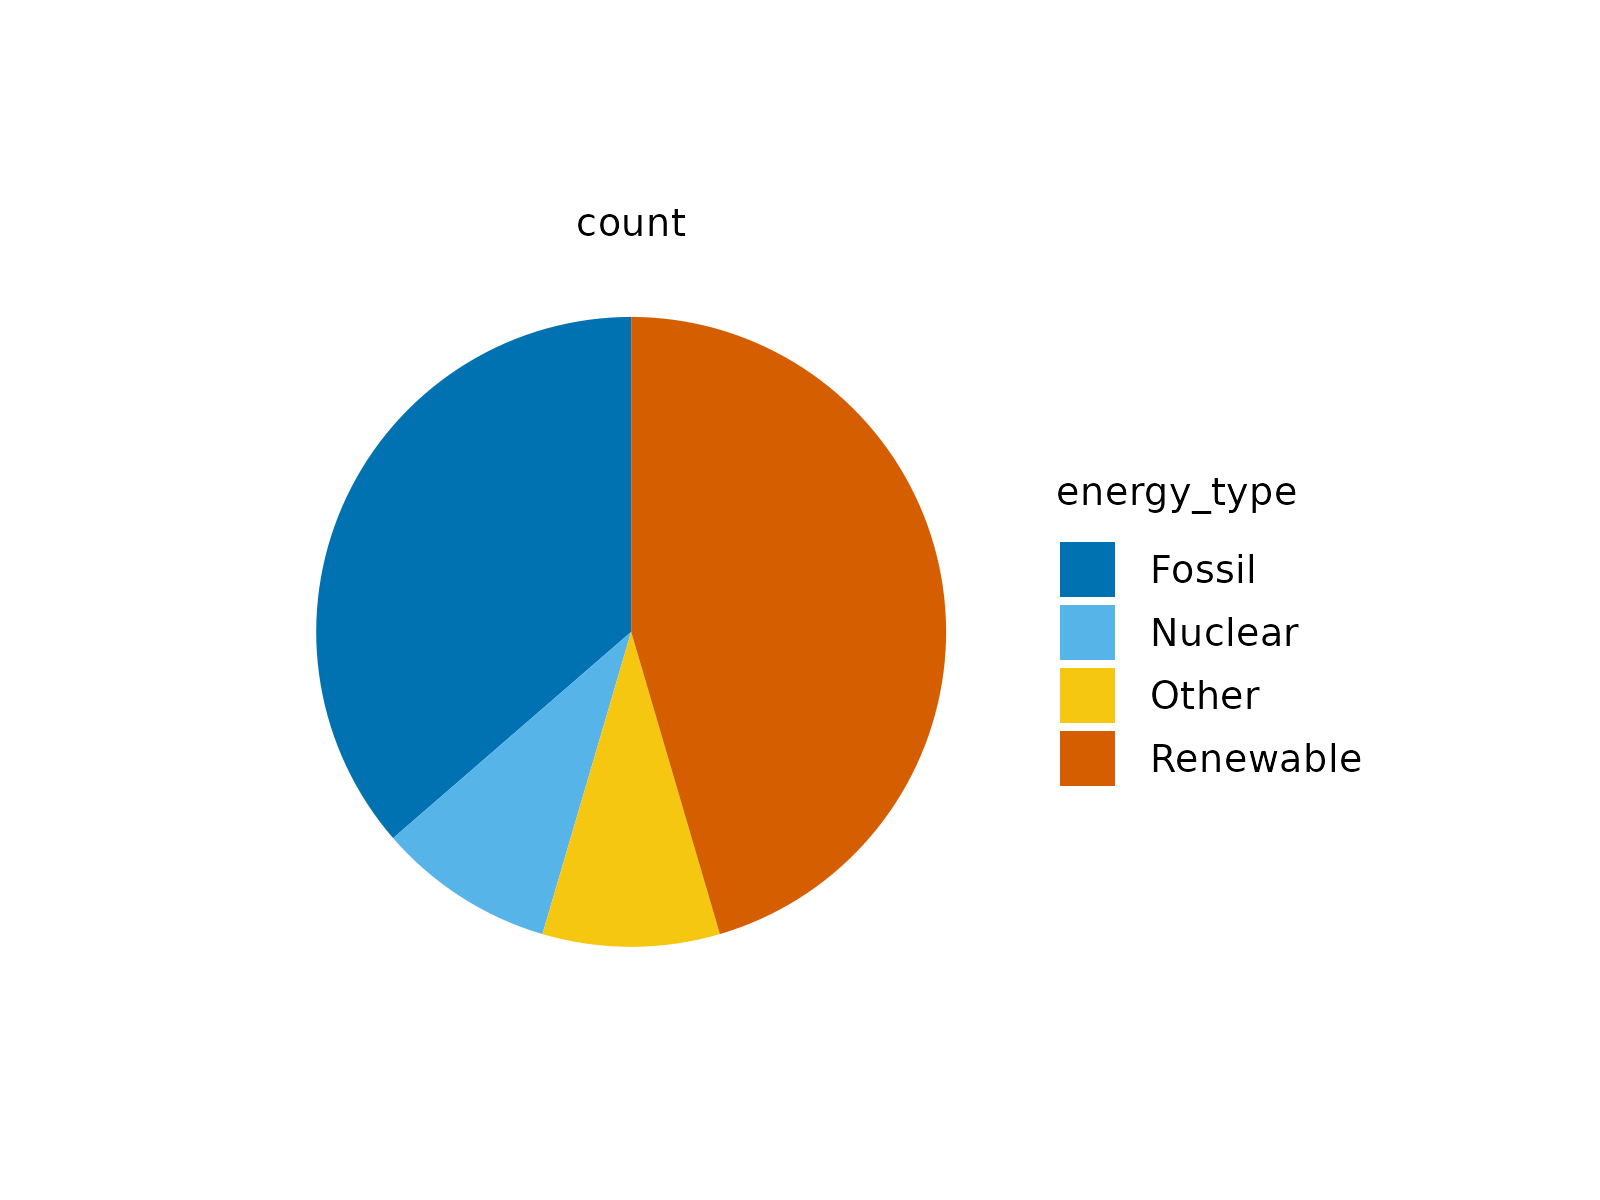
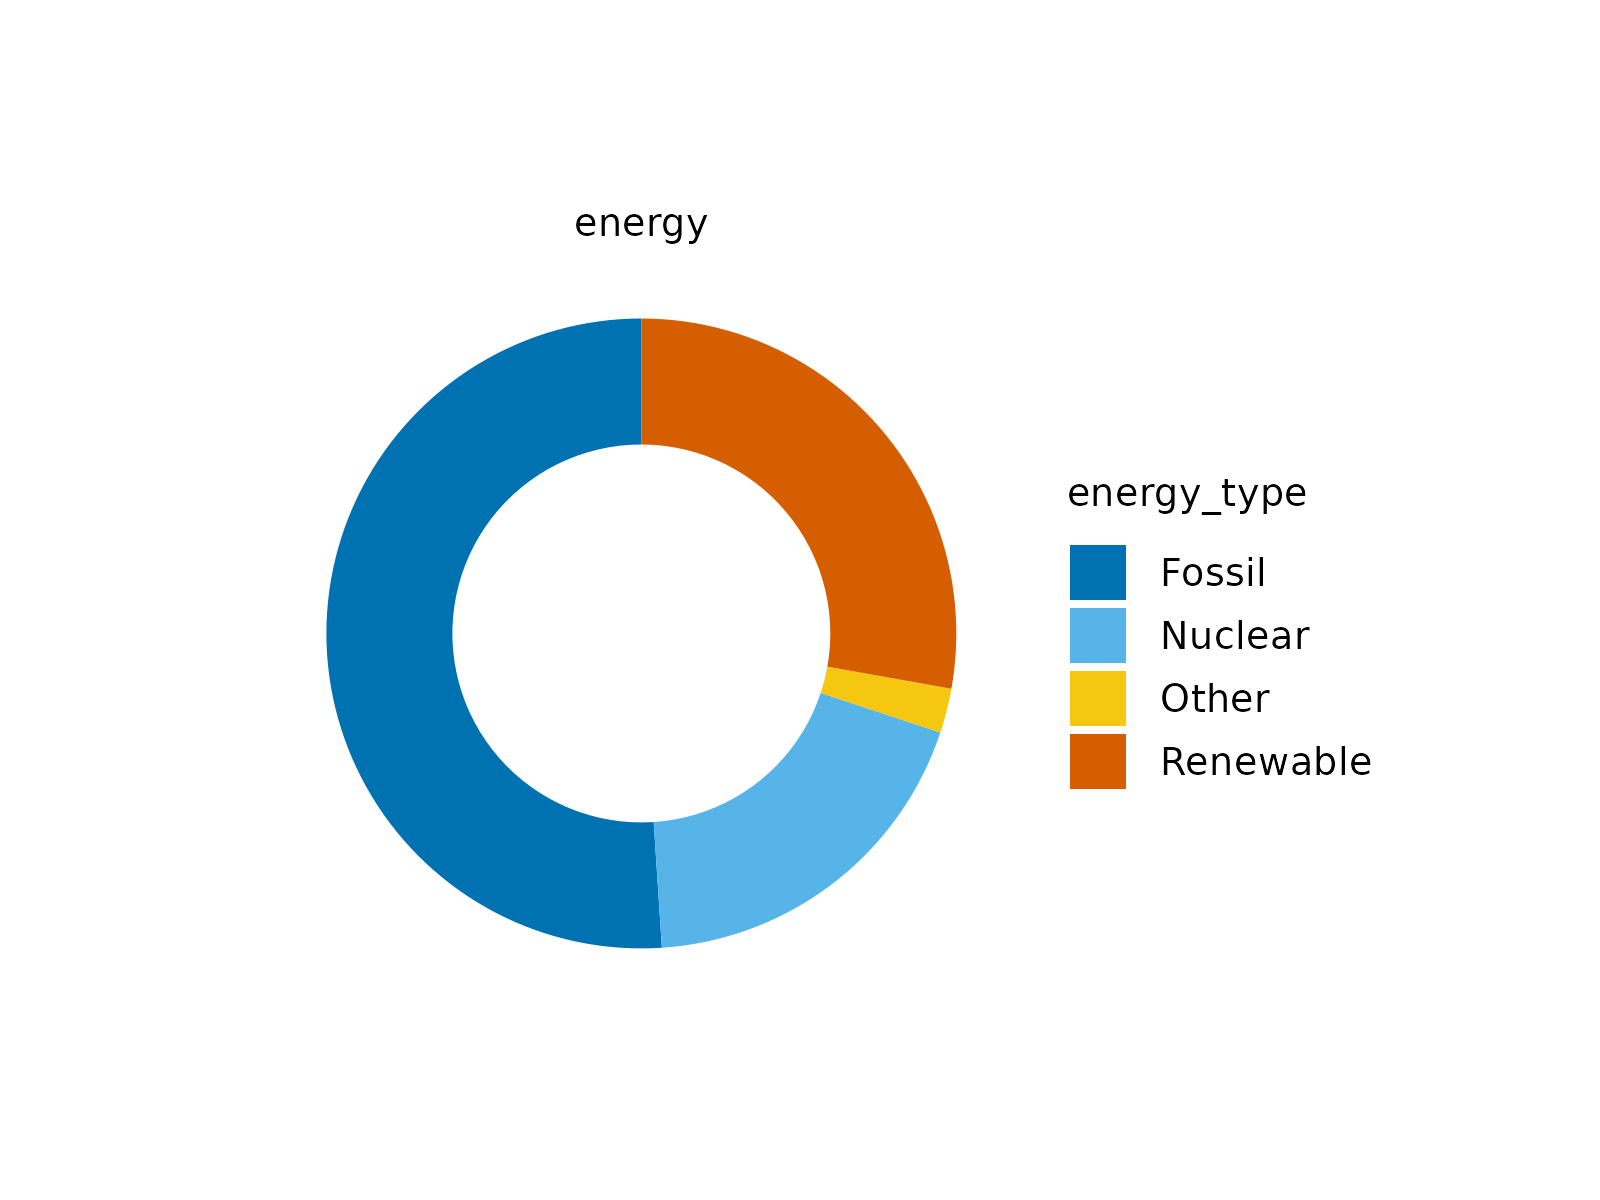
# for a `count` only provide `color`
# `count` of the data points in each `energy_type` category
energy |>
tidyplot(color = energy_type) |>
add_pie()
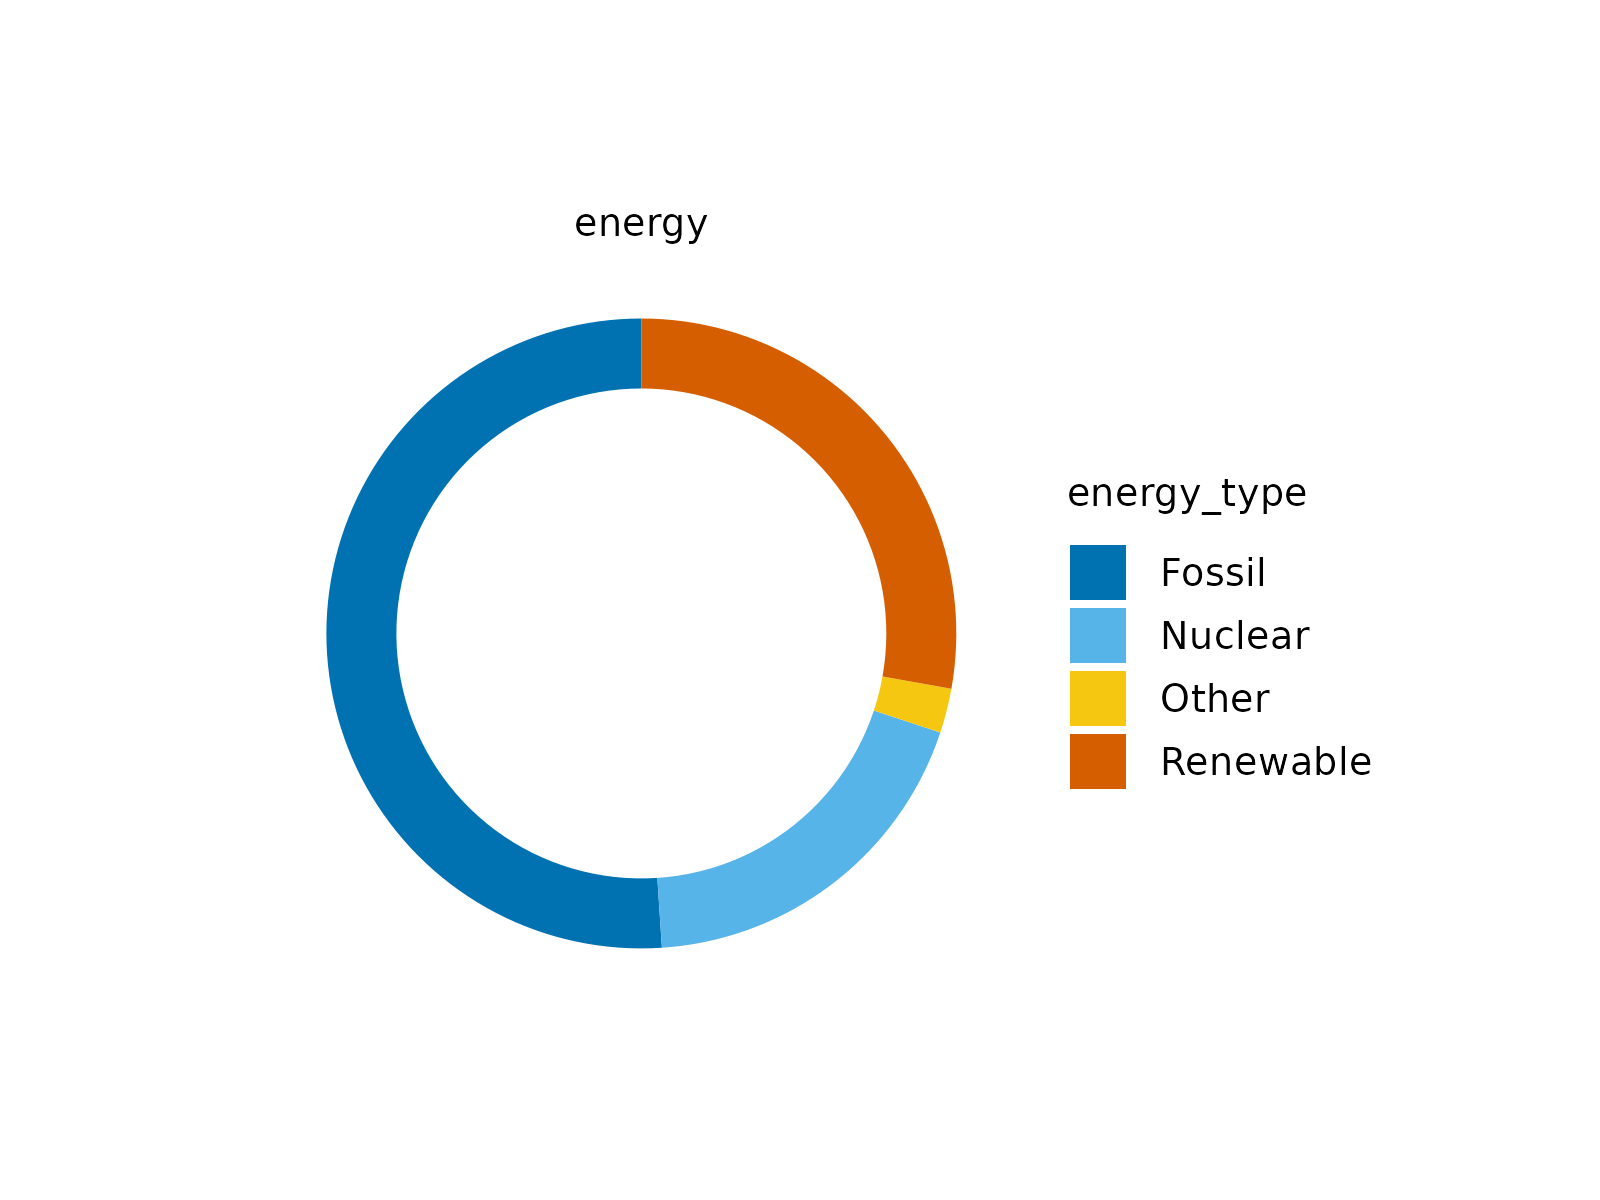
 energy |>
tidyplot(color = energy_type) |>
add_donut()
energy |>
tidyplot(color = energy_type) |>
add_donut()
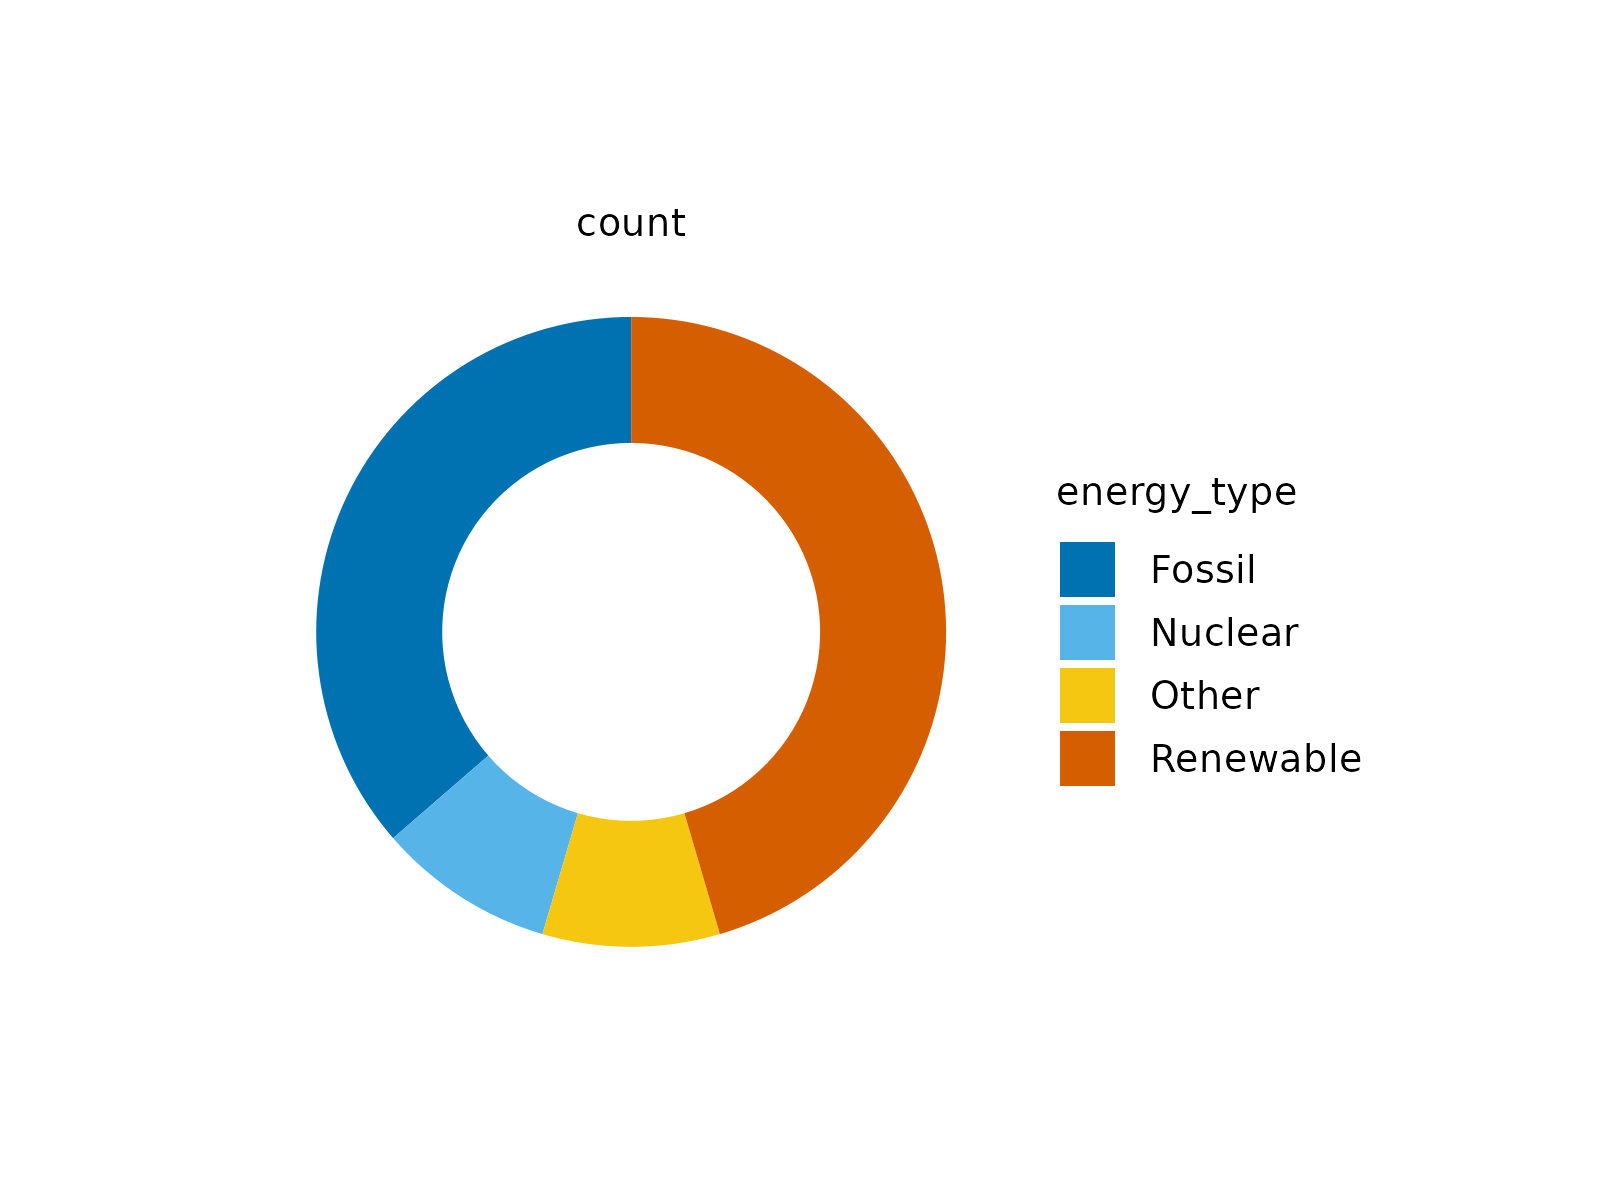 energy |>
tidyplot(color = energy_type) |>
add_donut(width = 0.5)
energy |>
tidyplot(color = energy_type) |>
add_donut(width = 0.5)
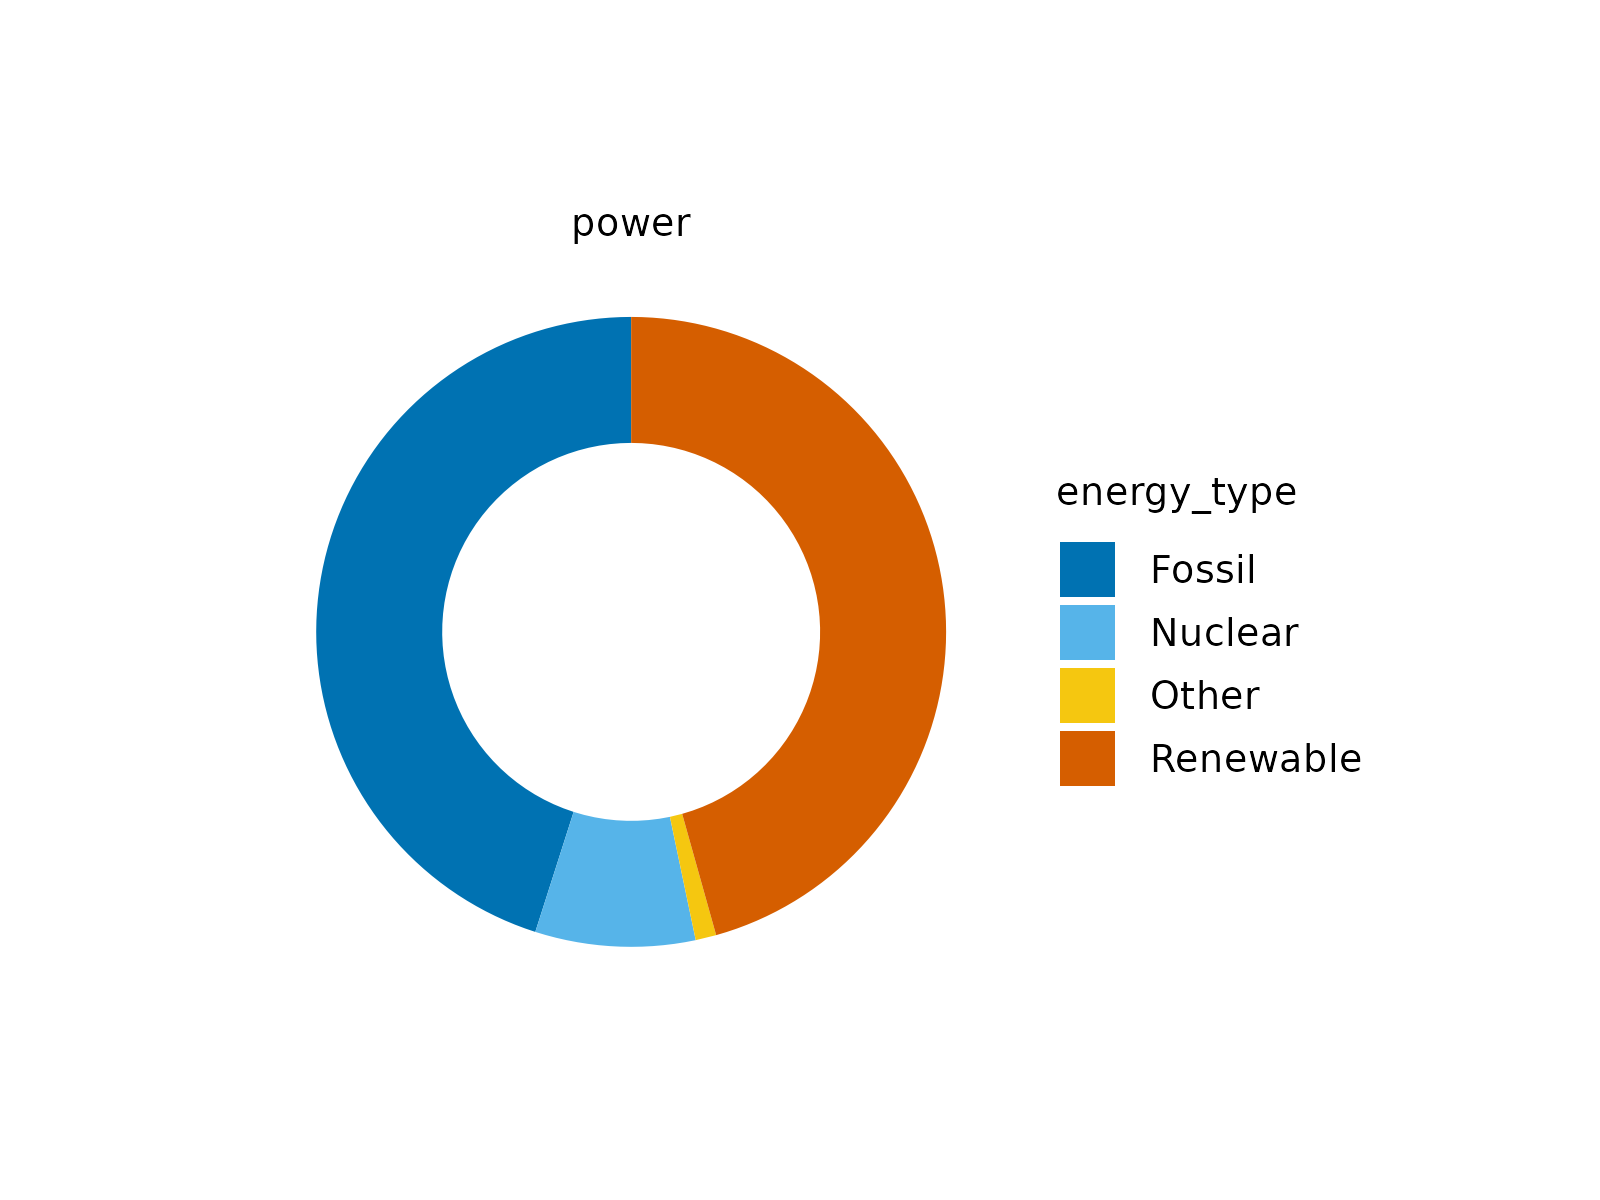
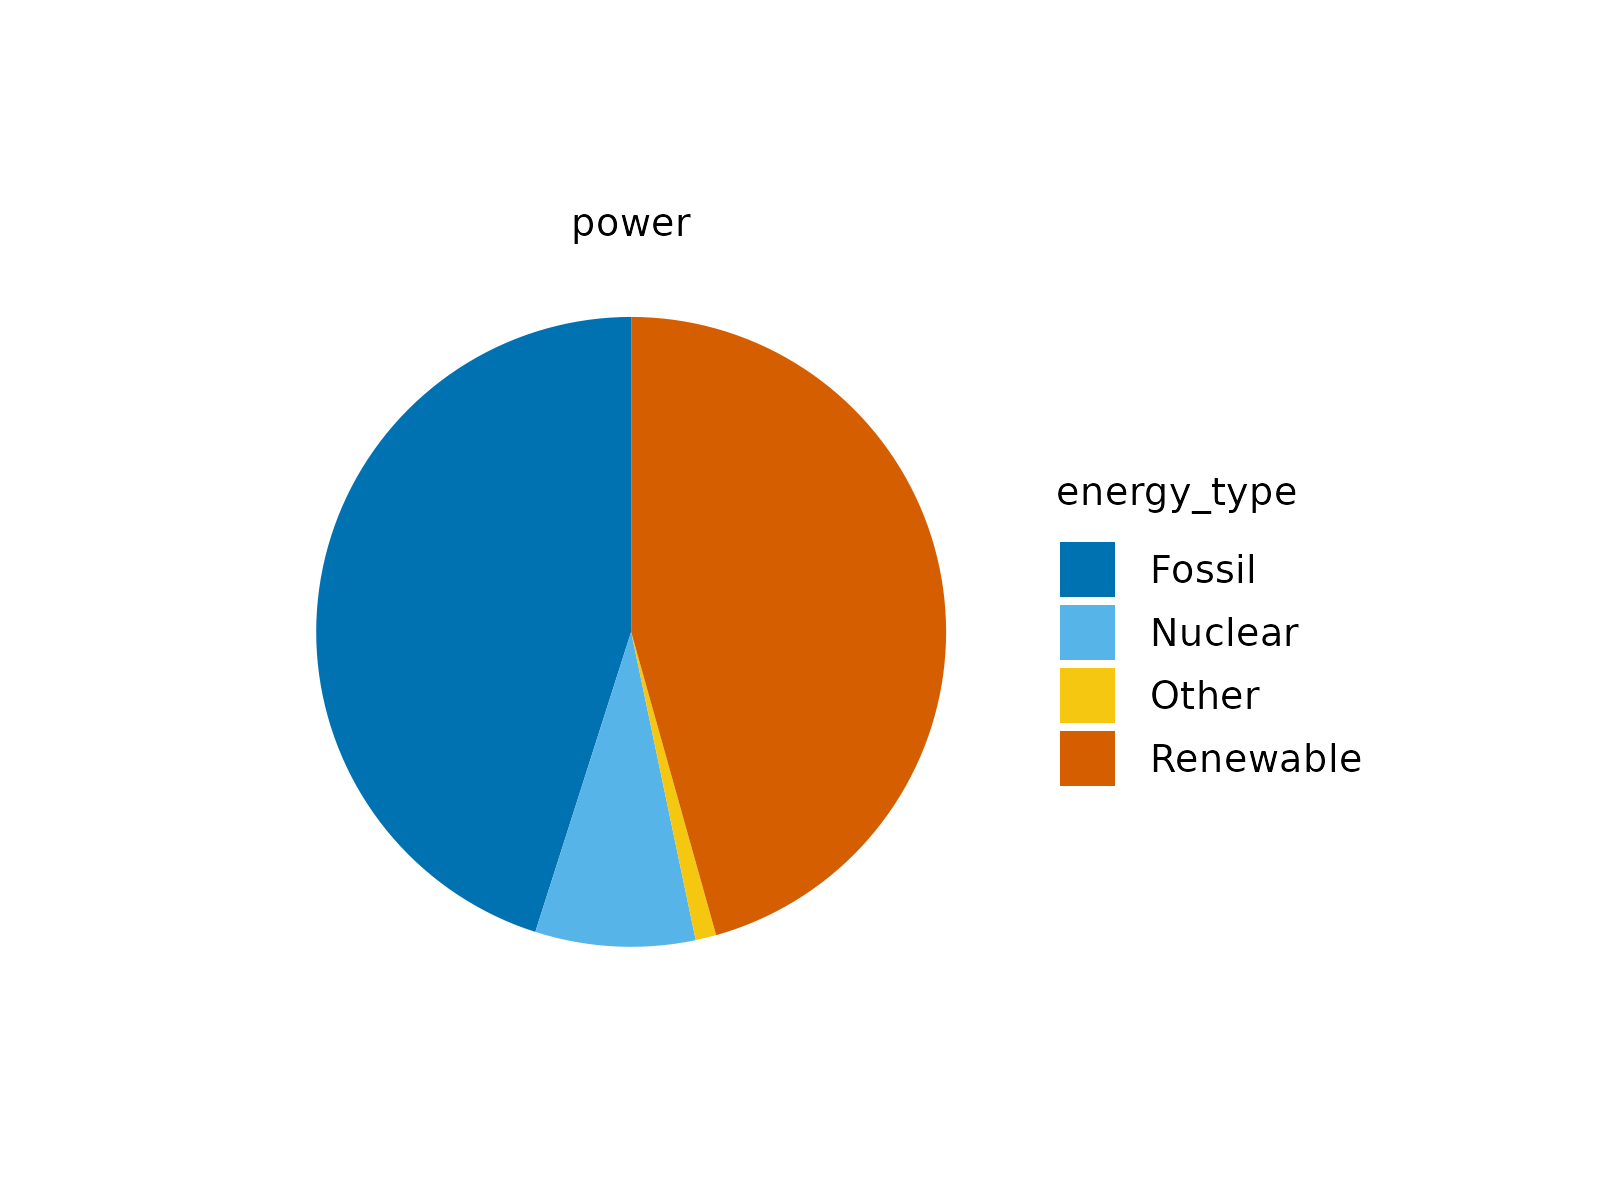 # for a `sum` provide `color` and `y`
# `sum` of `energy` in each `energy_type` category
energy |>
tidyplot(y = energy, color = energy_type) |>
add_pie()
# for a `sum` provide `color` and `y`
# `sum` of `energy` in each `energy_type` category
energy |>
tidyplot(y = energy, color = energy_type) |>
add_pie()
 energy |>
tidyplot(y = energy, color = energy_type) |>
add_donut()
energy |>
tidyplot(y = energy, color = energy_type) |>
add_donut()
 energy |>
tidyplot(y = energy, color = energy_type) |>
add_donut(width = 0.5)
energy |>
tidyplot(y = energy, color = energy_type) |>
add_donut(width = 0.5)