Sort axis or color levels
Usage
sort_x_axis_levels(plot, ..., .fun = NULL, .reverse = FALSE)

sort_y_axis_levels(plot, ..., .fun = NULL, .reverse = FALSE)

sort_color_levels(plot, ..., .fun = NULL, .reverse = FALSE)
Arguments
- plot
A
tidyplotgenerated with the functiontidyplot().- ...
Optional variables to use for sorting.
- .fun
Override the function used for sorting. Is automatically determined from the plot.
- .reverse
Whether the order should be reversed or not. Defaults to
FALSE, meaning not reversed.
Examples
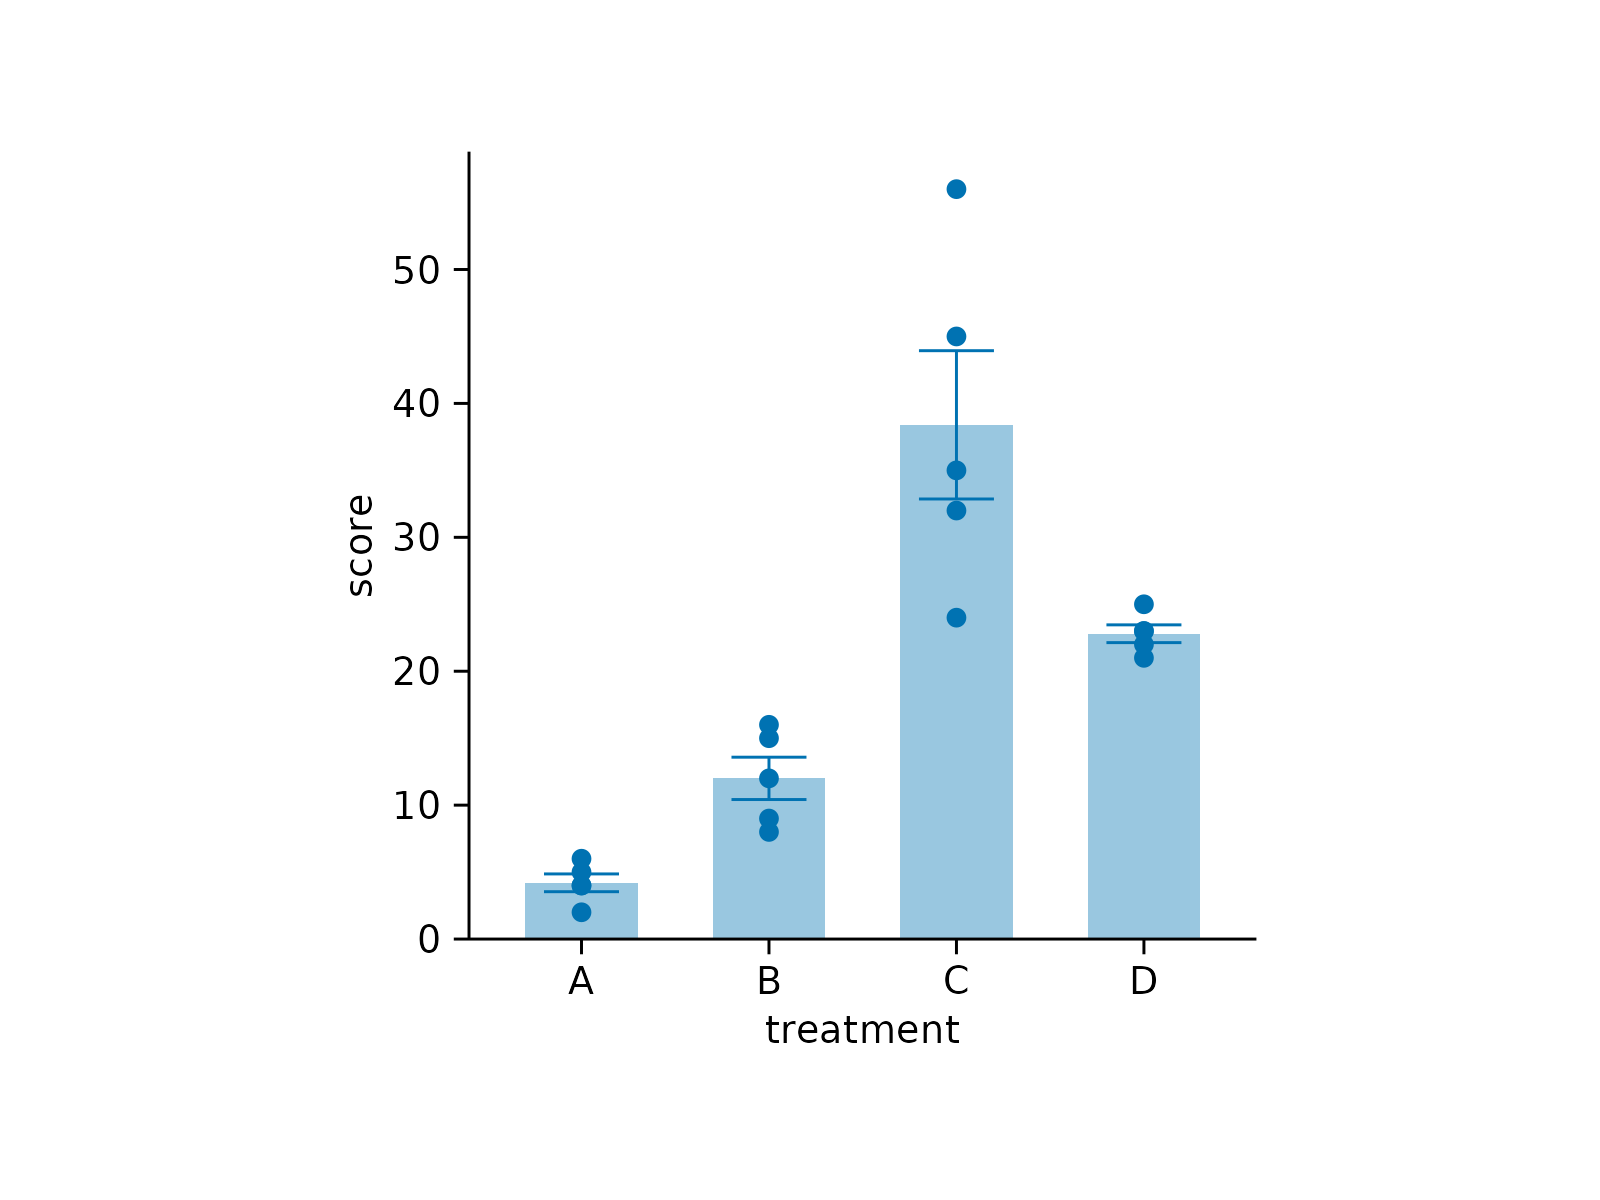
# Before adjustments
study |>
tidyplot(x = treatment, y = score) |>
add_data_points() |>
add_mean_bar(alpha = 0.4) |>
add_sem_errorbar()
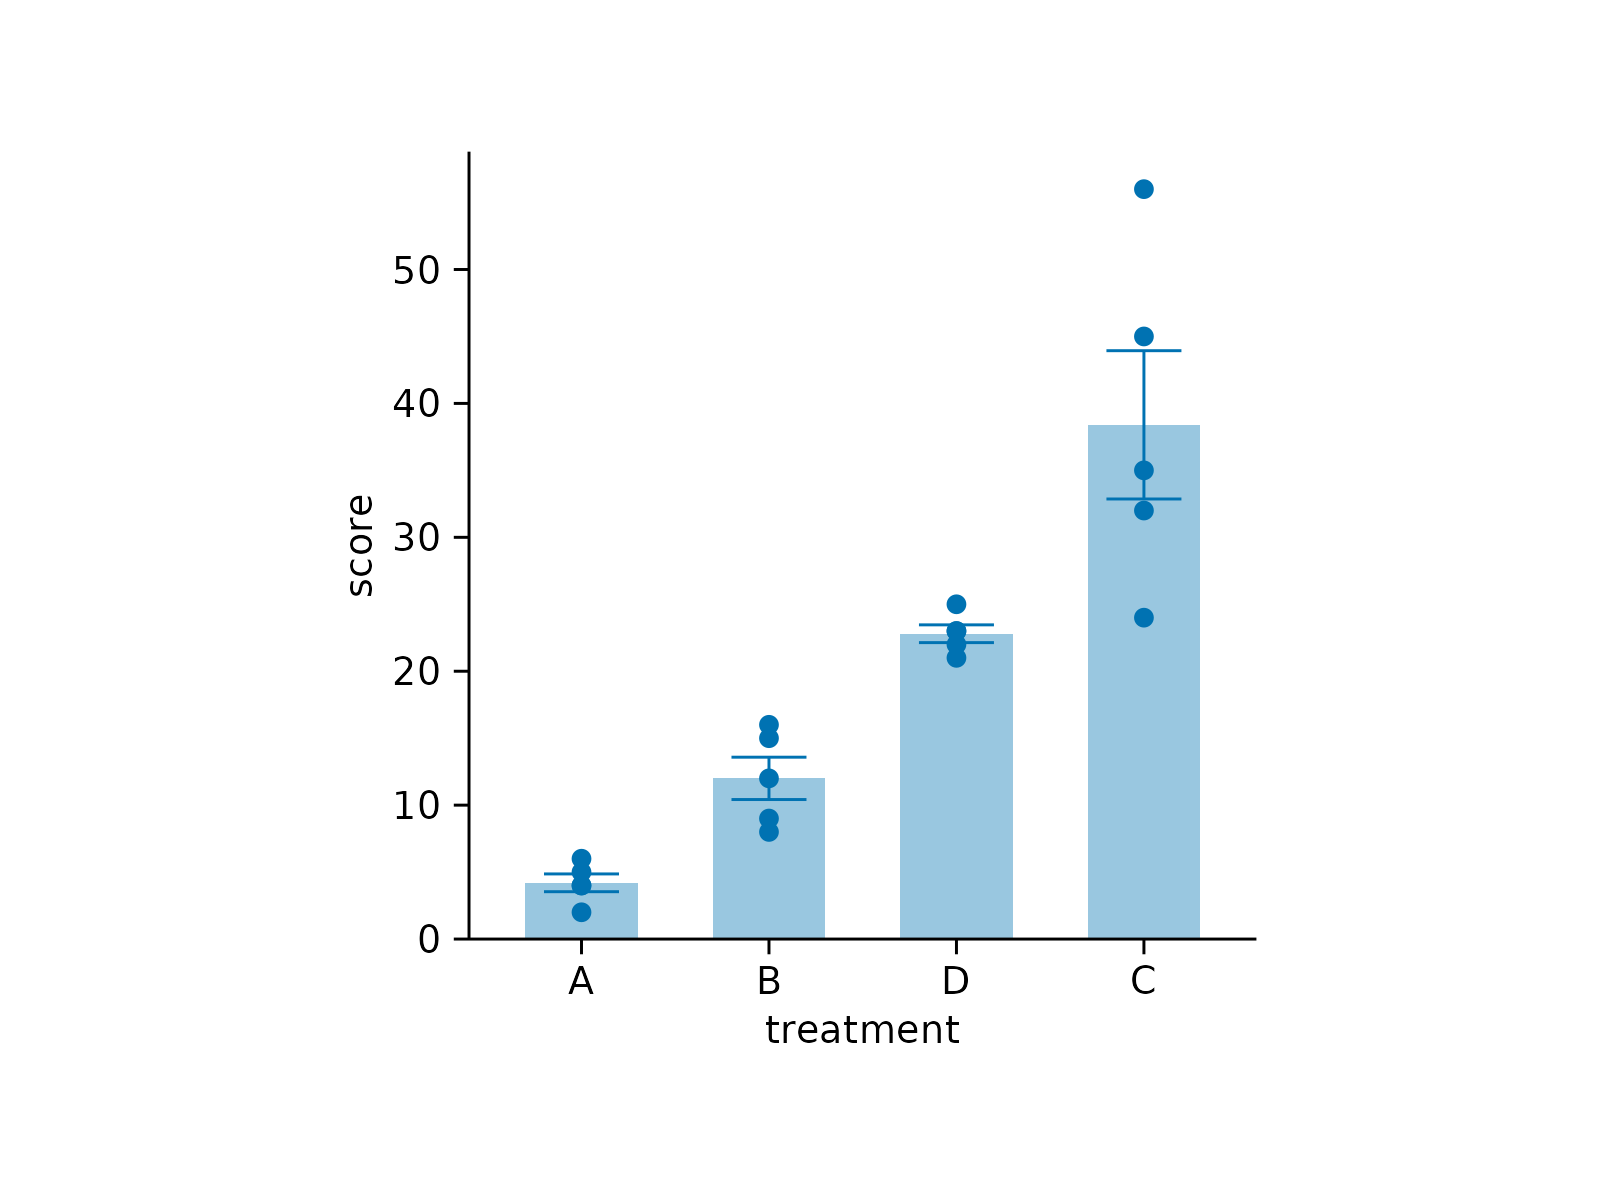
 # Sort x-axis levels by score
study |>
tidyplot(x = treatment, y = score) |>
add_data_points() |>
add_mean_bar(alpha = 0.4) |>
add_sem_errorbar() |>
sort_x_axis_levels()
# Sort x-axis levels by score
study |>
tidyplot(x = treatment, y = score) |>
add_data_points() |>
add_mean_bar(alpha = 0.4) |>
add_sem_errorbar() |>
sort_x_axis_levels()
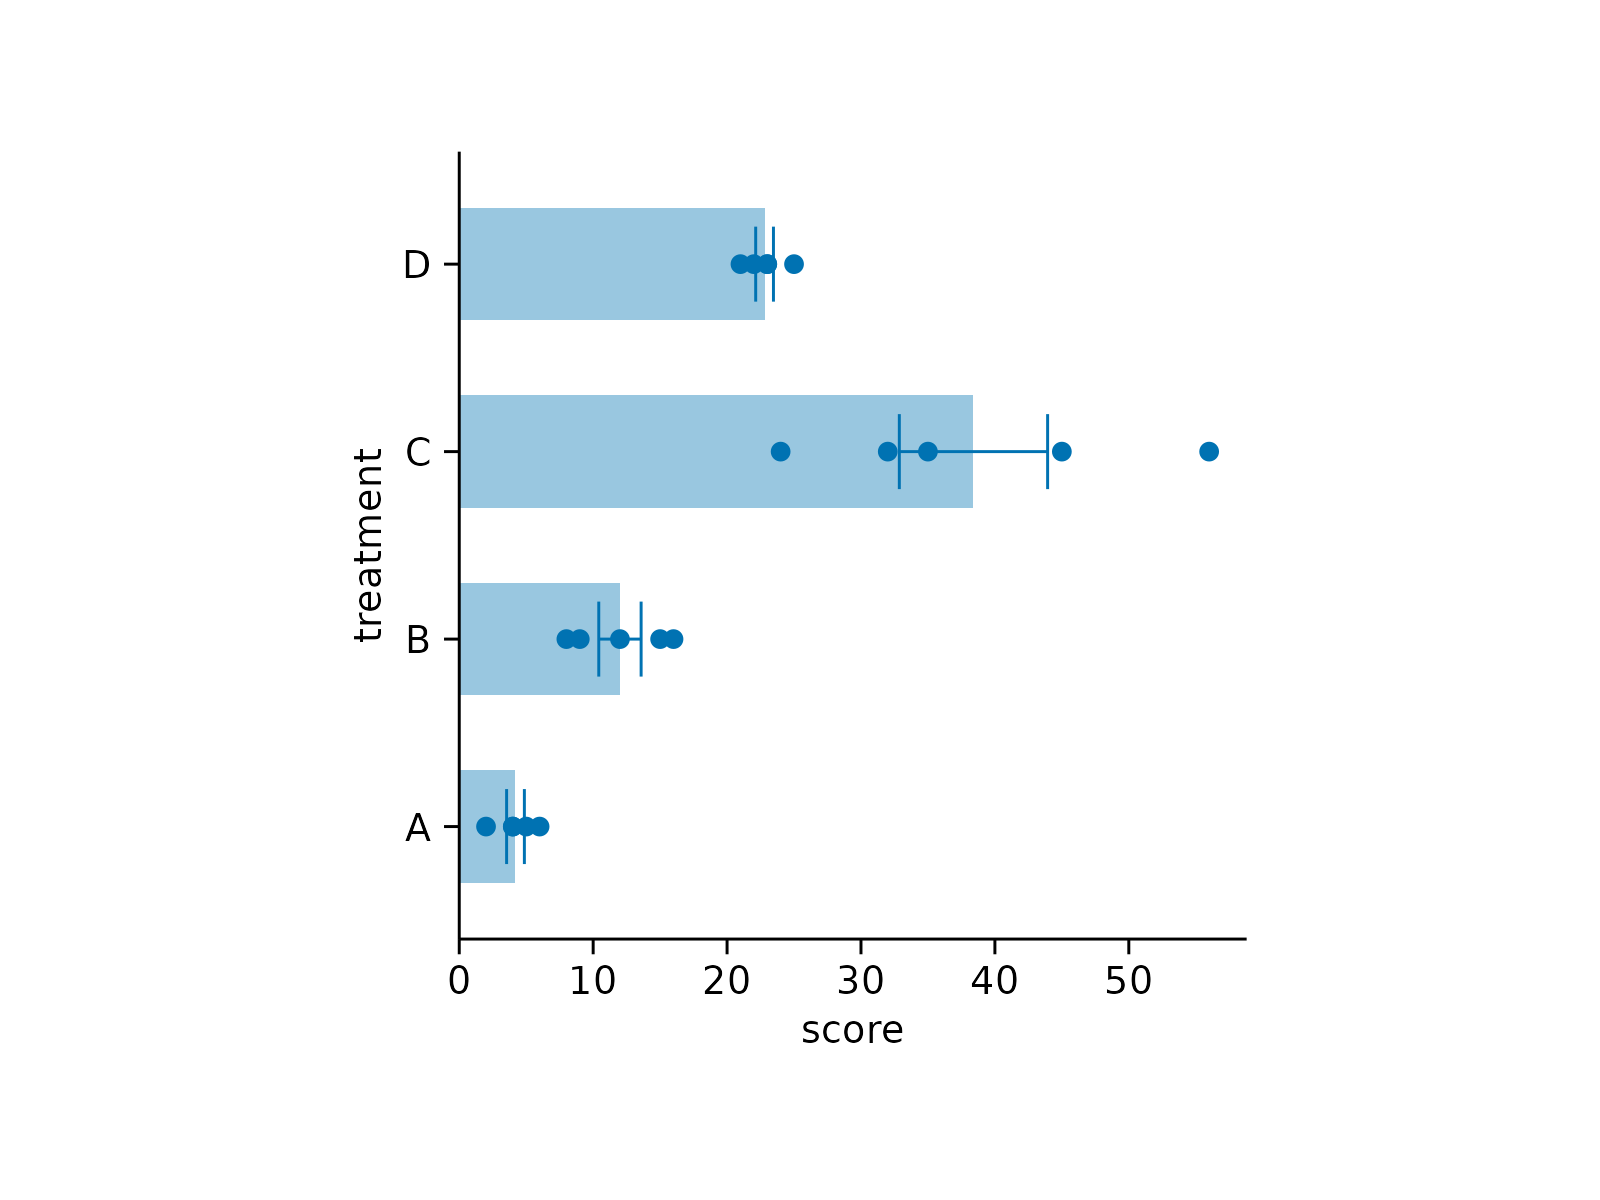
 # Before adjustments
study |>
tidyplot(x = score, y = treatment) |>
add_data_points() |>
add_mean_bar(alpha = 0.4) |>
add_sem_errorbar()
# Before adjustments
study |>
tidyplot(x = score, y = treatment) |>
add_data_points() |>
add_mean_bar(alpha = 0.4) |>
add_sem_errorbar()
 # Sort y-axis levels by score
study |>
tidyplot(x = score, y = treatment) |>
add_data_points() |>
add_mean_bar(alpha = 0.4) |>
add_sem_errorbar() |>
sort_y_axis_levels()
# Sort y-axis levels by score
study |>
tidyplot(x = score, y = treatment) |>
add_data_points() |>
add_mean_bar(alpha = 0.4) |>
add_sem_errorbar() |>
sort_y_axis_levels()
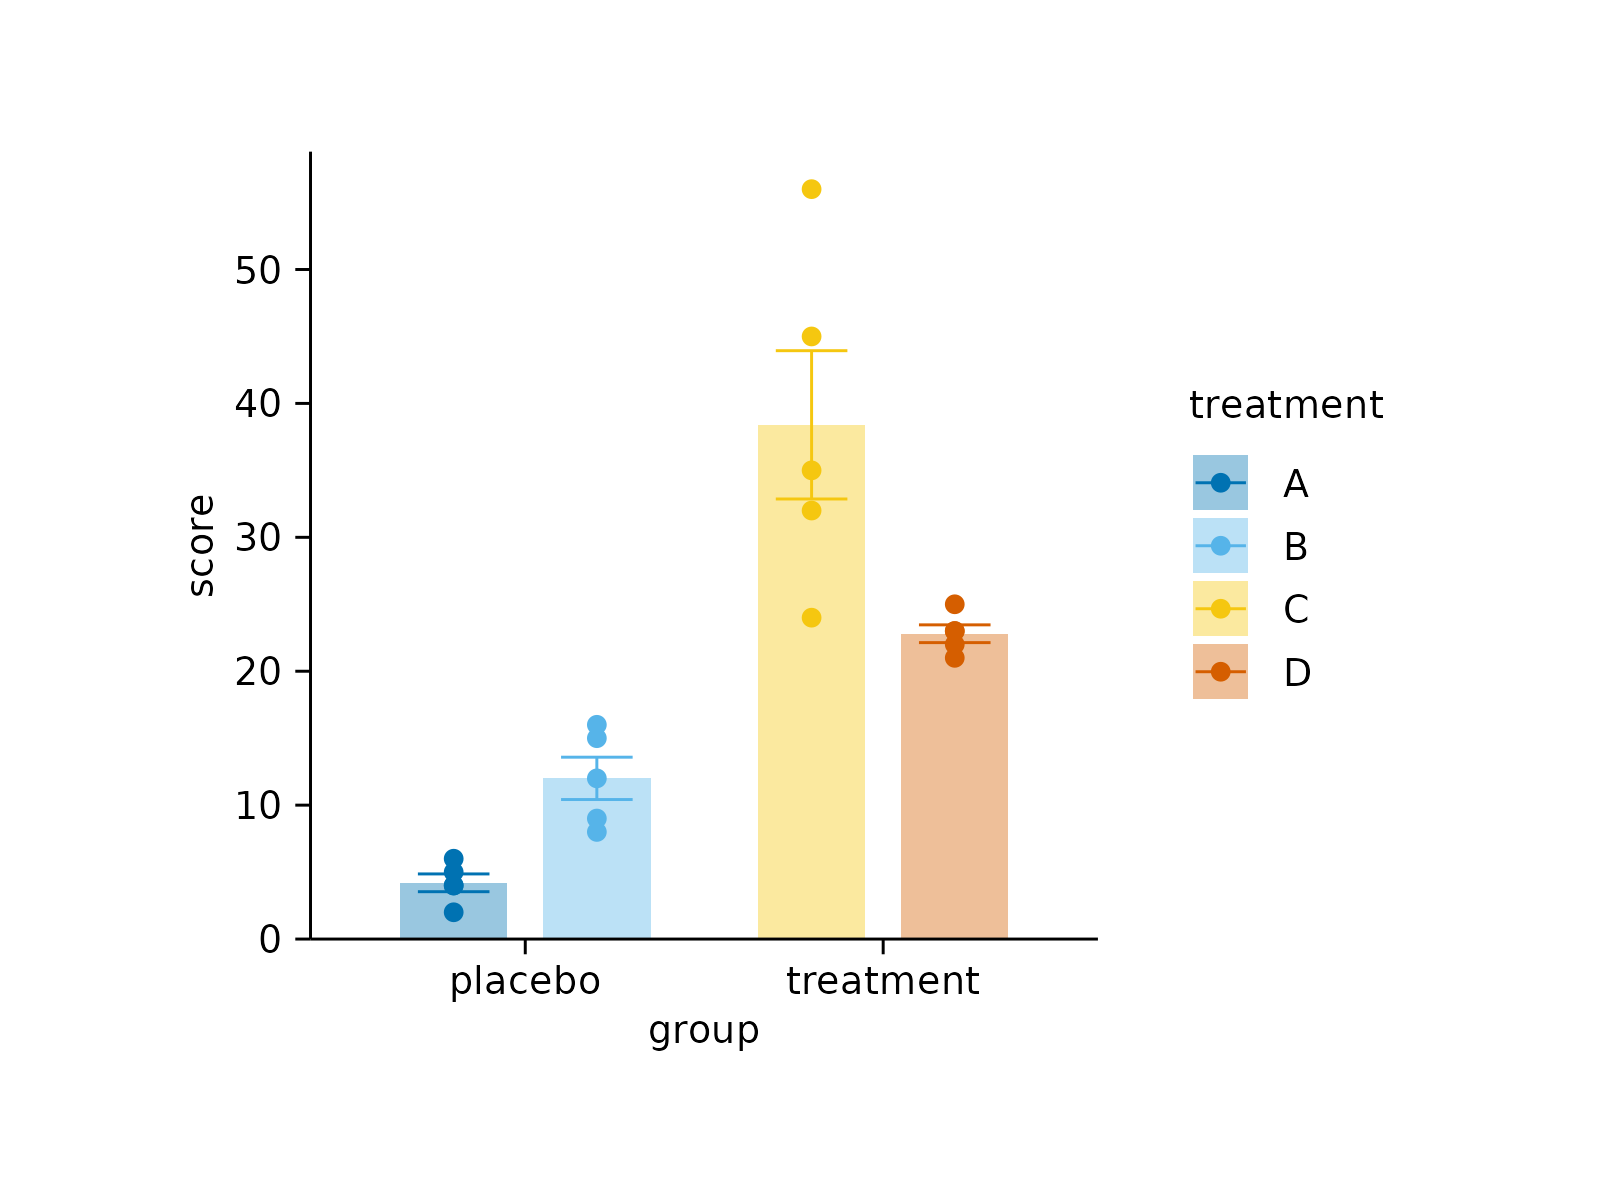
 # Before adjustment
study |>
tidyplot(x = group, y = score, color = treatment) |>
add_data_points() |>
add_mean_bar(alpha = 0.4) |>
add_sem_errorbar()
# Before adjustment
study |>
tidyplot(x = group, y = score, color = treatment) |>
add_data_points() |>
add_mean_bar(alpha = 0.4) |>
add_sem_errorbar()
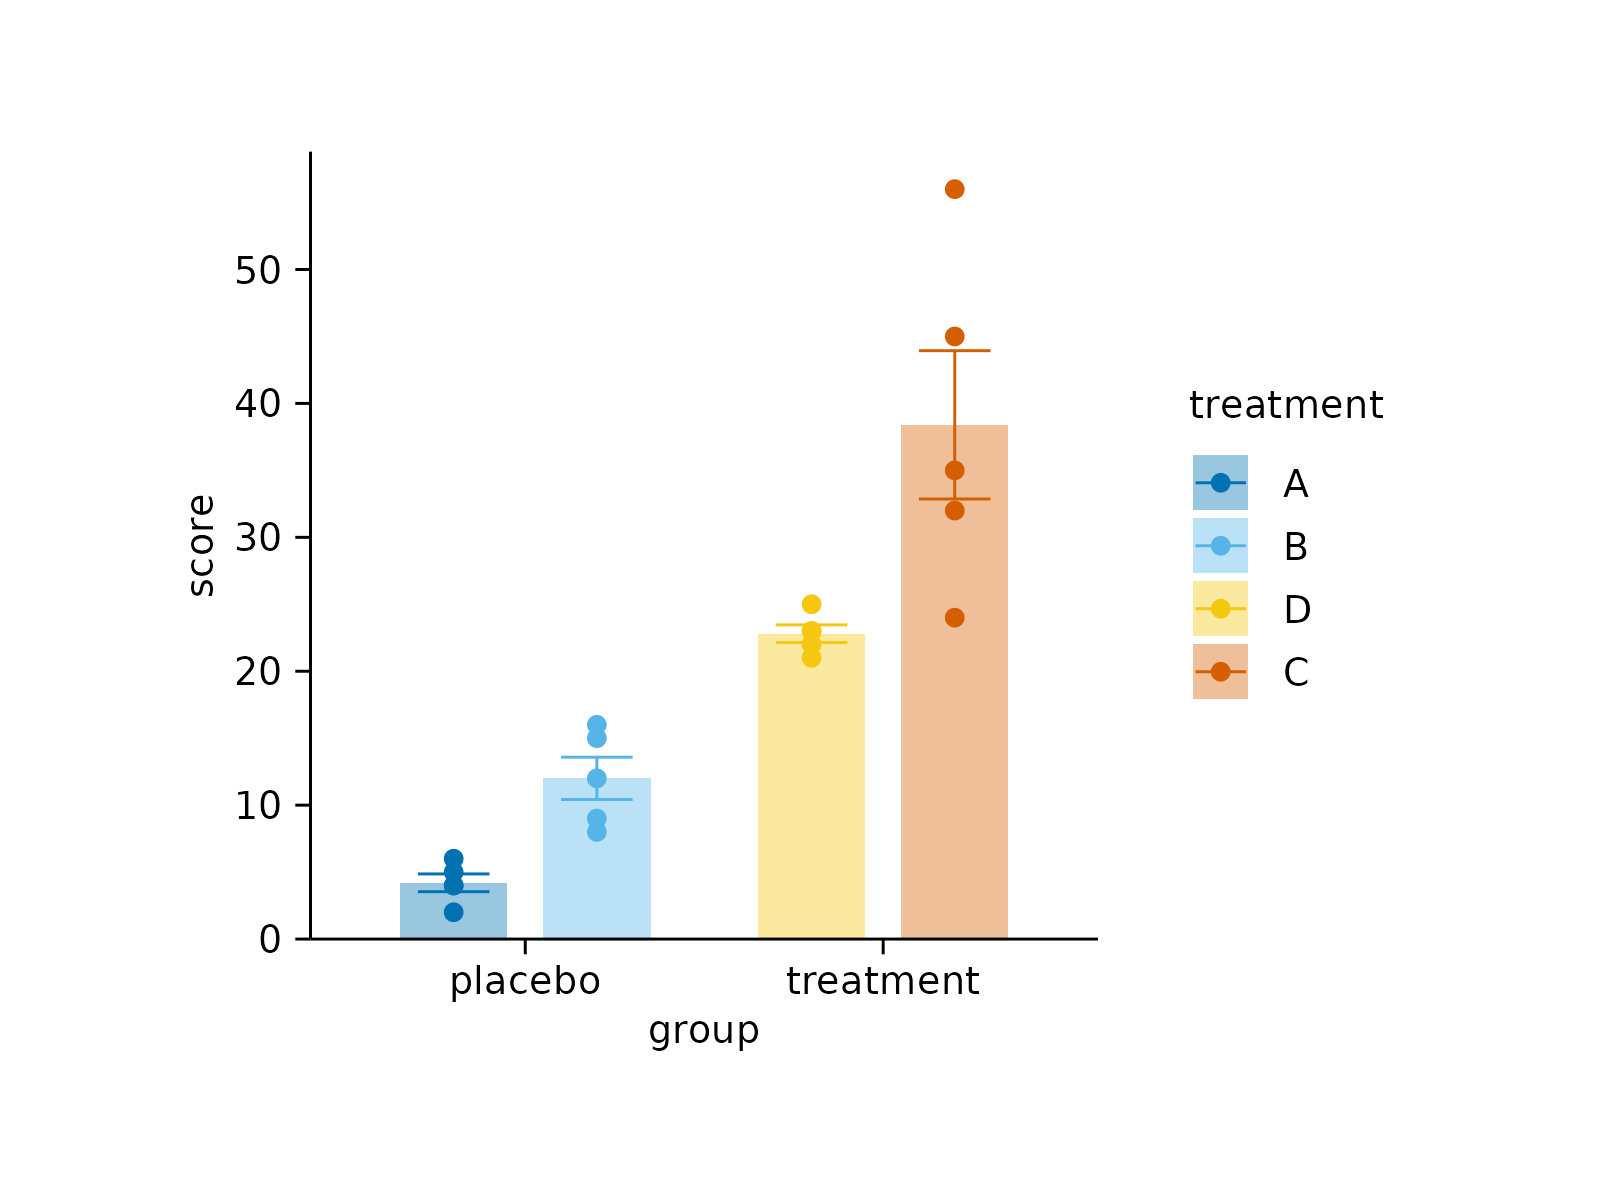
 # Sort color levels by score
study |>
tidyplot(x = group, y = score, color = treatment) |>
add_data_points() |>
add_mean_bar(alpha = 0.4) |>
add_sem_errorbar() |>
sort_color_levels()
# Sort color levels by score
study |>
tidyplot(x = group, y = score, color = treatment) |>
add_data_points() |>
add_mean_bar(alpha = 0.4) |>
add_sem_errorbar() |>
sort_color_levels()