Reverse axis or color levels
Arguments
- plot
A
tidyplotgenerated with the functiontidyplot().
Examples
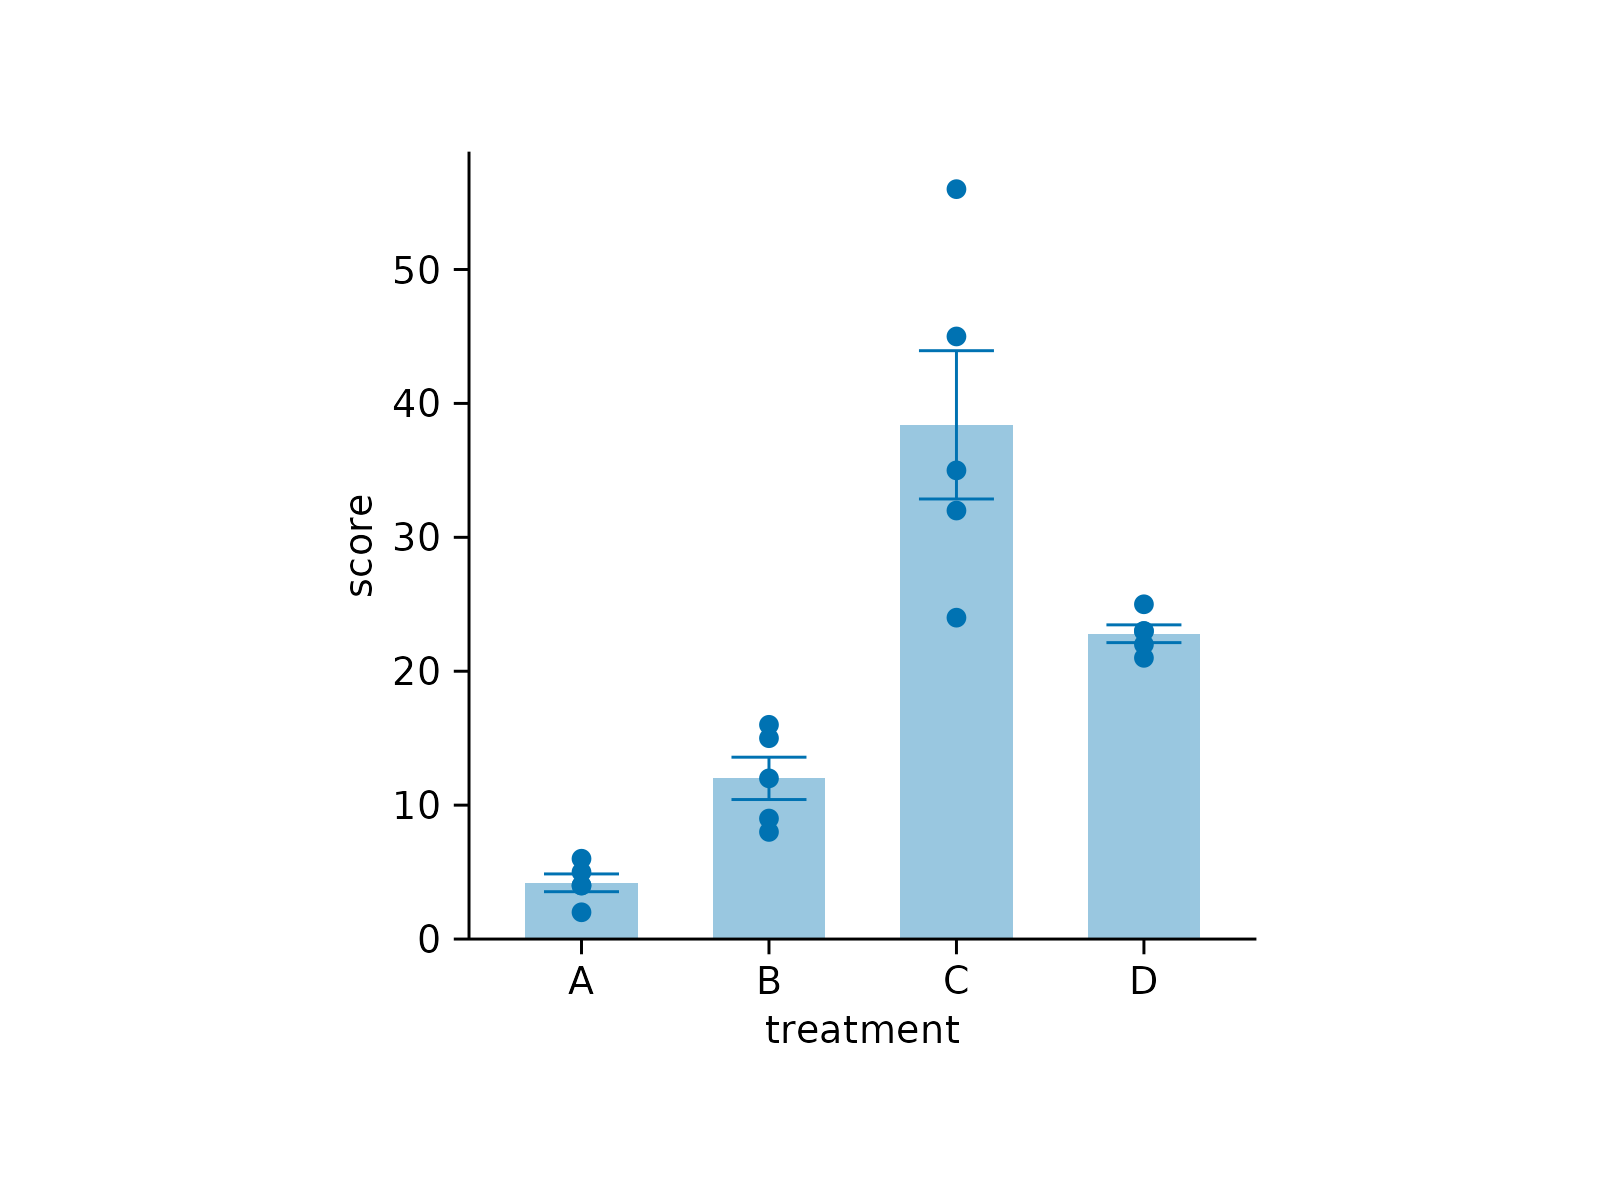
# Before adjustments
study |>
tidyplot(x = treatment, y = score) |>
add_data_points() |>
add_mean_bar(alpha = 0.4) |>
add_sem_errorbar()
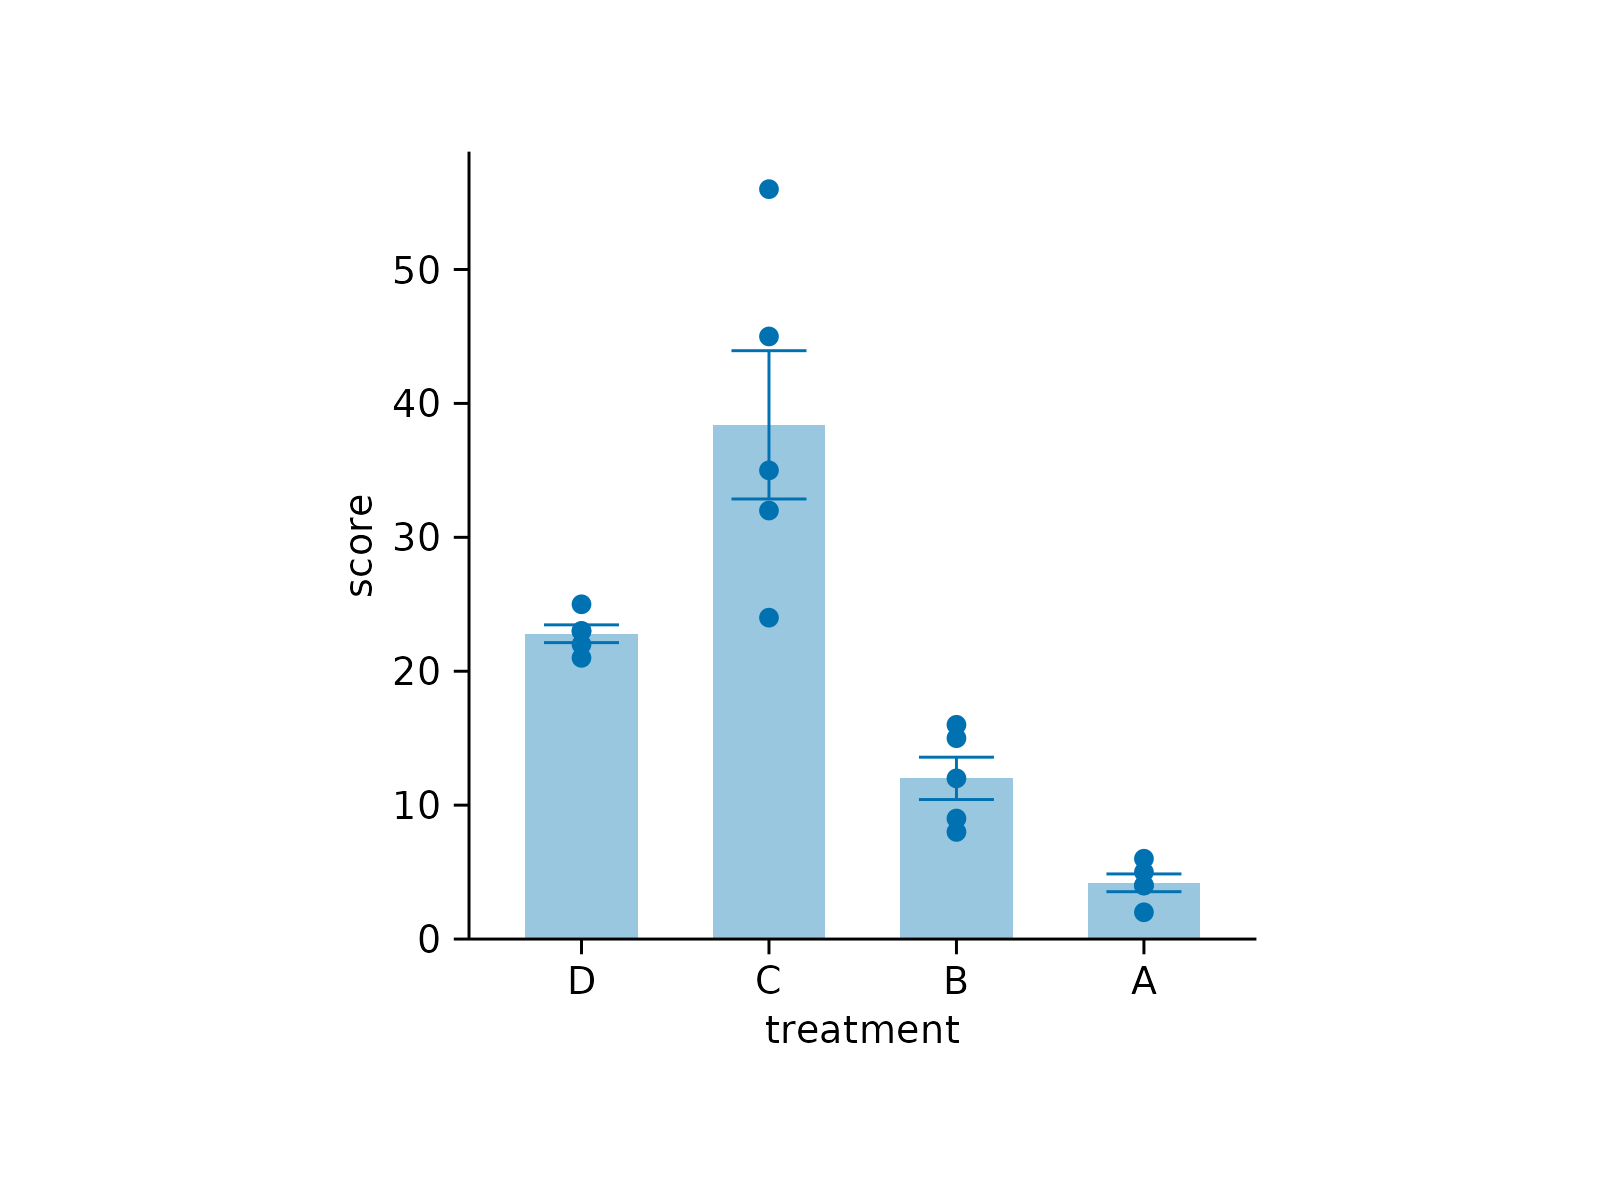
 # Reverse x-axis levels
study |>
tidyplot(x = treatment, y = score) |>
add_data_points() |>
add_mean_bar(alpha = 0.4) |>
add_sem_errorbar() |>
reverse_x_axis_levels()
# Reverse x-axis levels
study |>
tidyplot(x = treatment, y = score) |>
add_data_points() |>
add_mean_bar(alpha = 0.4) |>
add_sem_errorbar() |>
reverse_x_axis_levels()
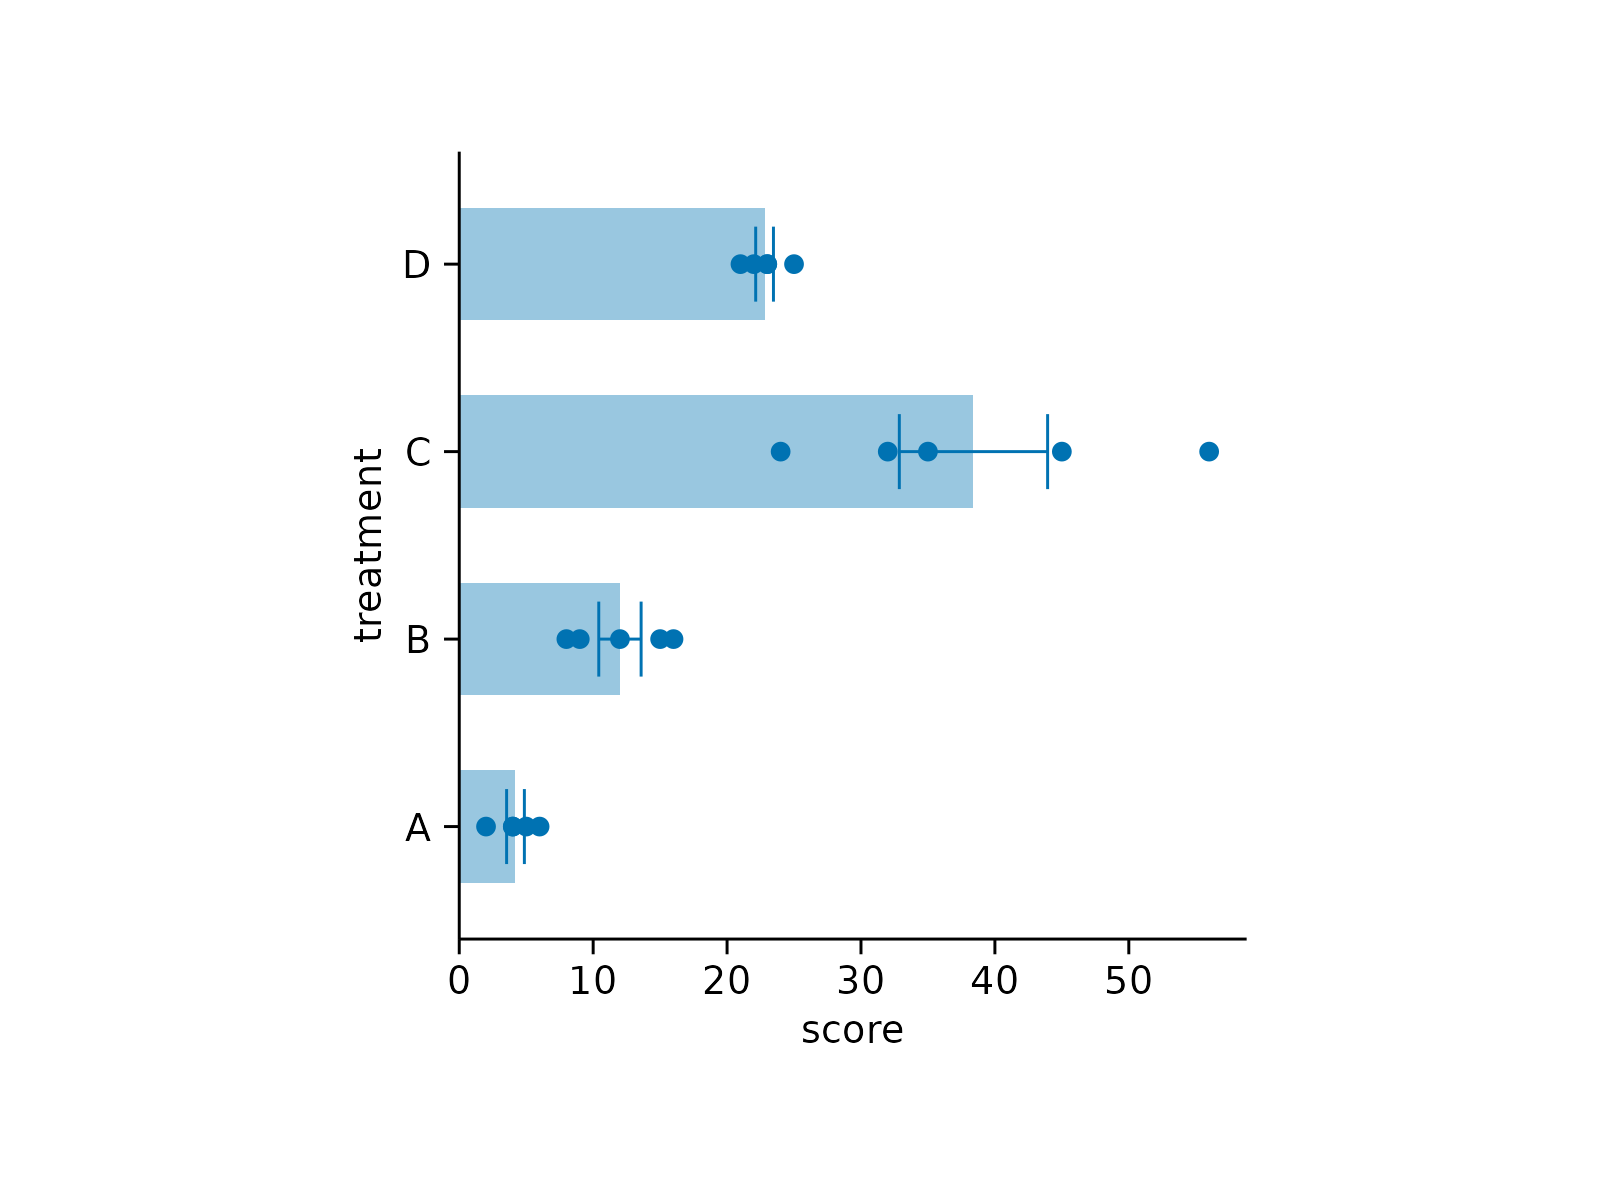
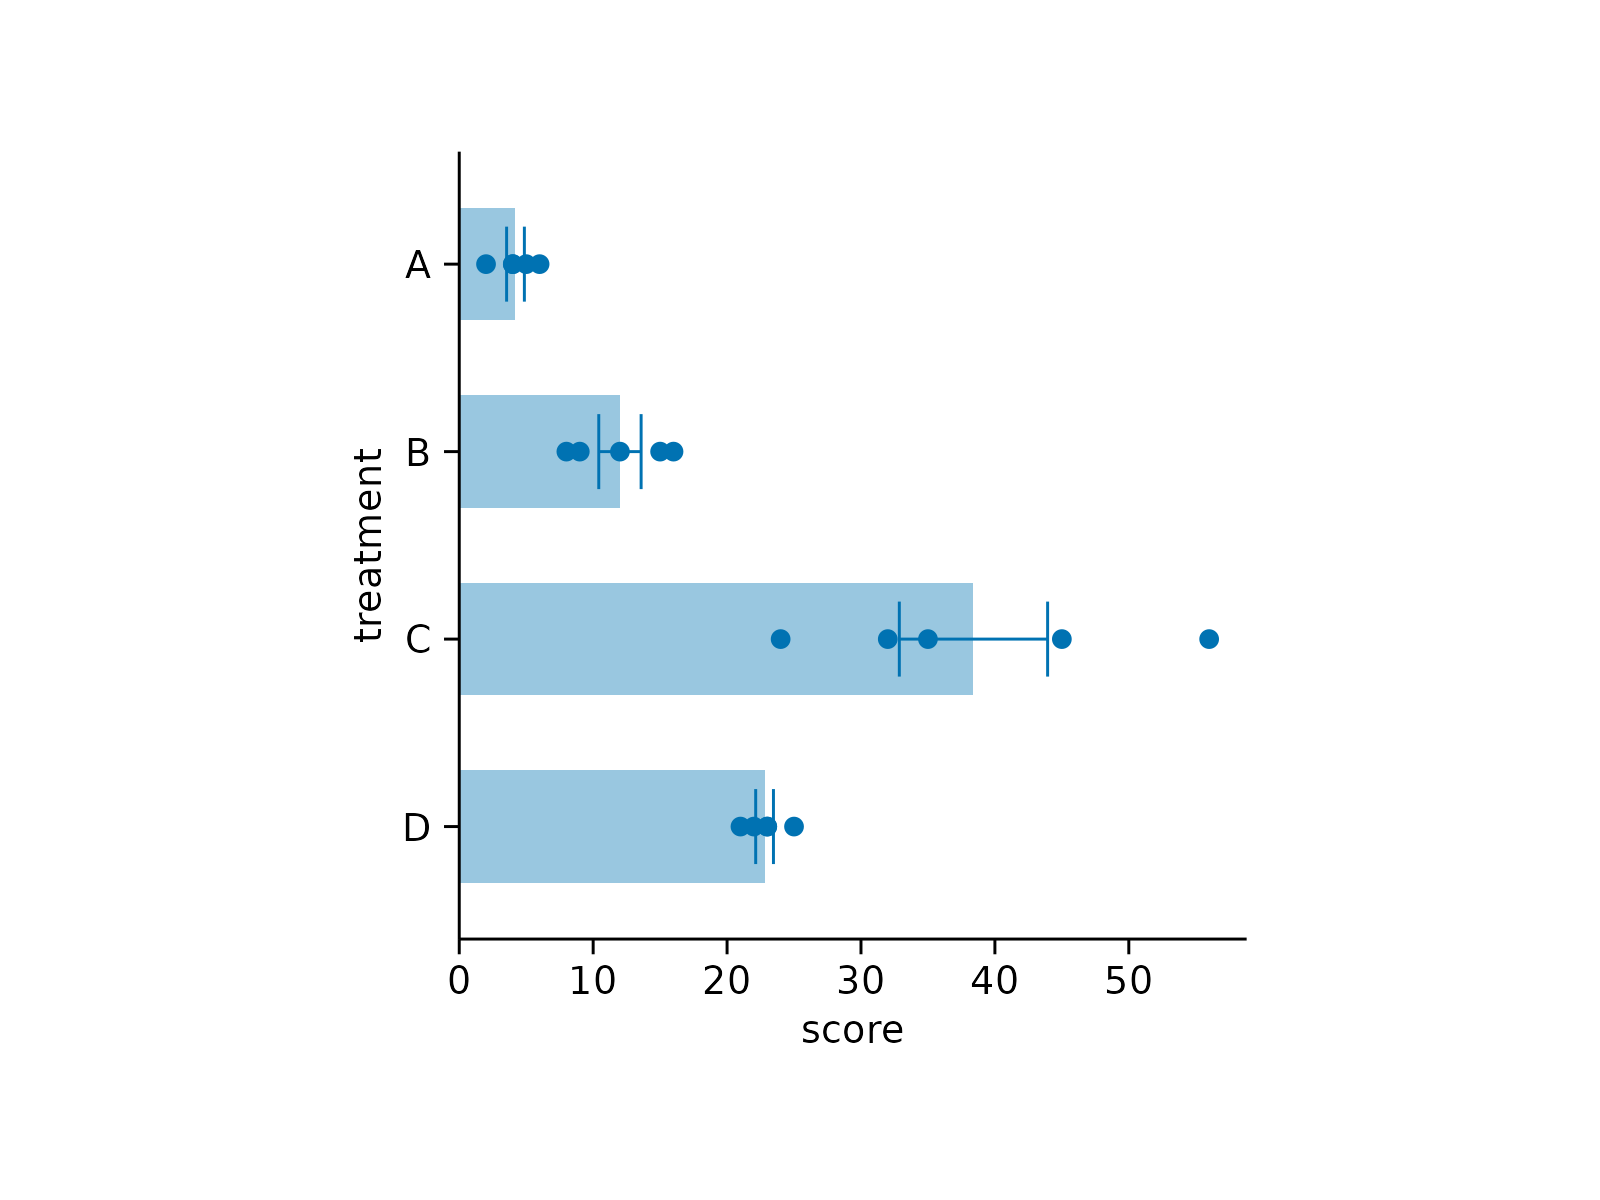
 # Before adjustments
study |>
tidyplot(x = score, y = treatment) |>
add_data_points() |>
add_mean_bar(alpha = 0.4) |>
add_sem_errorbar()
# Before adjustments
study |>
tidyplot(x = score, y = treatment) |>
add_data_points() |>
add_mean_bar(alpha = 0.4) |>
add_sem_errorbar()
 # Reverse y-axis levels
study |>
tidyplot(x = score, y = treatment) |>
add_data_points() |>
add_mean_bar(alpha = 0.4) |>
add_sem_errorbar() |>
reverse_y_axis_levels()
# Reverse y-axis levels
study |>
tidyplot(x = score, y = treatment) |>
add_data_points() |>
add_mean_bar(alpha = 0.4) |>
add_sem_errorbar() |>
reverse_y_axis_levels()
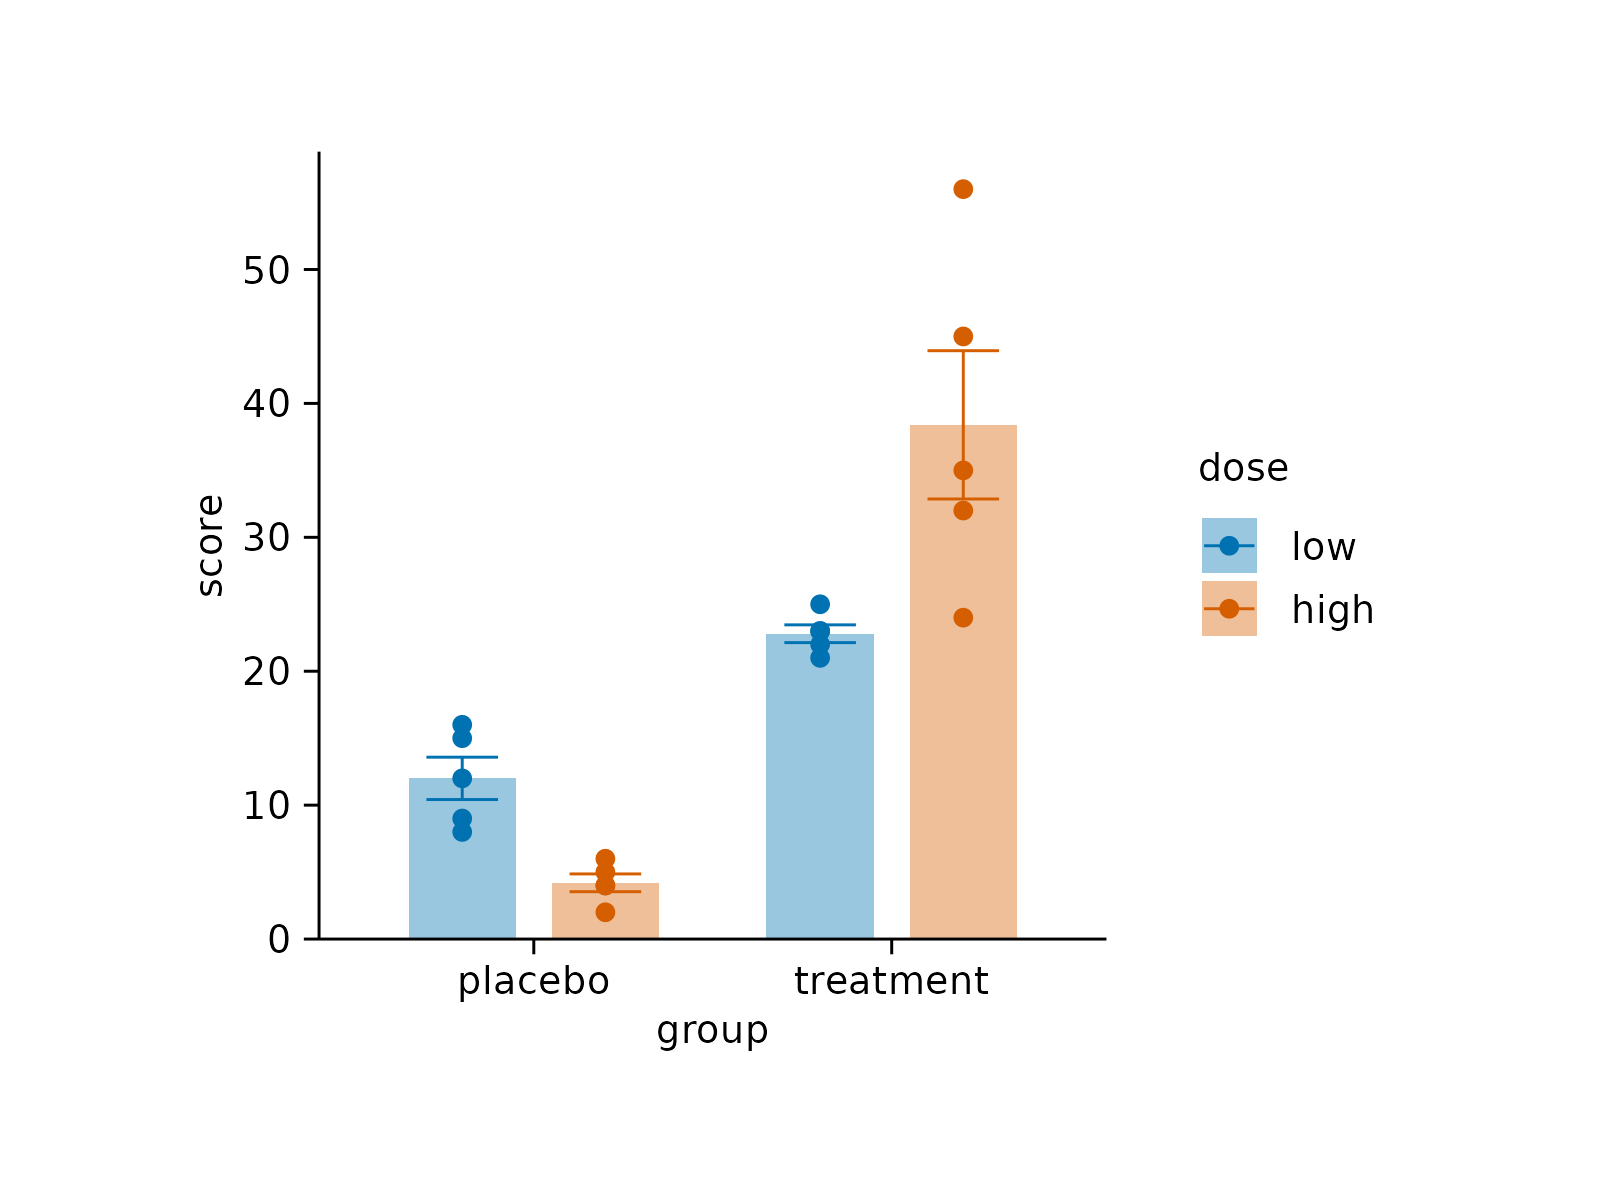
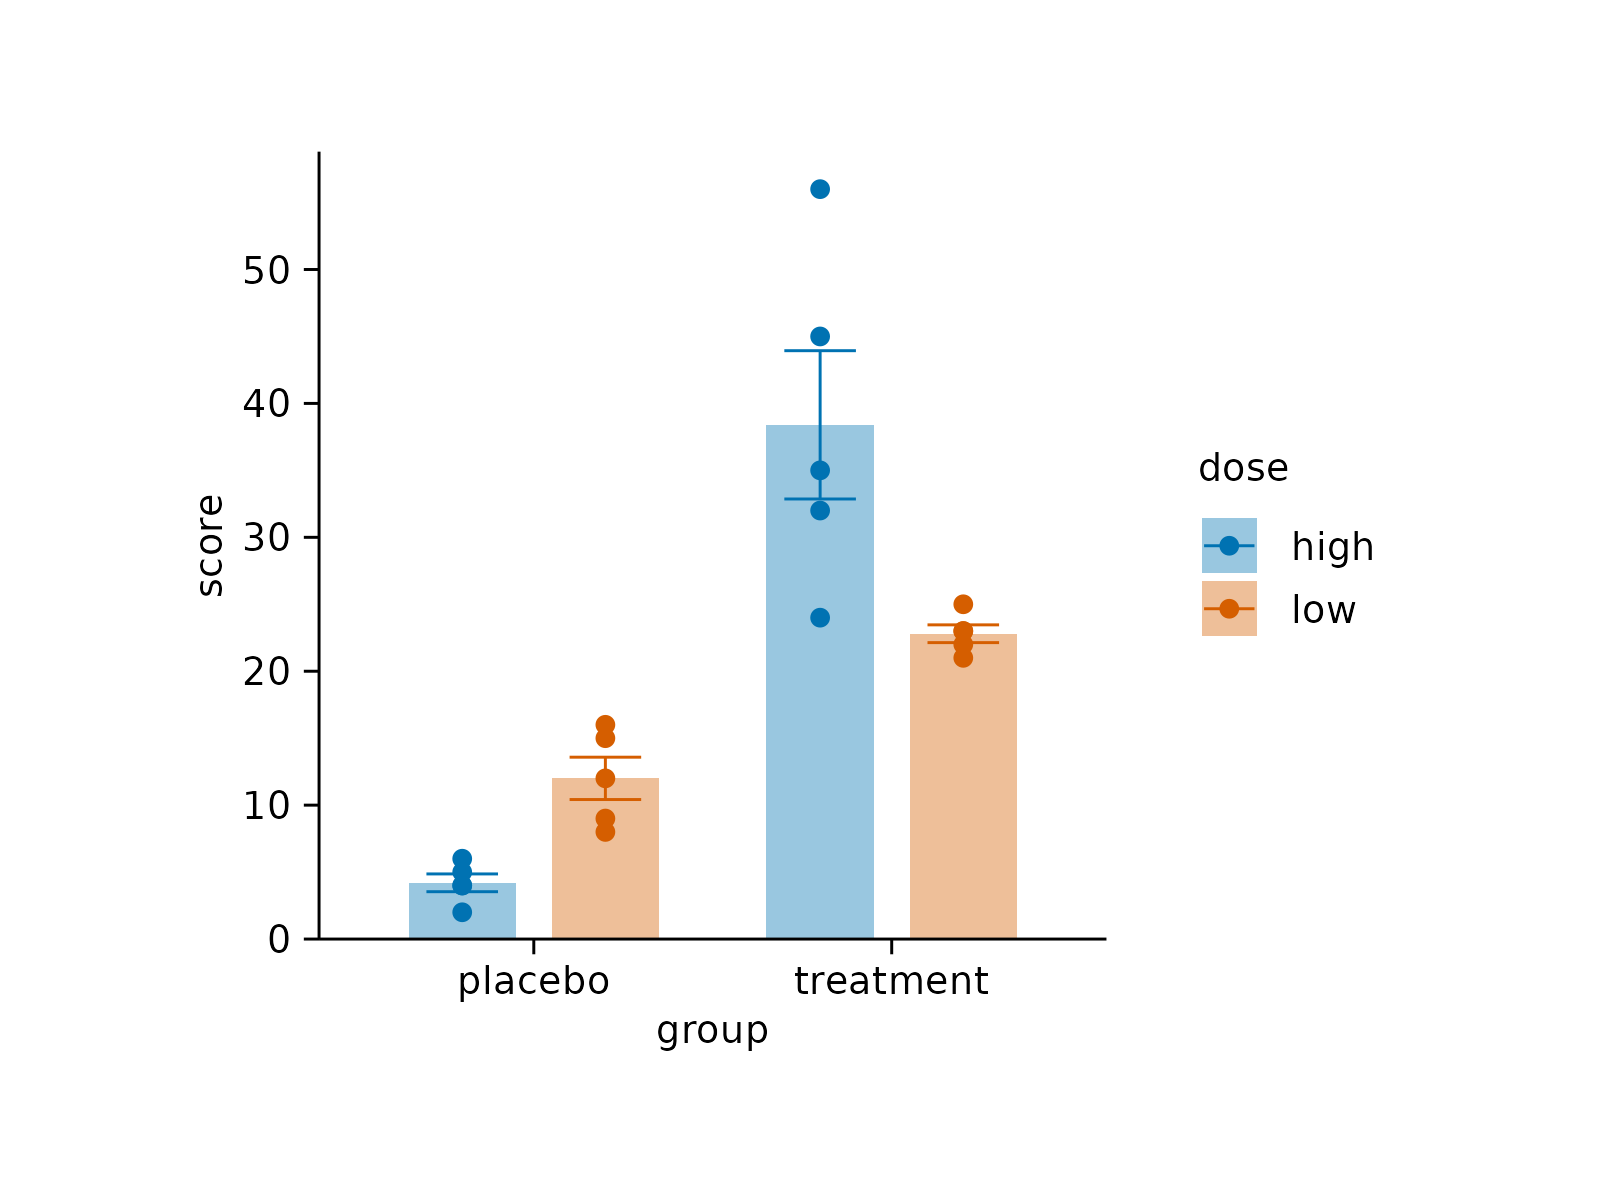
 # Before adjustment
study |>
tidyplot(x = group, y = score, color = dose) |>
add_data_points() |>
add_mean_bar(alpha = 0.4) |>
add_sem_errorbar()
# Before adjustment
study |>
tidyplot(x = group, y = score, color = dose) |>
add_data_points() |>
add_mean_bar(alpha = 0.4) |>
add_sem_errorbar()
 # Reverse color levels
study |>
tidyplot(x = group, y = score, color = dose) |>
add_data_points() |>
add_mean_bar(alpha = 0.4) |>
add_sem_errorbar() |>
reverse_color_levels()
# Reverse color levels
study |>
tidyplot(x = group, y = score, color = dose) |>
add_data_points() |>
add_mean_bar(alpha = 0.4) |>
add_sem_errorbar() |>
reverse_color_levels()