Reorder axis or color levels
Usage
reorder_x_axis_levels(plot, ...)

reorder_y_axis_levels(plot, ...)

reorder_color_levels(plot, ...)
Arguments
- plot
A
tidyplotgenerated with the functiontidyplot().- ...
Arguments passed on to
forcats::fct_relevel().
Examples
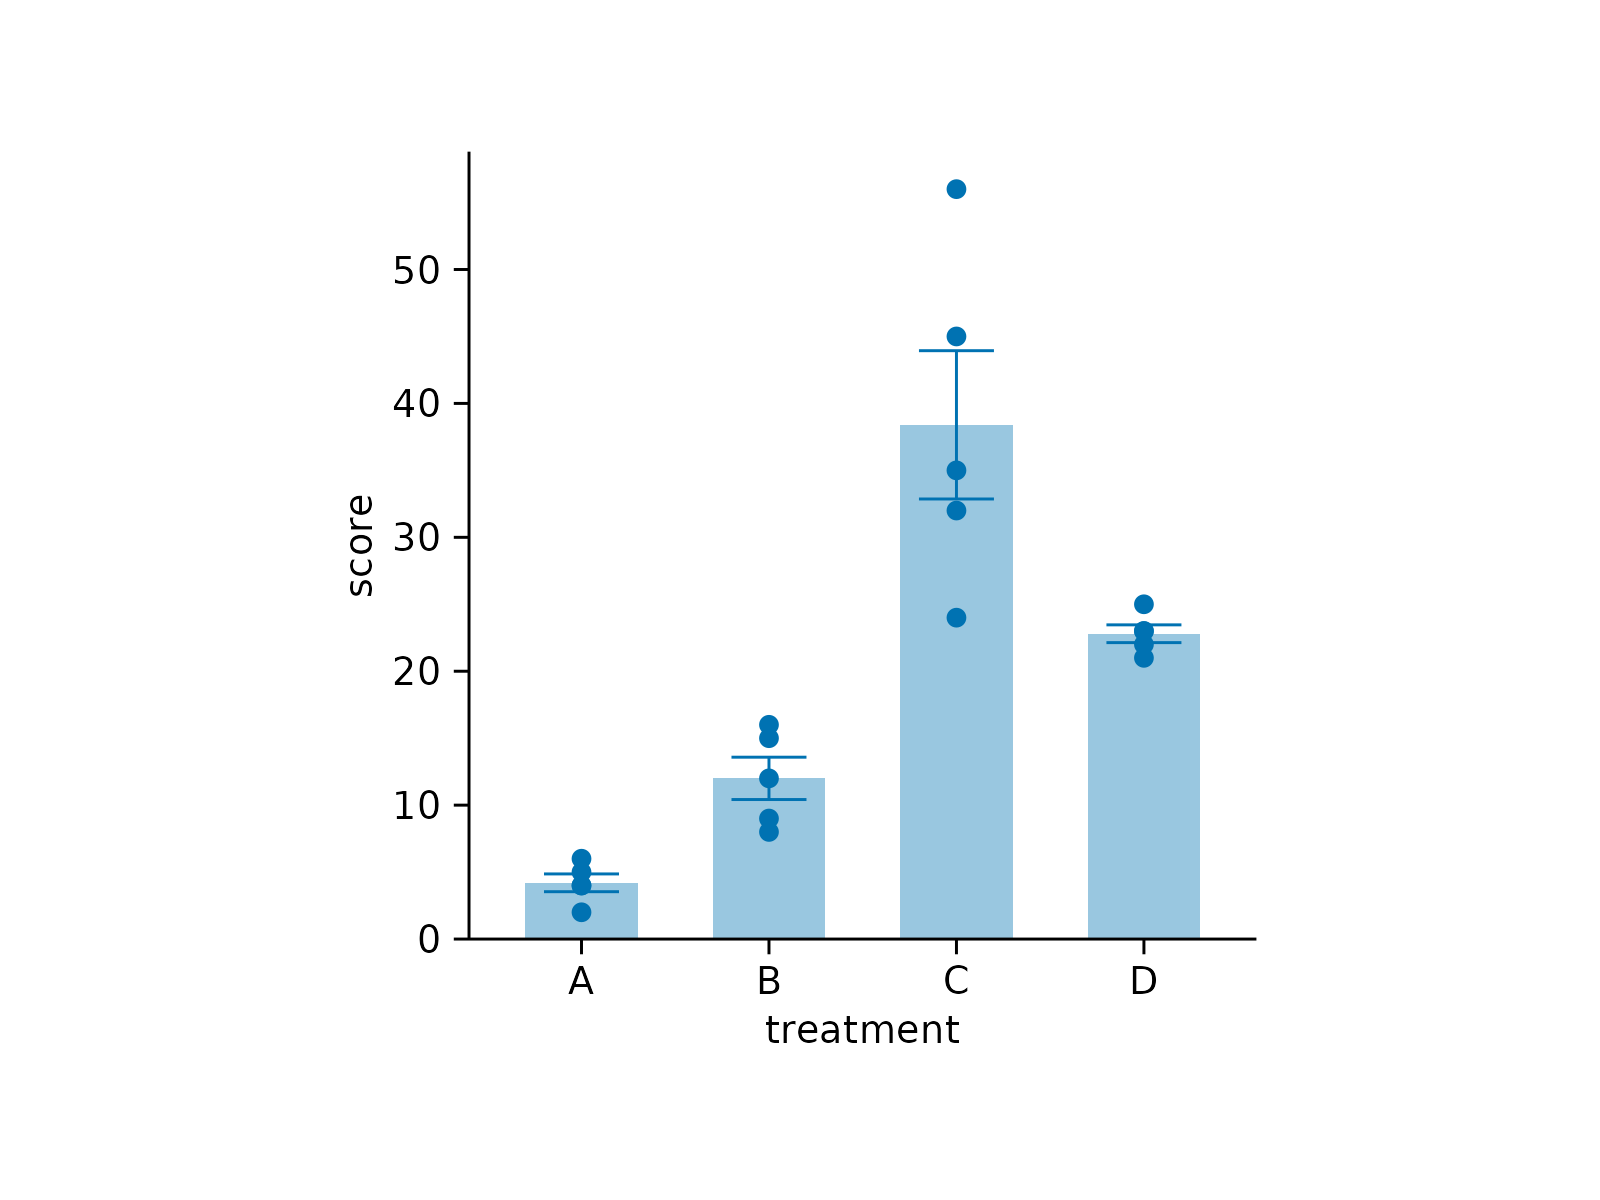
# Before adjustments
study |>
tidyplot(x = treatment, y = score) |>
add_data_points() |>
add_mean_bar(alpha = 0.4) |>
add_sem_errorbar()
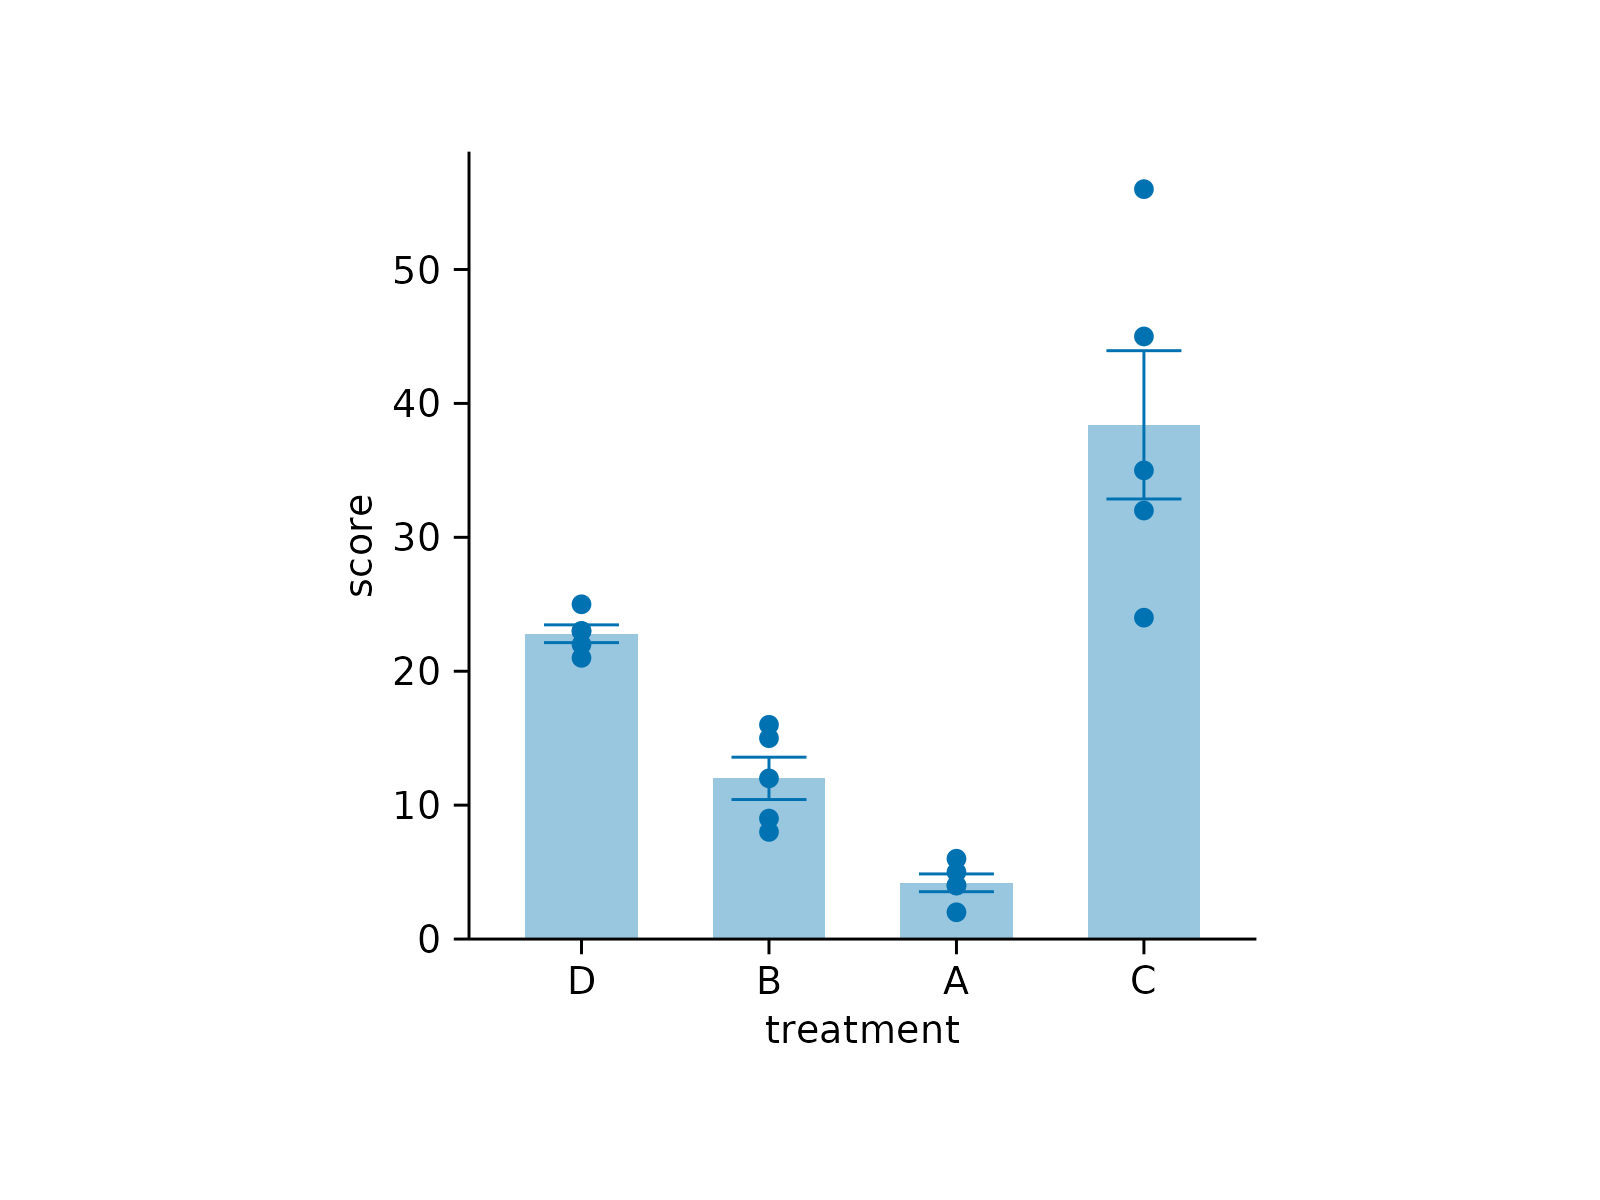
 # Reorder x-axis levels
study |>
tidyplot(x = treatment, y = score) |>
add_data_points() |>
add_mean_bar(alpha = 0.4) |>
add_sem_errorbar() |>
reorder_x_axis_levels("D", "B", "A")
# Reorder x-axis levels
study |>
tidyplot(x = treatment, y = score) |>
add_data_points() |>
add_mean_bar(alpha = 0.4) |>
add_sem_errorbar() |>
reorder_x_axis_levels("D", "B", "A")
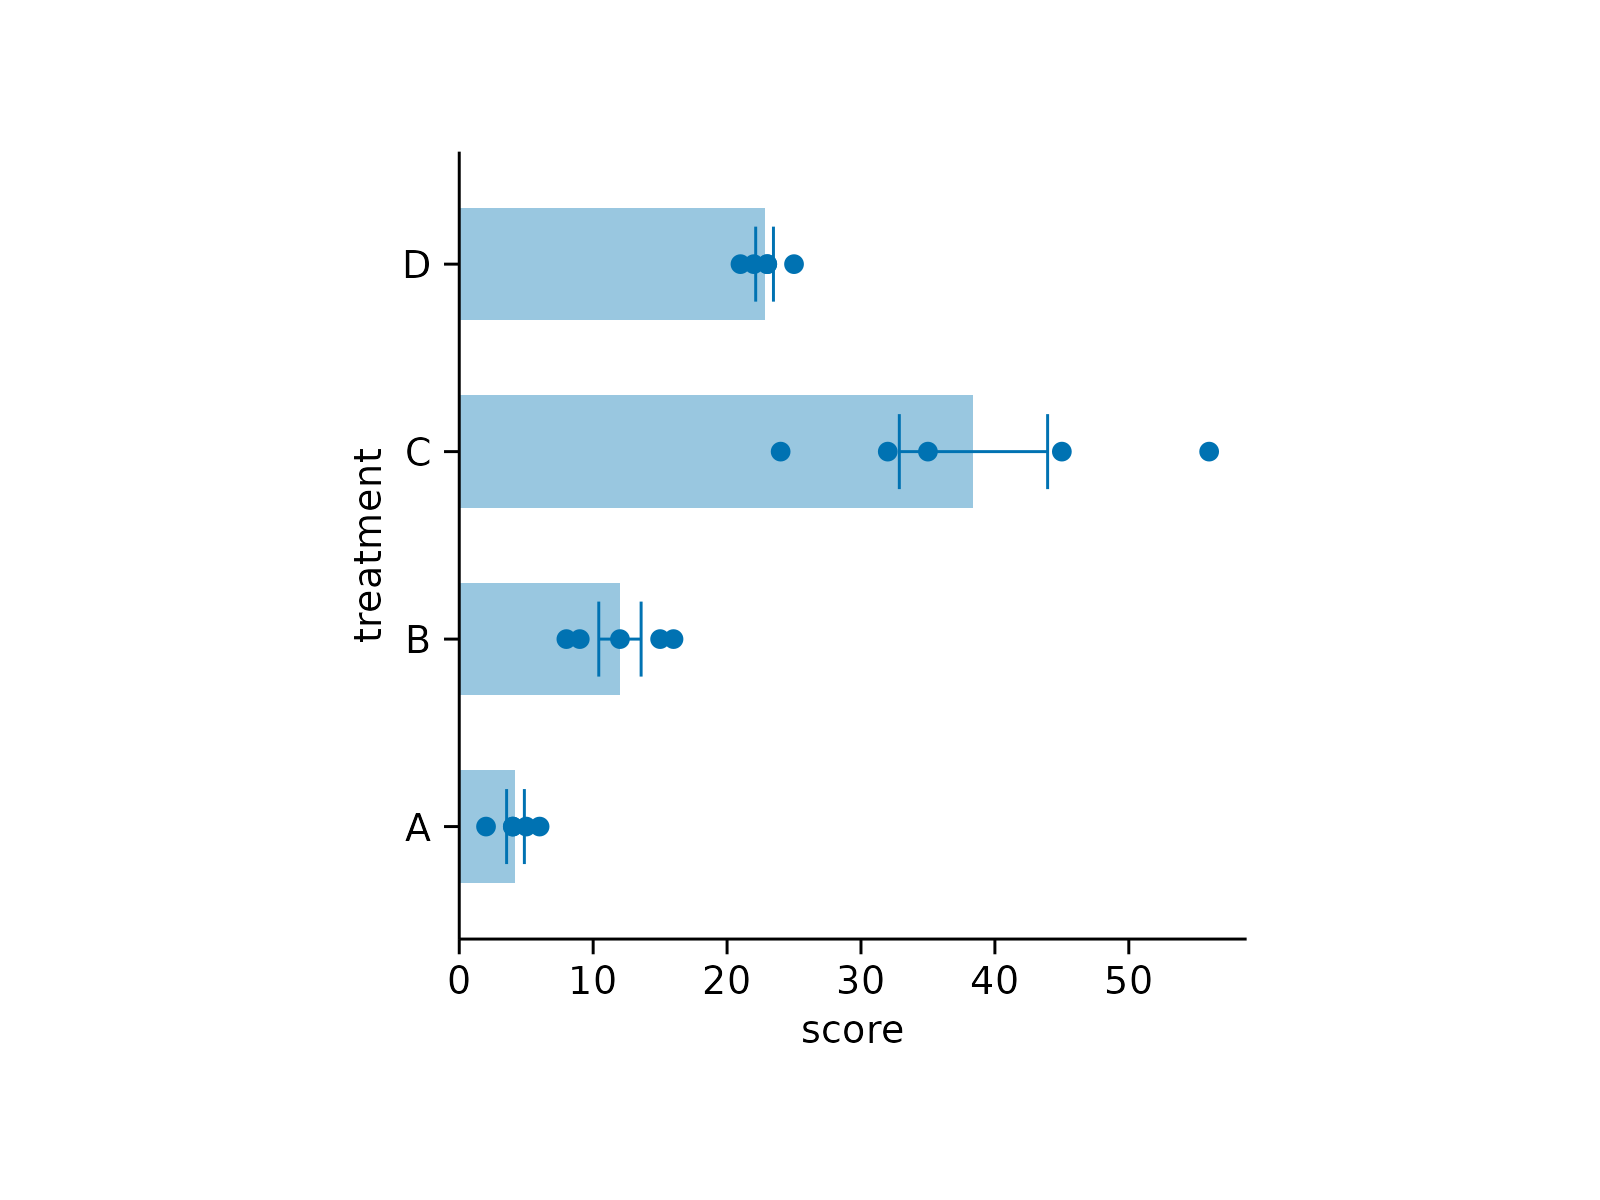
 # Before adjustments
study |>
tidyplot(x = score, y = treatment) |>
add_data_points() |>
add_mean_bar(alpha = 0.4) |>
add_sem_errorbar()
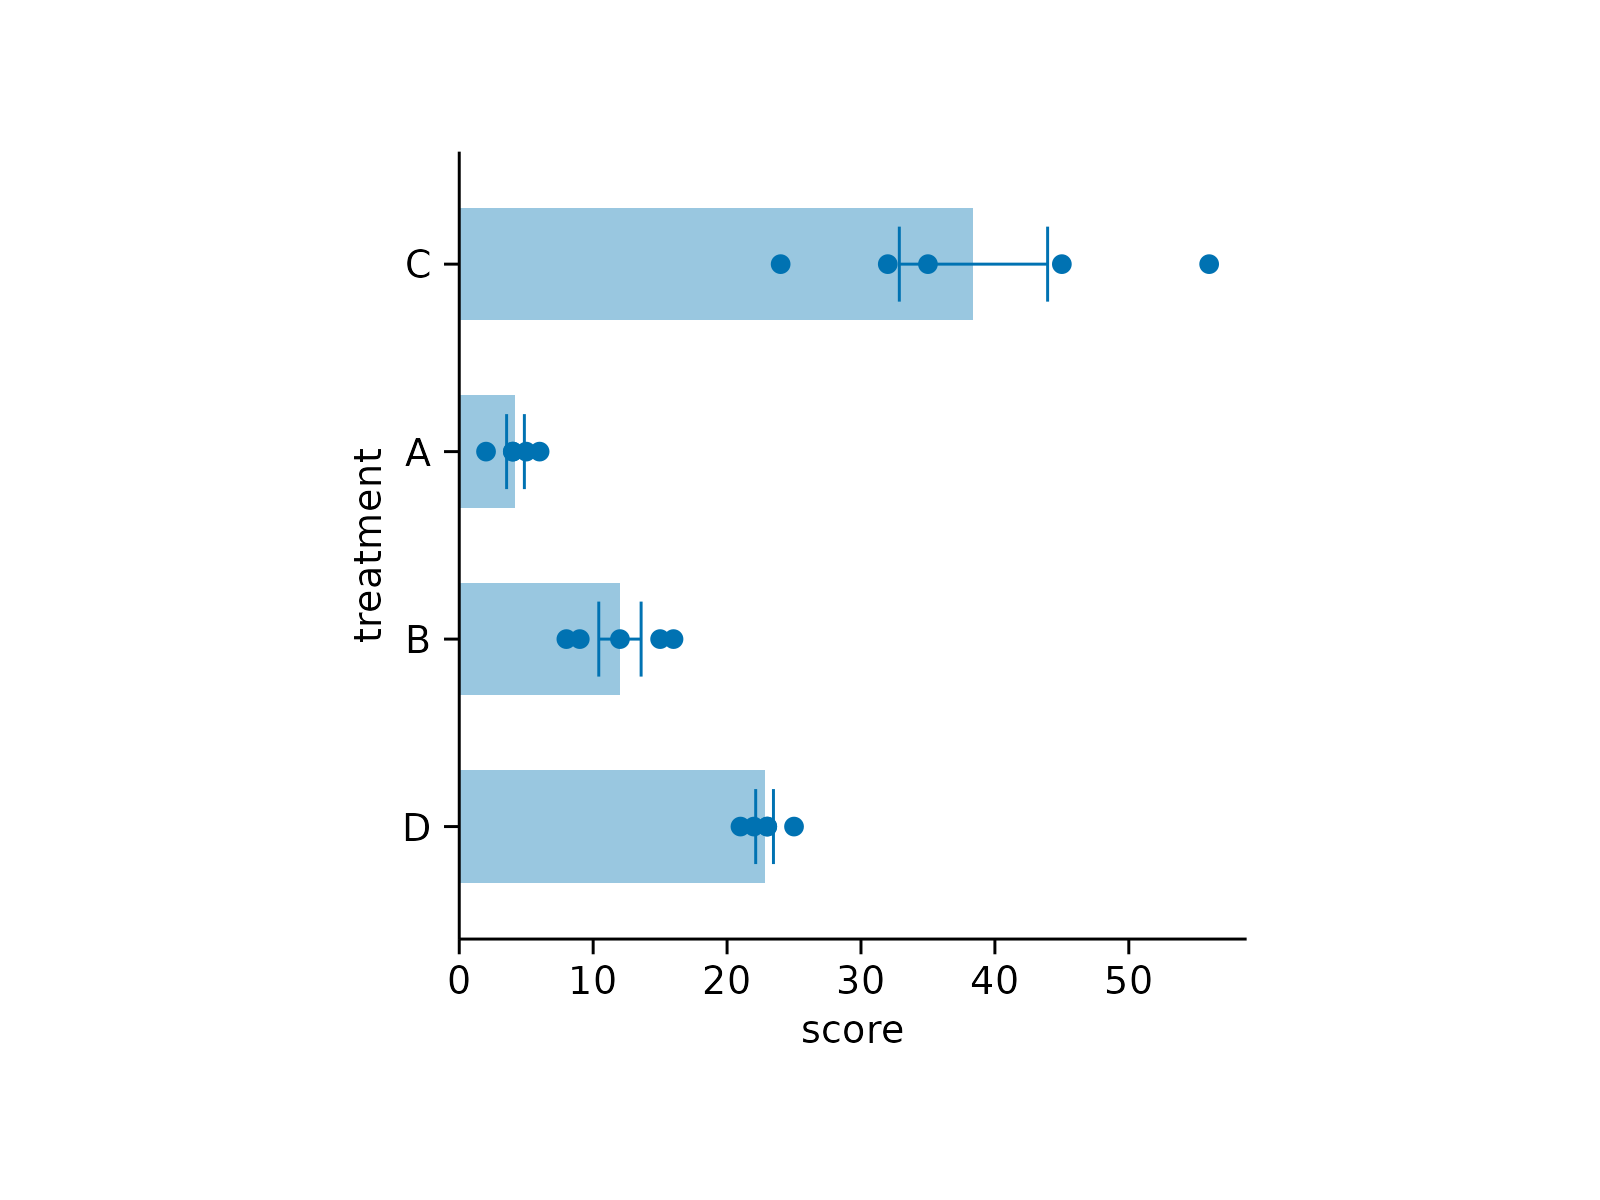
# Before adjustments
study |>
tidyplot(x = score, y = treatment) |>
add_data_points() |>
add_mean_bar(alpha = 0.4) |>
add_sem_errorbar()
 # Reorder y-axis levels
study |>
tidyplot(x = score, y = treatment) |>
add_data_points() |>
add_mean_bar(alpha = 0.4) |>
add_sem_errorbar() |>
reorder_y_axis_levels("D", "B", "A")
# Reorder y-axis levels
study |>
tidyplot(x = score, y = treatment) |>
add_data_points() |>
add_mean_bar(alpha = 0.4) |>
add_sem_errorbar() |>
reorder_y_axis_levels("D", "B", "A")
 # Before adjustment
study |>
tidyplot(x = group, y = score, color = dose) |>
add_data_points() |>
add_mean_bar(alpha = 0.4) |>
add_sem_errorbar()
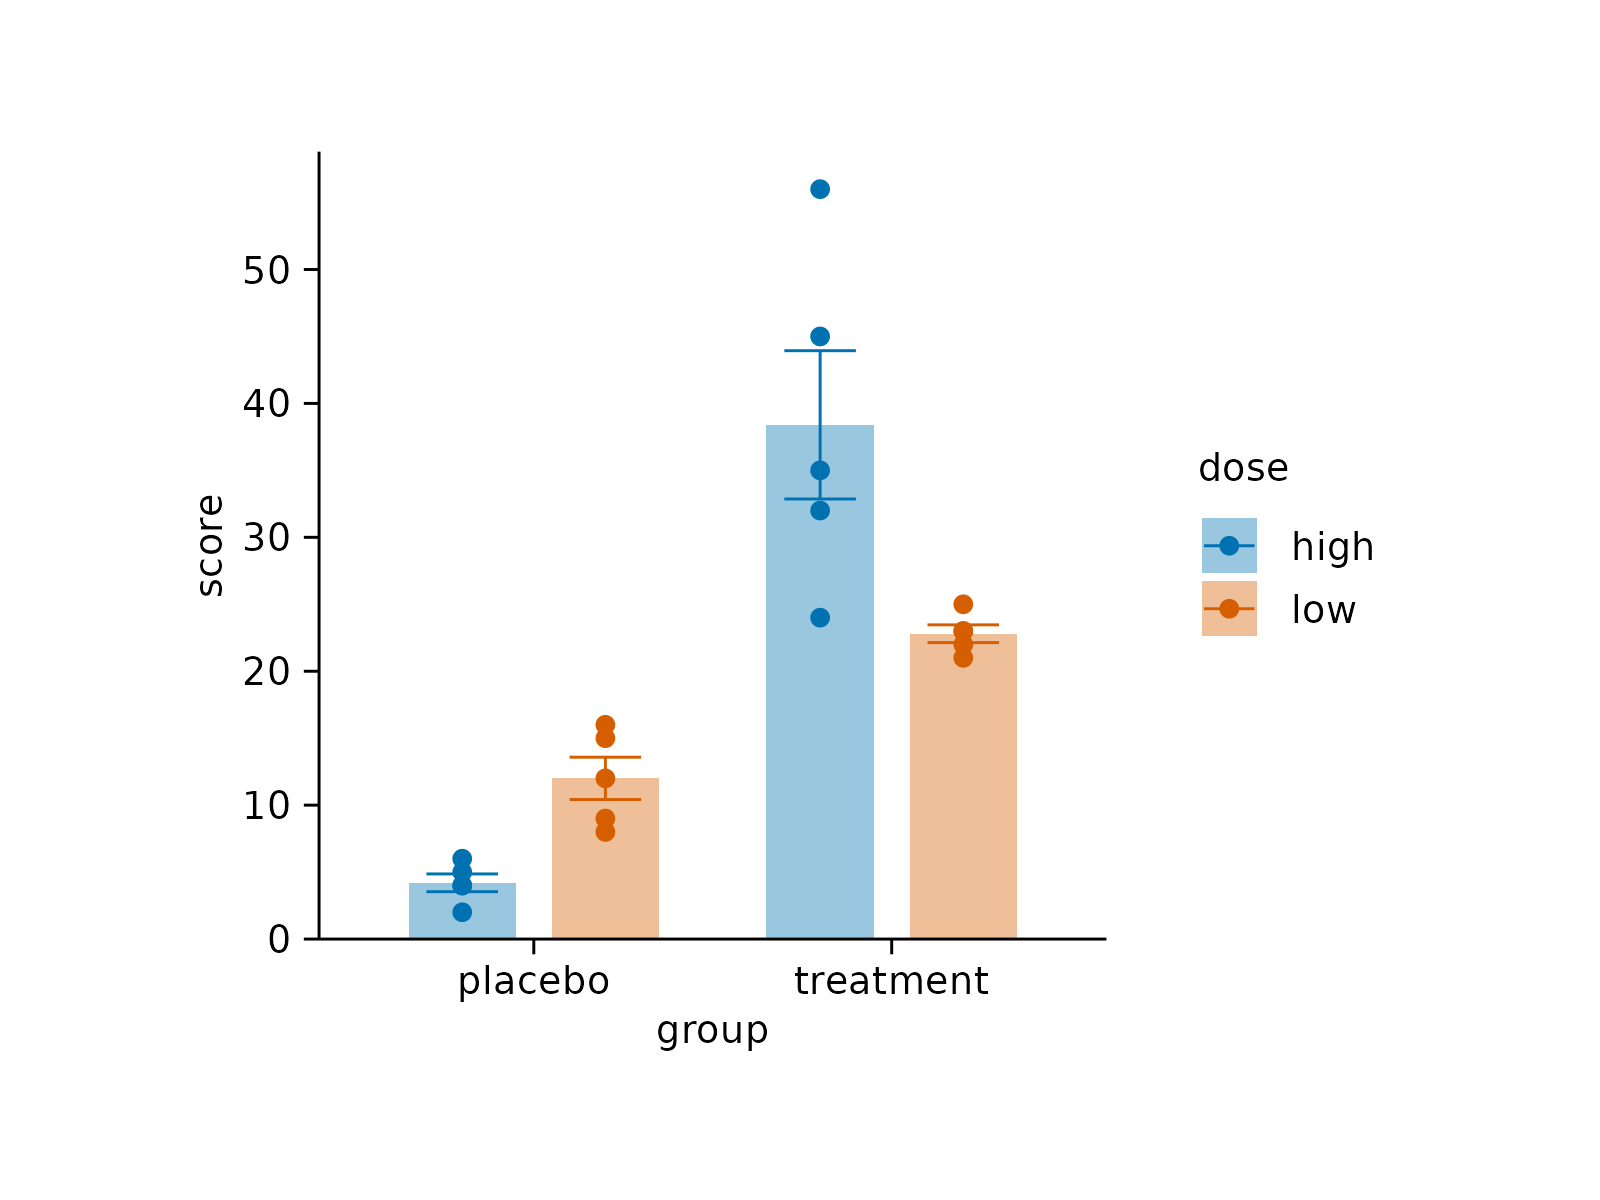
# Before adjustment
study |>
tidyplot(x = group, y = score, color = dose) |>
add_data_points() |>
add_mean_bar(alpha = 0.4) |>
add_sem_errorbar()
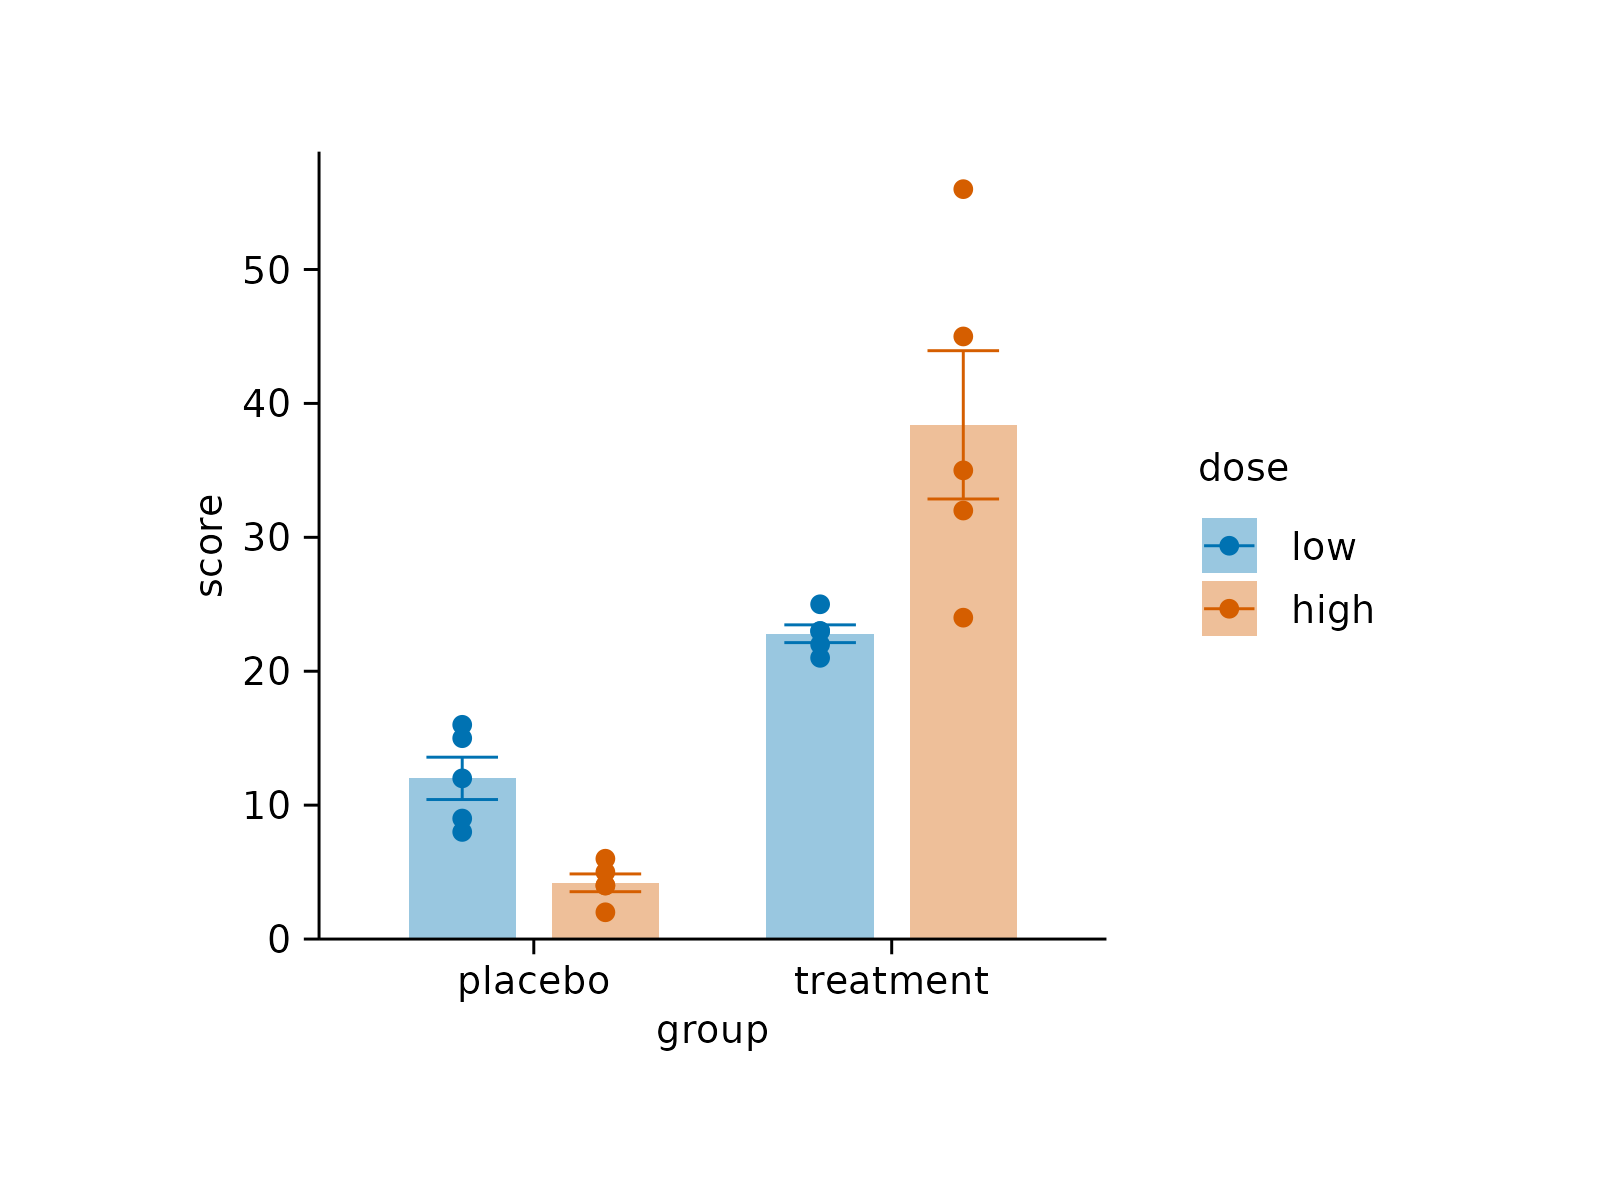
 # Reorder color levels
study |>
tidyplot(x = group, y = score, color = dose) |>
add_data_points() |>
add_mean_bar(alpha = 0.4) |>
add_sem_errorbar() |>
reorder_color_levels("low")
# Reorder color levels
study |>
tidyplot(x = group, y = score, color = dose) |>
add_data_points() |>
add_mean_bar(alpha = 0.4) |>
add_sem_errorbar() |>
reorder_color_levels("low")