Adjust legend
Usage
adjust_legend(plot, title = ggplot2::waiver(), position = "right")Arguments
- plot
A
tidyplotgenerated with the functiontidyplot().- title
Legend title.
- position
The position of the legend. Can be one of
c("right", "left", "bottom", "top", "none"). Defaults to"right".
Details
The
titleargument ofadjust_legend()supports plotmath expressions to include special characters. See examples and Advanced plotting.
Examples
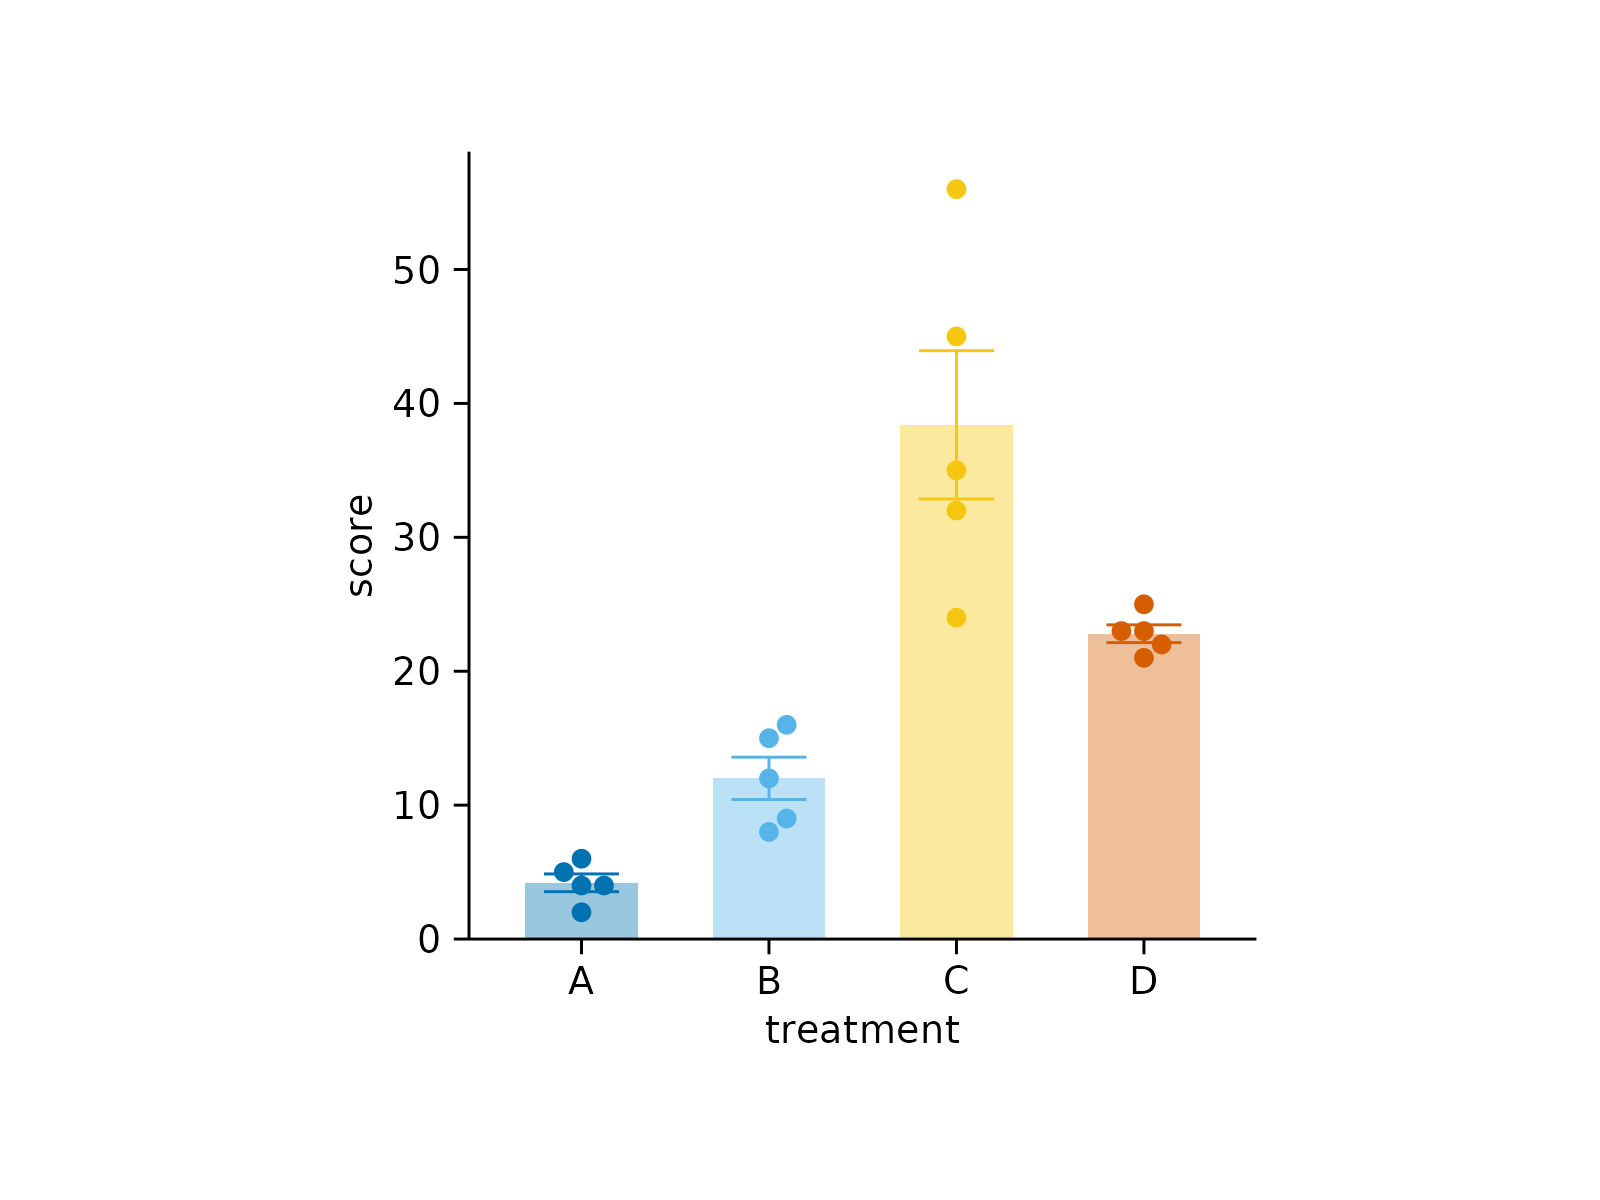
# Plot without adjustments
study %>%
tidyplot(x = treatment, y = score, color = treatment) %>%
add_data_points_beeswarm() %>%
add_mean_bar(alpha = 0.4) %>%
add_sem_errorbar()
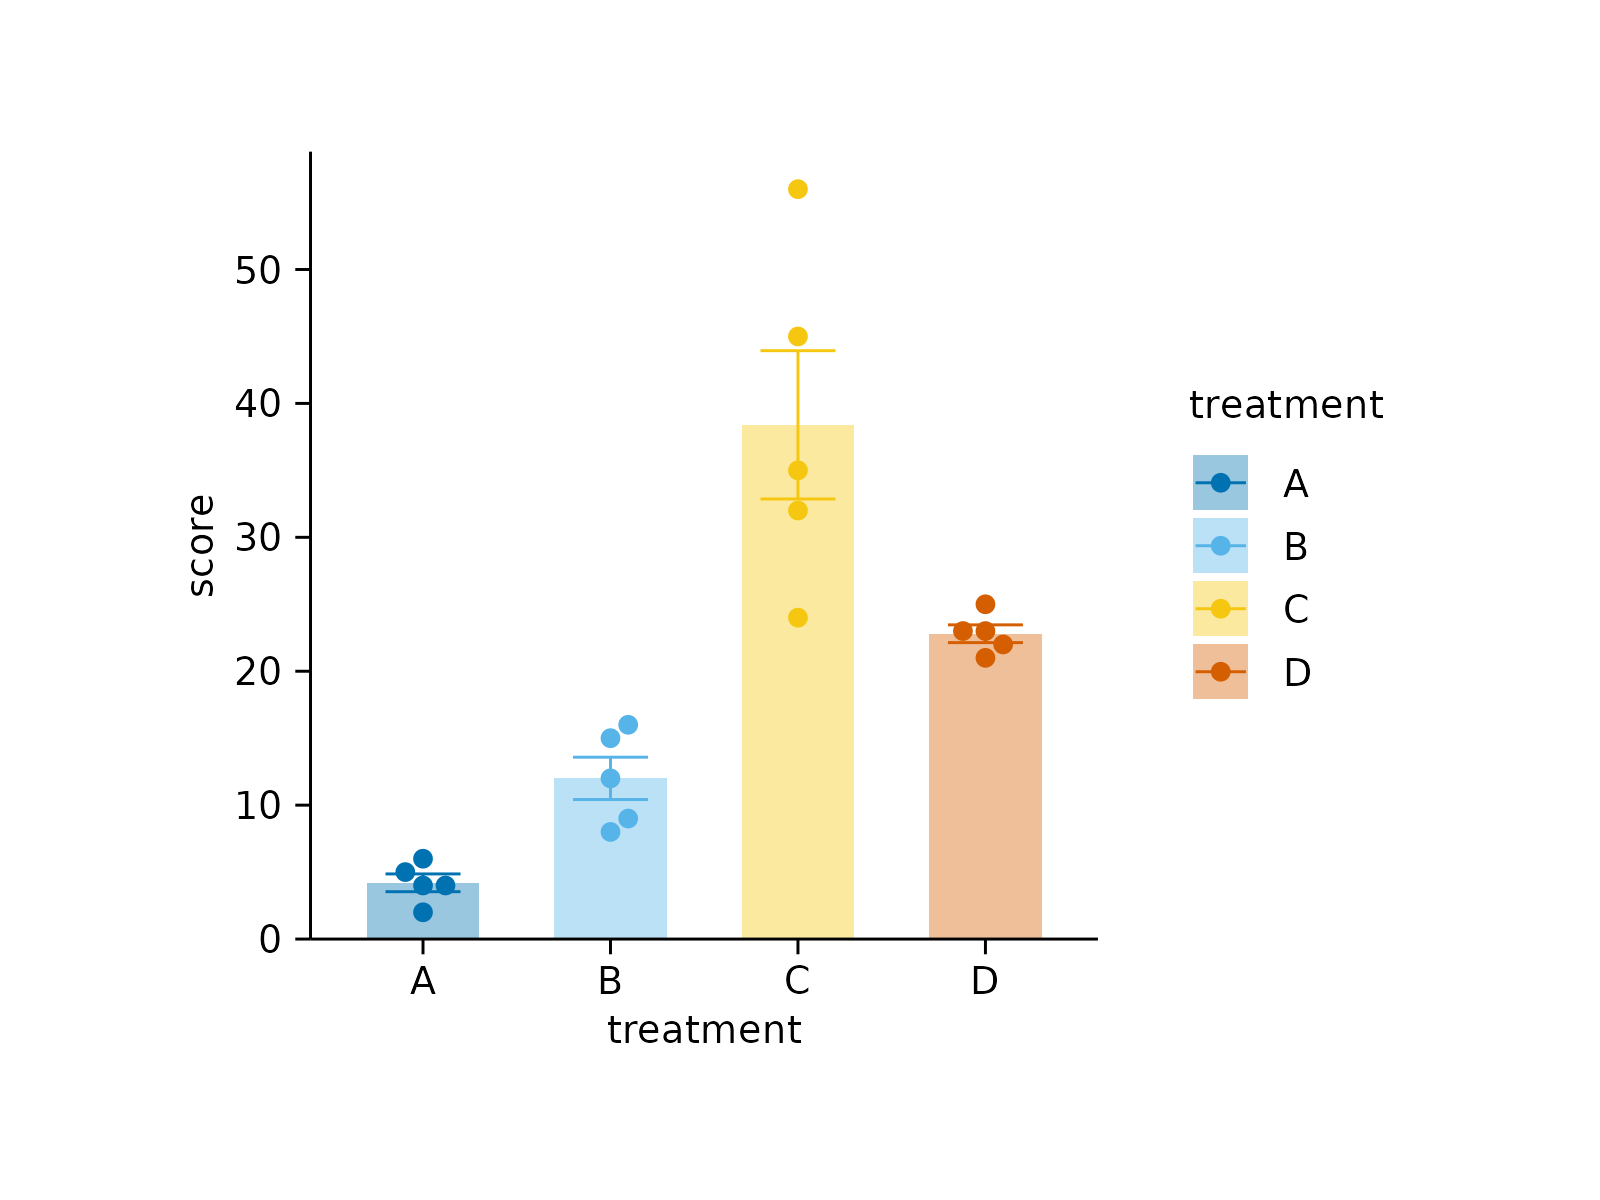 # New title
study %>%
tidyplot(x = treatment, y = score, color = treatment) %>%
add_data_points_beeswarm() %>%
add_mean_bar(alpha = 0.4) %>%
add_sem_errorbar() %>%
adjust_legend(title = "My new legend title")
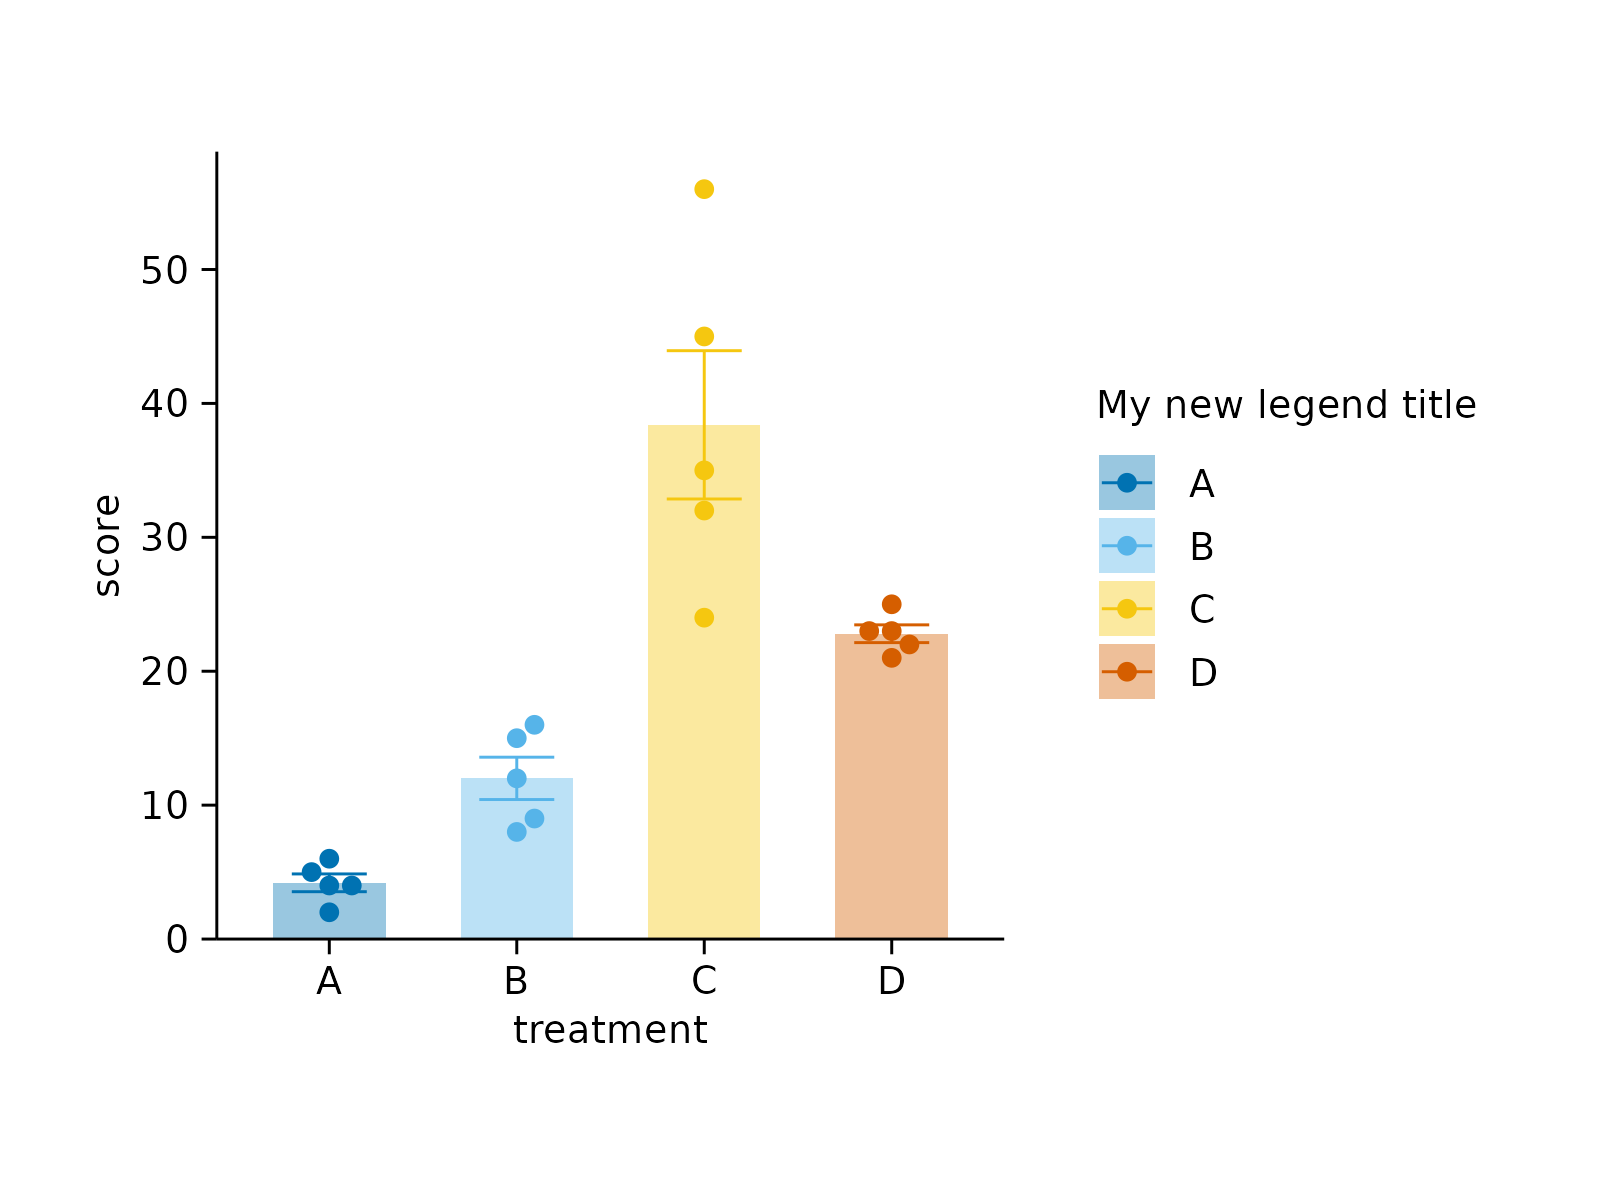
# New title
study %>%
tidyplot(x = treatment, y = score, color = treatment) %>%
add_data_points_beeswarm() %>%
add_mean_bar(alpha = 0.4) %>%
add_sem_errorbar() %>%
adjust_legend(title = "My new legend title")
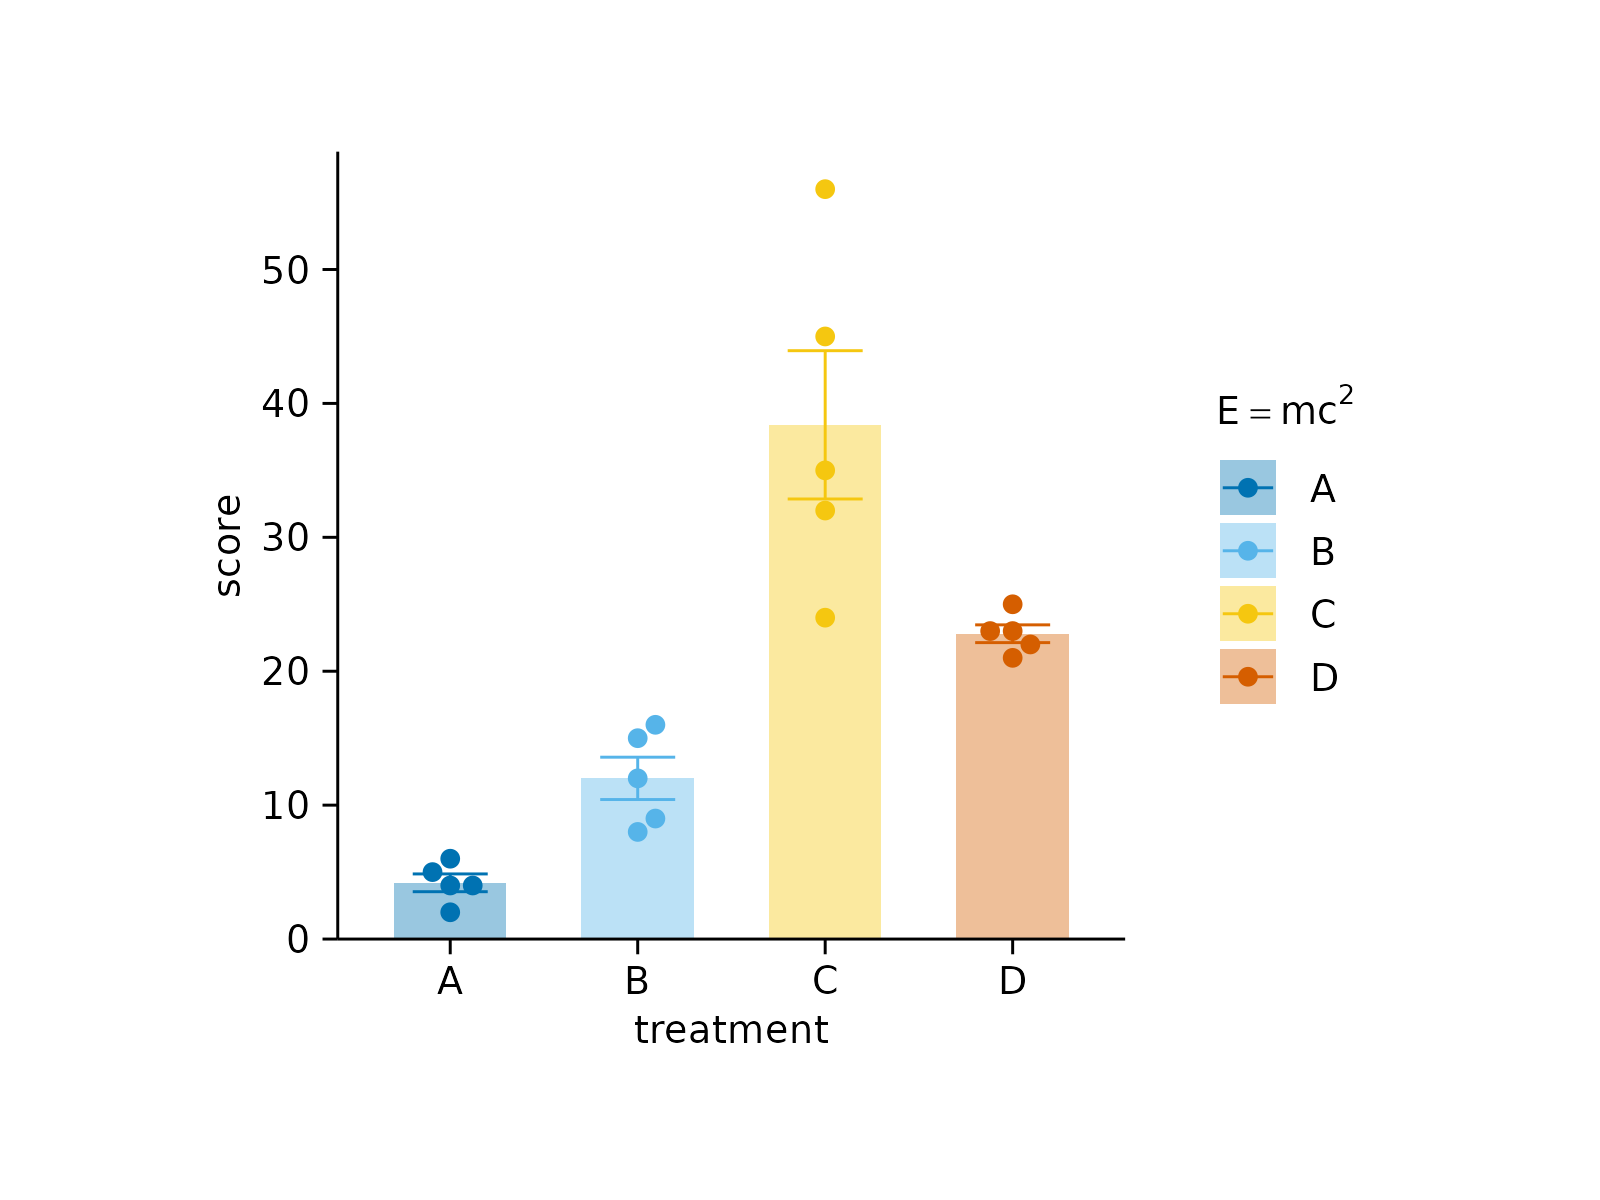
 # New title with plotmath expression
study %>%
tidyplot(x = treatment, y = score, color = treatment) %>%
add_data_points_beeswarm() %>%
add_mean_bar(alpha = 0.4) %>%
add_sem_errorbar() %>%
adjust_legend(title = "$E==m*c^{2}$")
# New title with plotmath expression
study %>%
tidyplot(x = treatment, y = score, color = treatment) %>%
add_data_points_beeswarm() %>%
add_mean_bar(alpha = 0.4) %>%
add_sem_errorbar() %>%
adjust_legend(title = "$E==m*c^{2}$")
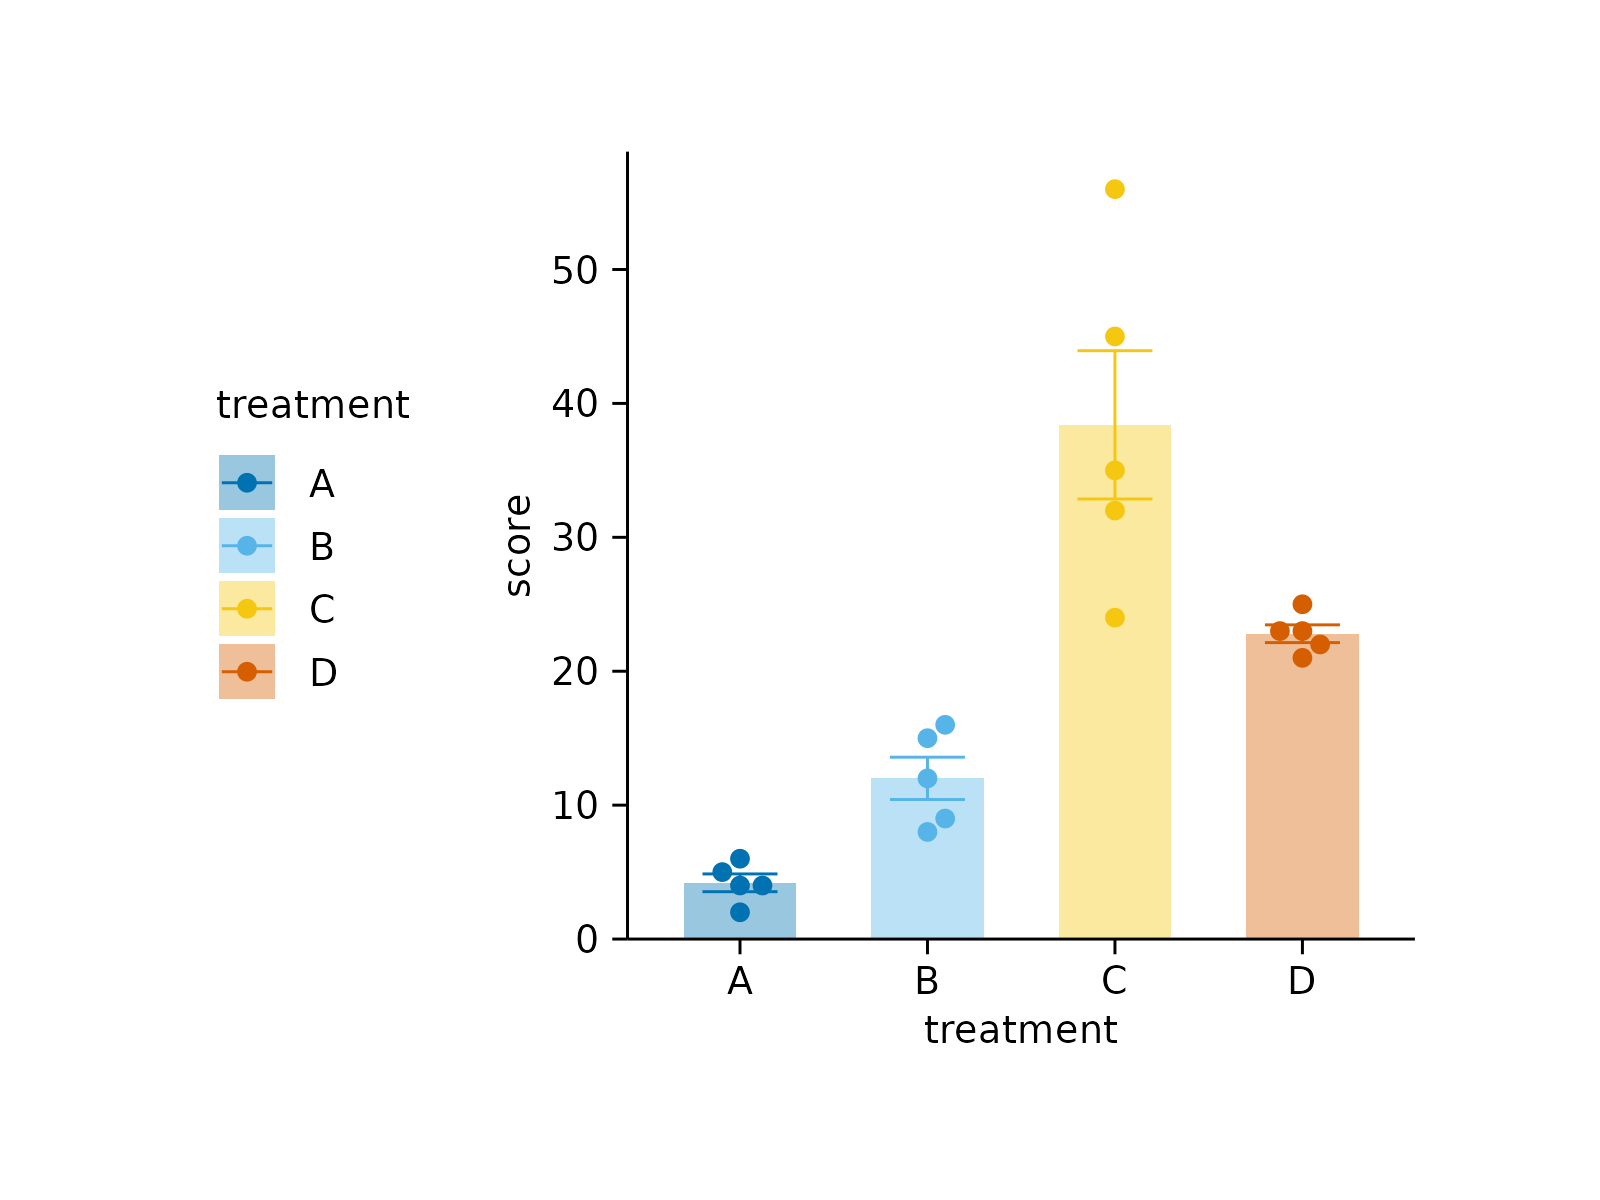
 # Alternative legend positions
study %>%
tidyplot(x = treatment, y = score, color = treatment) %>%
add_data_points_beeswarm() %>%
add_mean_bar(alpha = 0.4) %>%
add_sem_errorbar() %>%
adjust_legend(position = "left")
# Alternative legend positions
study %>%
tidyplot(x = treatment, y = score, color = treatment) %>%
add_data_points_beeswarm() %>%
add_mean_bar(alpha = 0.4) %>%
add_sem_errorbar() %>%
adjust_legend(position = "left")
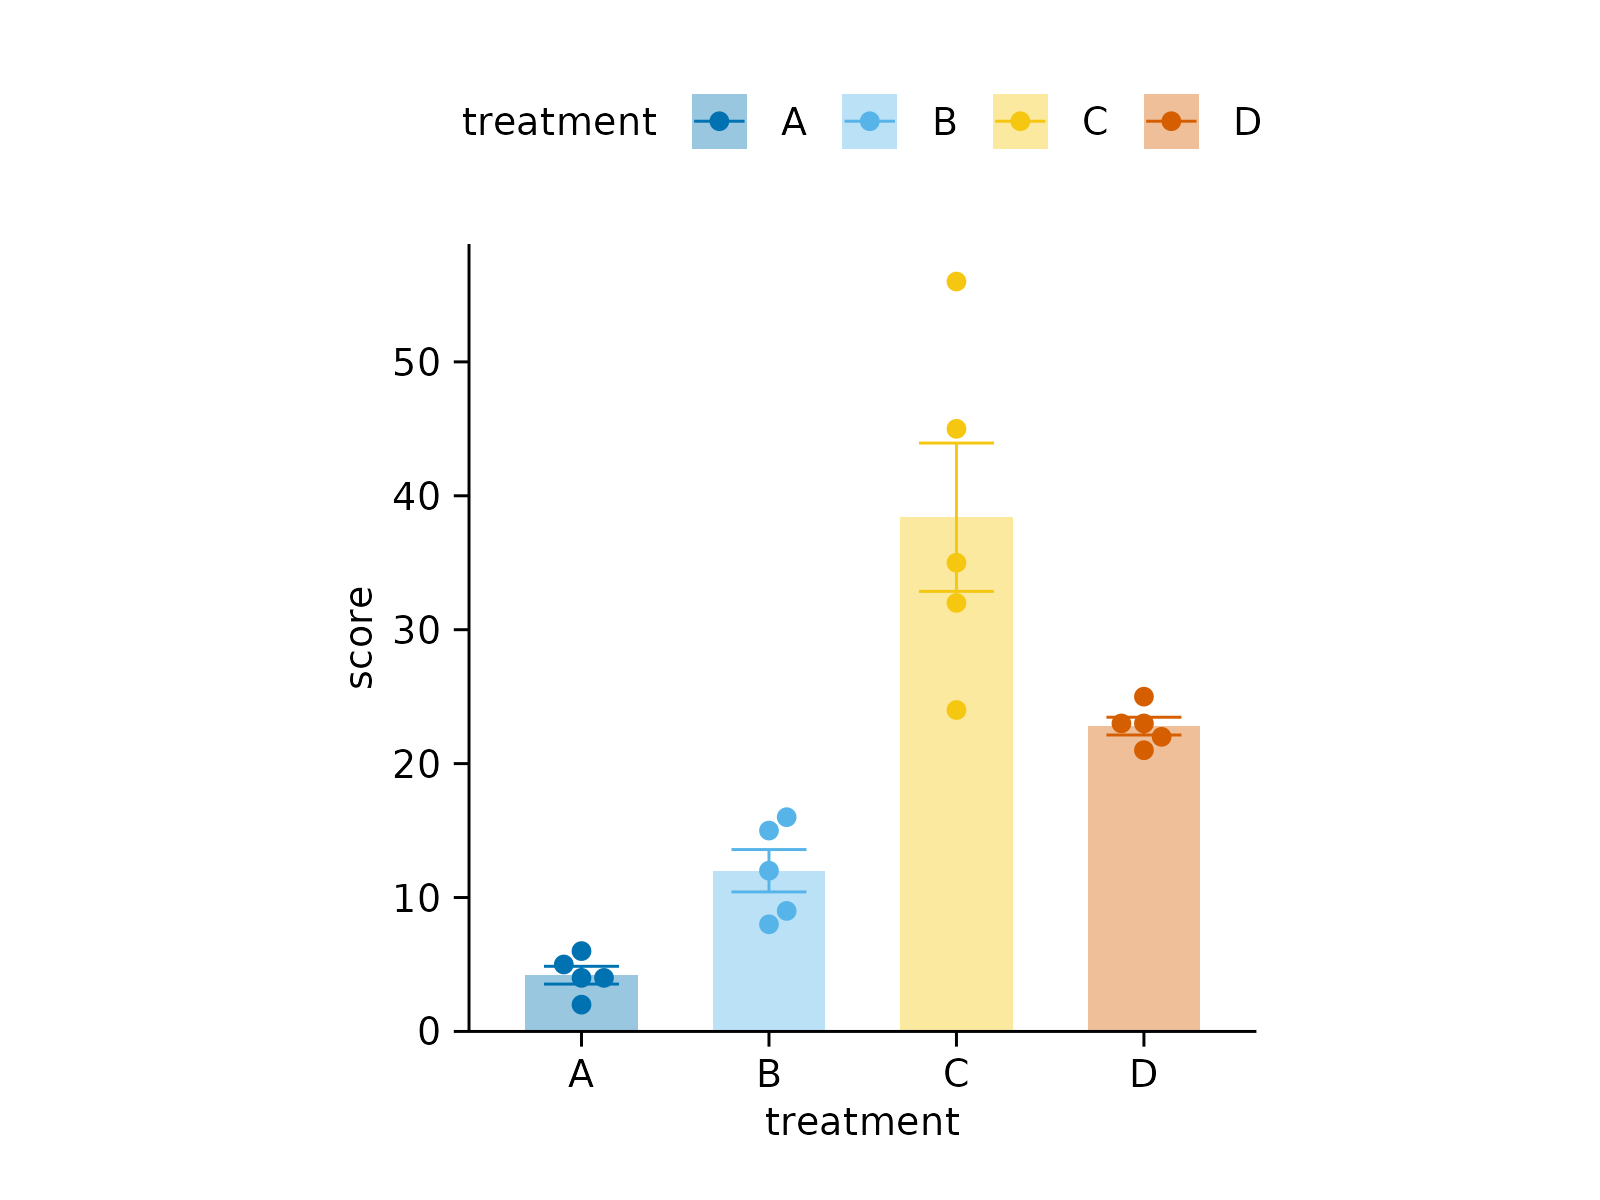
 study %>%
tidyplot(x = treatment, y = score, color = treatment) %>%
add_data_points_beeswarm() %>%
add_mean_bar(alpha = 0.4) %>%
add_sem_errorbar() %>%
adjust_legend(position = "top")
study %>%
tidyplot(x = treatment, y = score, color = treatment) %>%
add_data_points_beeswarm() %>%
add_mean_bar(alpha = 0.4) %>%
add_sem_errorbar() %>%
adjust_legend(position = "top")
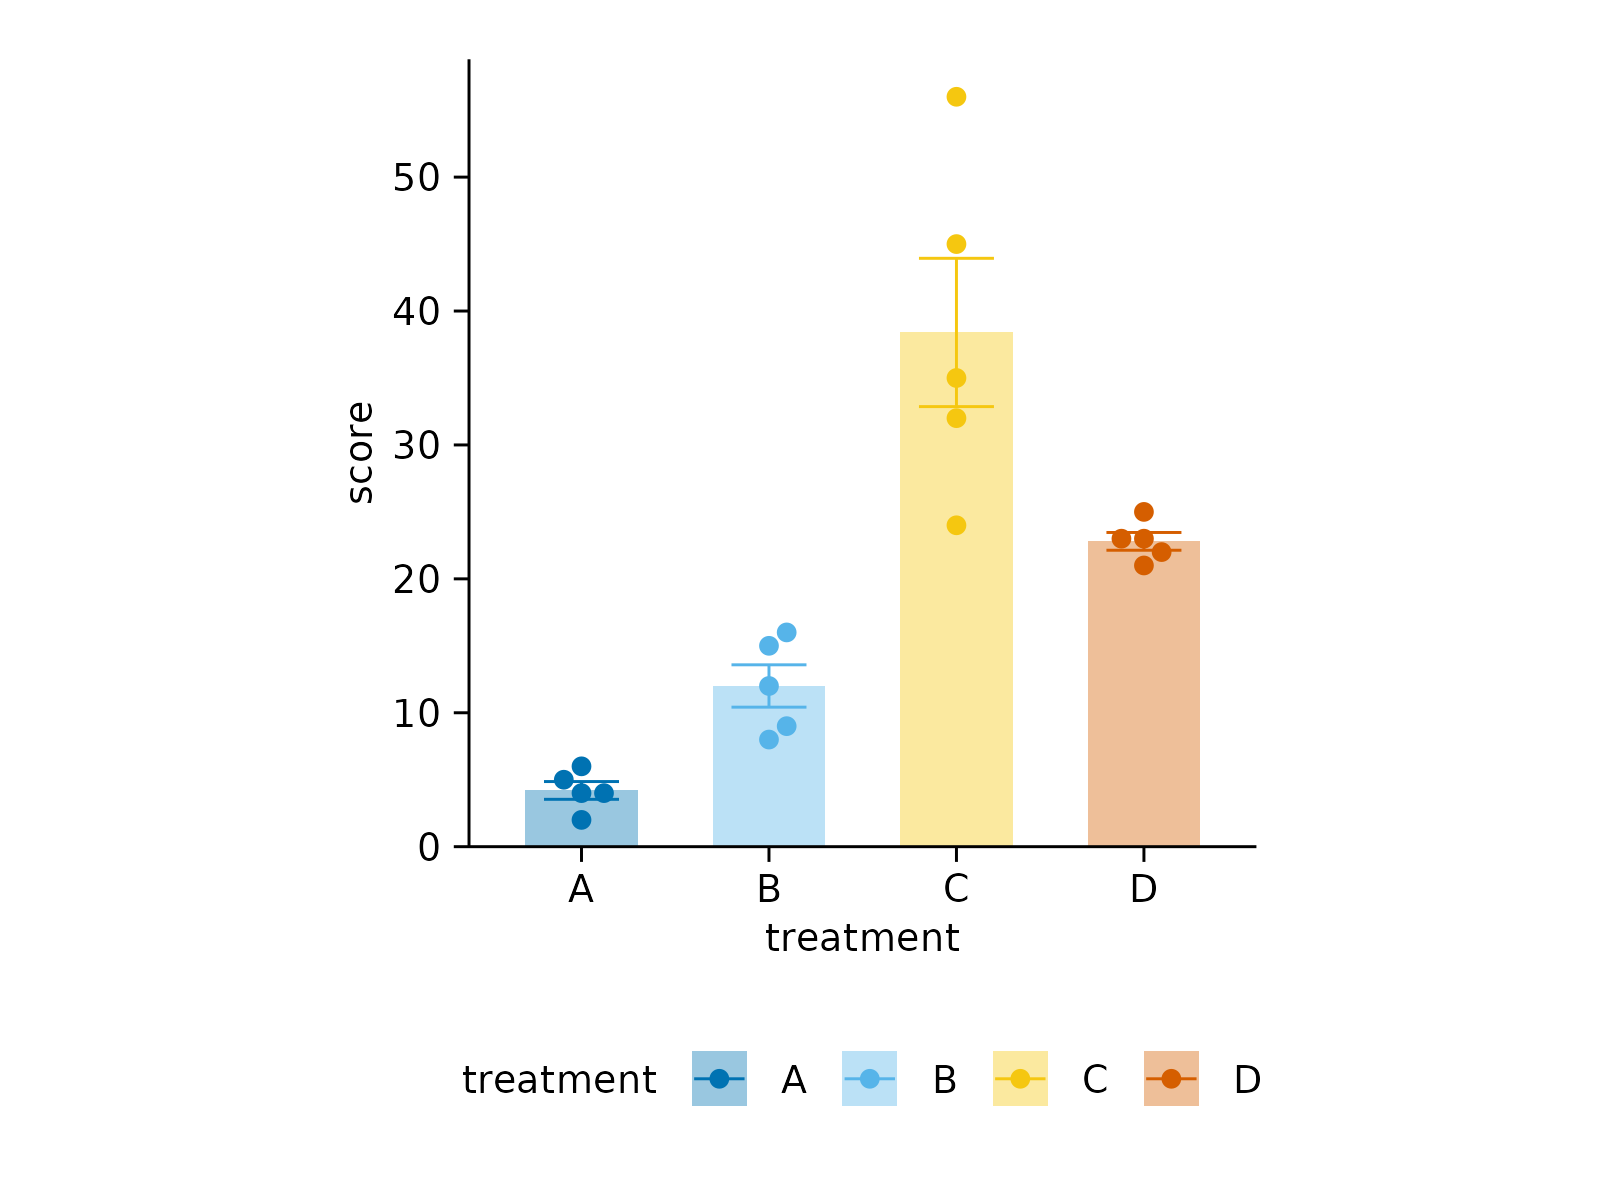
 study %>%
tidyplot(x = treatment, y = score, color = treatment) %>%
add_data_points_beeswarm() %>%
add_mean_bar(alpha = 0.4) %>%
add_sem_errorbar() %>%
adjust_legend(position = "bottom")
study %>%
tidyplot(x = treatment, y = score, color = treatment) %>%
add_data_points_beeswarm() %>%
add_mean_bar(alpha = 0.4) %>%
add_sem_errorbar() %>%
adjust_legend(position = "bottom")
 # `position = "none"` hides the legend
study %>%
tidyplot(x = treatment, y = score, color = treatment) %>%
add_data_points_beeswarm() %>%
add_mean_bar(alpha = 0.4) %>%
add_sem_errorbar() %>%
adjust_legend(position = "none")
# `position = "none"` hides the legend
study %>%
tidyplot(x = treatment, y = score, color = treatment) %>%
add_data_points_beeswarm() %>%
add_mean_bar(alpha = 0.4) %>%
add_sem_errorbar() %>%
adjust_legend(position = "none")