Adjust description
Arguments
- plot
A
tidyplotgenerated with the functiontidyplot().- title
Plot title.
- x_axis_title
X axis title.
- y_axis_title
Y axis title.
- legend_title
Legend title.
- caption
Plot caption text.
- ...
Arguments passed on to
ggplot2::labs().
Details
adjust_description()supports plotmath expressions to include special characters. See examples and Advanced plotting.
Examples
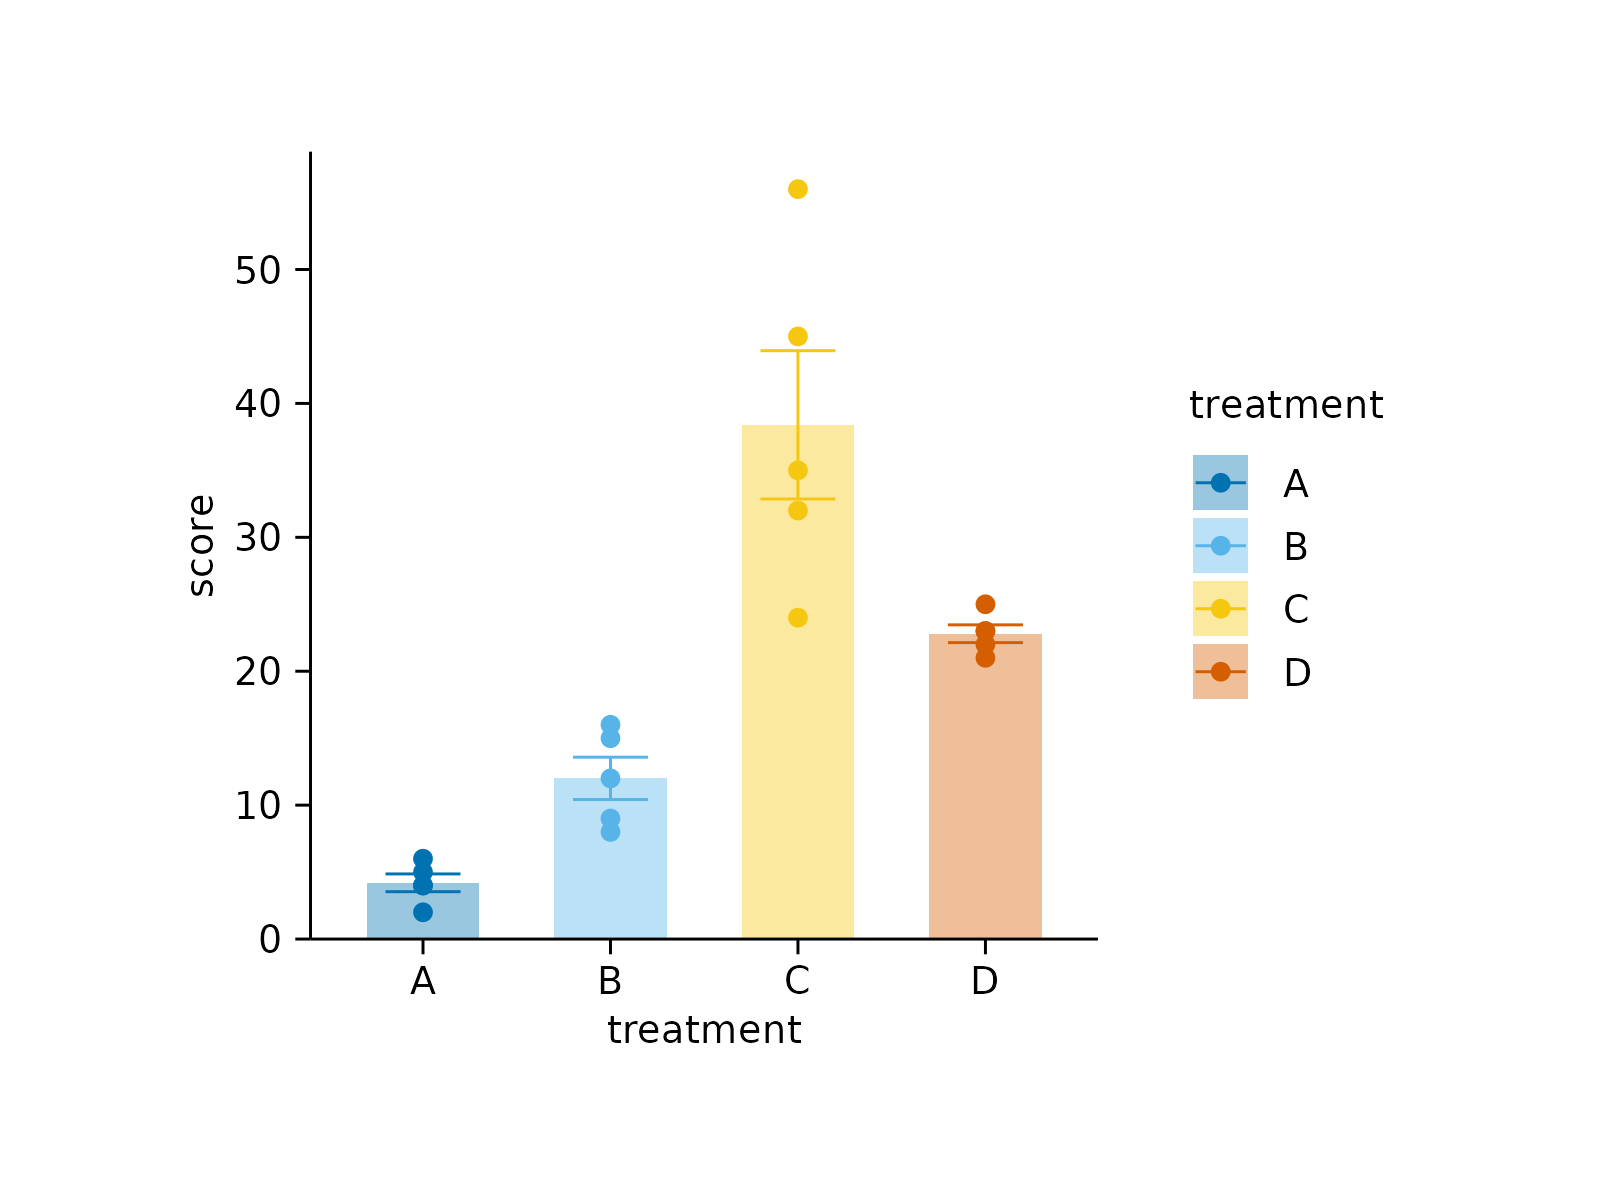
# Plot without adjustments
study %>%
tidyplot(x = treatment, y = score, color = treatment) %>%
add_data_points() %>%
add_mean_bar(alpha = 0.4) %>%
add_sem_errorbar()
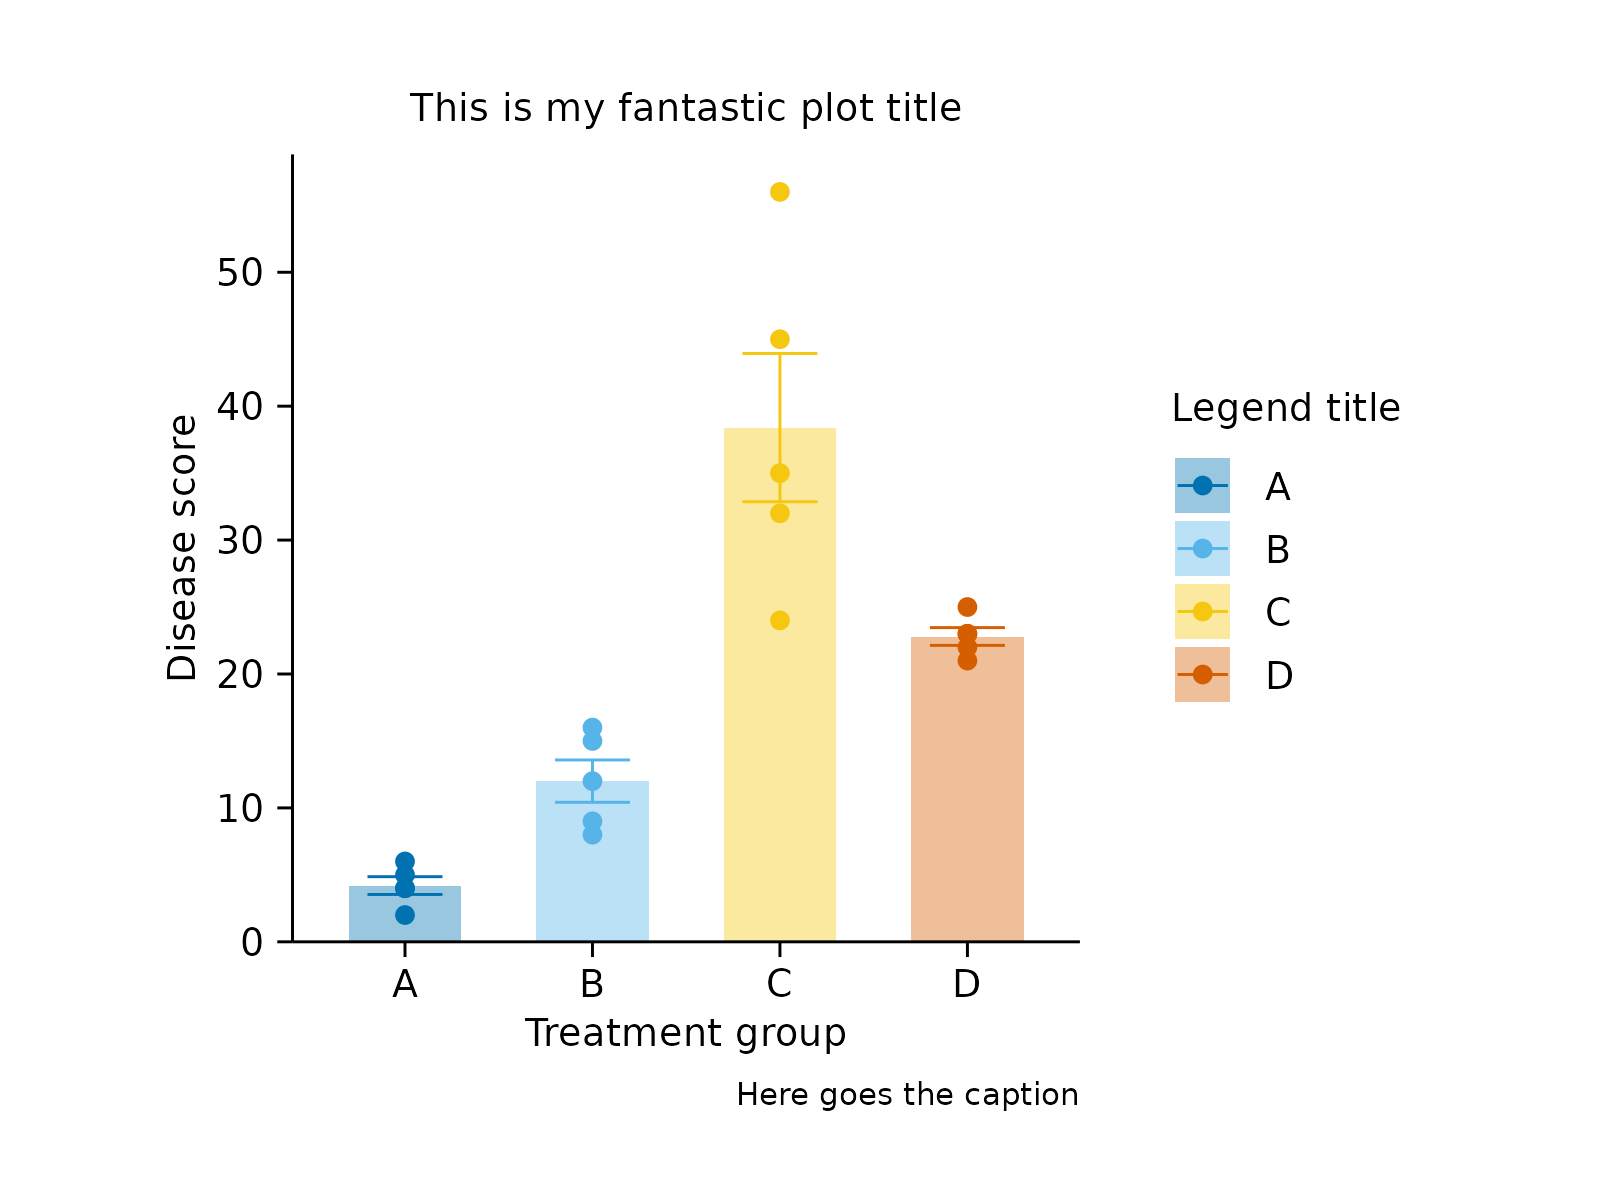
 # Adjust description
study %>%
tidyplot(x = treatment, y = score, color = treatment) %>%
add_data_points() %>%
add_mean_bar(alpha = 0.4) %>%
add_sem_errorbar() %>%
adjust_description(
title = "This is my fantastic plot title",
x_axis_title = "Treatment group",
y_axis_title = "Disease score",
legend_title = "Legend title",
caption = "Here goes the caption")
# Adjust description
study %>%
tidyplot(x = treatment, y = score, color = treatment) %>%
add_data_points() %>%
add_mean_bar(alpha = 0.4) %>%
add_sem_errorbar() %>%
adjust_description(
title = "This is my fantastic plot title",
x_axis_title = "Treatment group",
y_axis_title = "Disease score",
legend_title = "Legend title",
caption = "Here goes the caption")
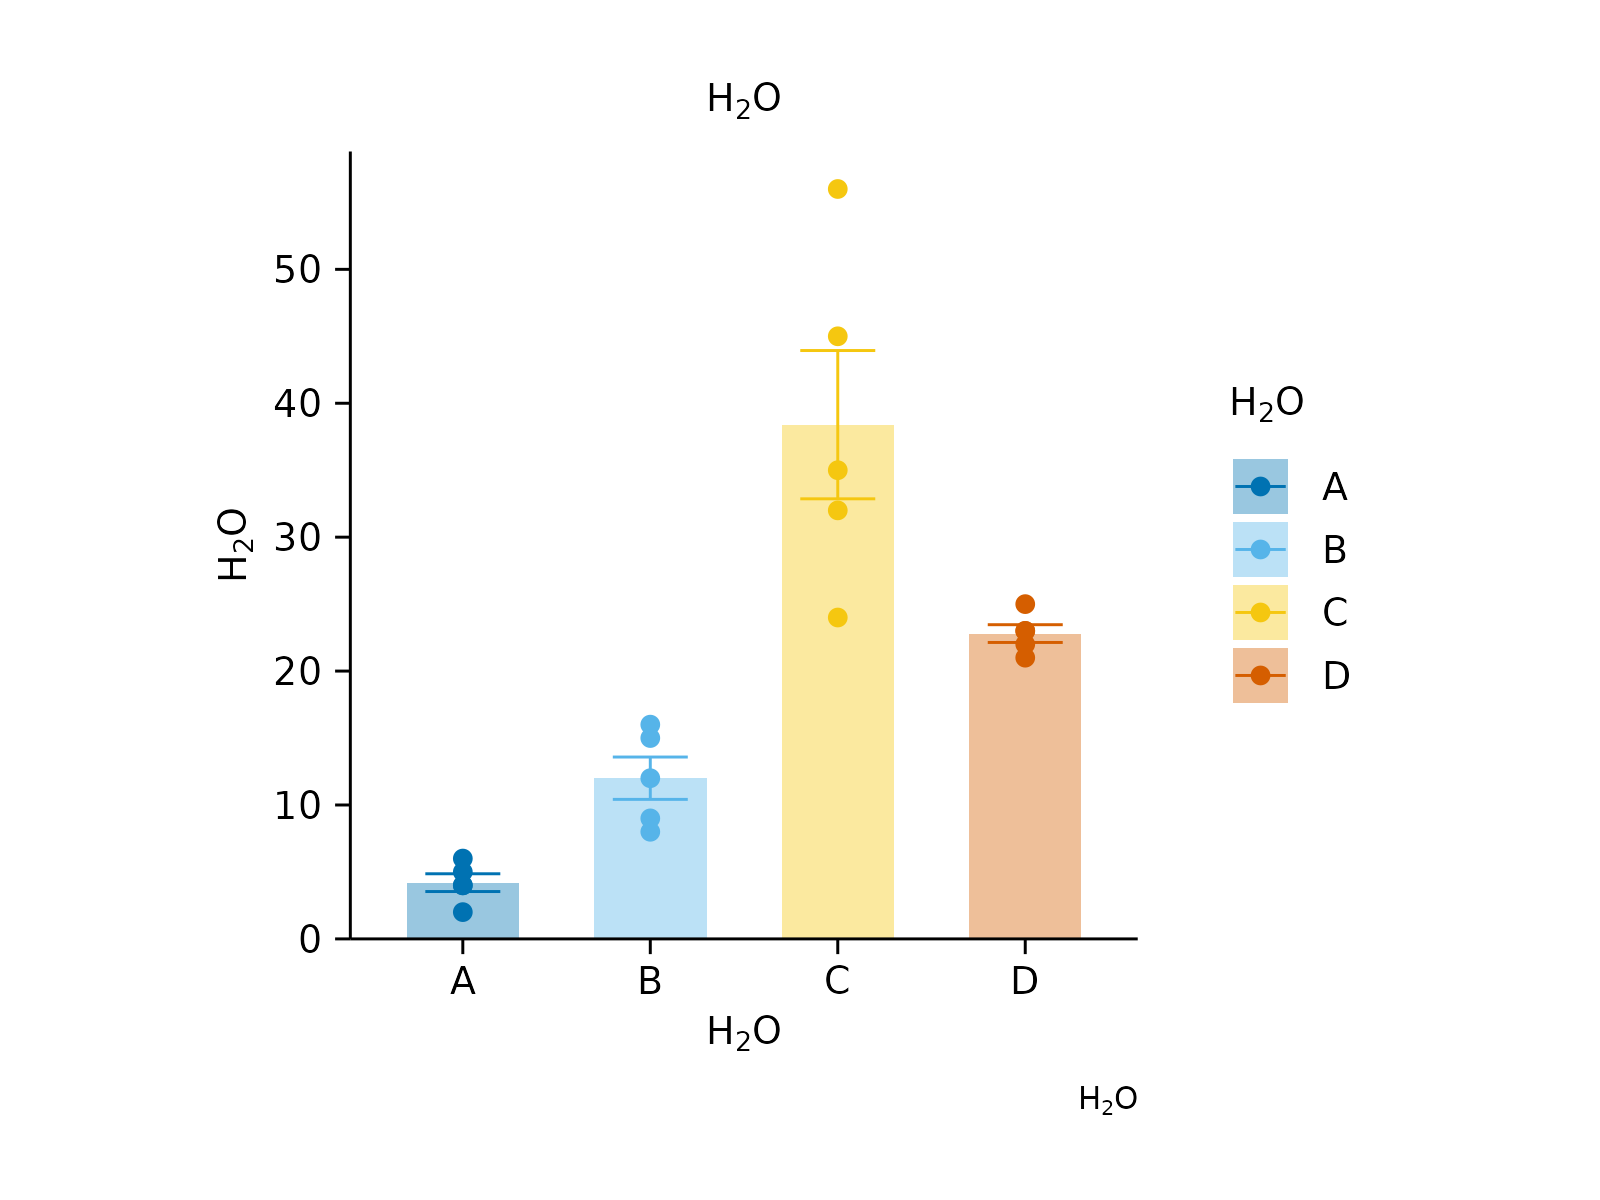
 # Plotmath expressions
study %>%
tidyplot(x = treatment, y = score, color = treatment) %>%
add_data_points() %>%
add_mean_bar(alpha = 0.4) %>%
add_sem_errorbar() %>%
adjust_description(
title = "$H[2]*O$",
x_axis_title = "$H[2]*O$",
y_axis_title = "$H[2]*O$",
legend_title = "$H[2]*O$",
caption = "$H[2]*O$")
# Plotmath expressions
study %>%
tidyplot(x = treatment, y = score, color = treatment) %>%
add_data_points() %>%
add_mean_bar(alpha = 0.4) %>%
add_sem_errorbar() %>%
adjust_description(
title = "$H[2]*O$",
x_axis_title = "$H[2]*O$",
y_axis_title = "$H[2]*O$",
legend_title = "$H[2]*O$",
caption = "$H[2]*O$")