add_line() and add_area() connect individual data points, which is rarely needed.
In most cases, you are probably looking for add_sum_line(), add_mean_line(), add_sum_area() or add_mean_area().
Usage
add_line(
  plot,
  group,
  dodge_width = NULL,
  linewidth = 0.25,
  preserve = "total",
  ...
)

add_area(
  plot,
  group,
  dodge_width = NULL,
  linewidth = 0.25,
  alpha = 0.4,
  preserve = "total",
  ...
)
Arguments
- plot
A
tidyplotgenerated with the functiontidyplot().- group
Variable in the dataset to be used for grouping.
- dodge_width
For adjusting the distance between grouped objects. Defaults to
0.8for plots with at least one discrete axis and0for plots with two continuous axes.- linewidth
Thickness of the line in points (pt). Typical values range between
0.25and1.- preserve
Should dodging preserve the
"total"width of all elements at a position, or the width of a"single"element?- ...
Arguments passed on to the
geomfunction.- alpha
A
numberbetween0and1for the opacity of an object. A value of0is completely transparent,1is completely opaque.
Examples
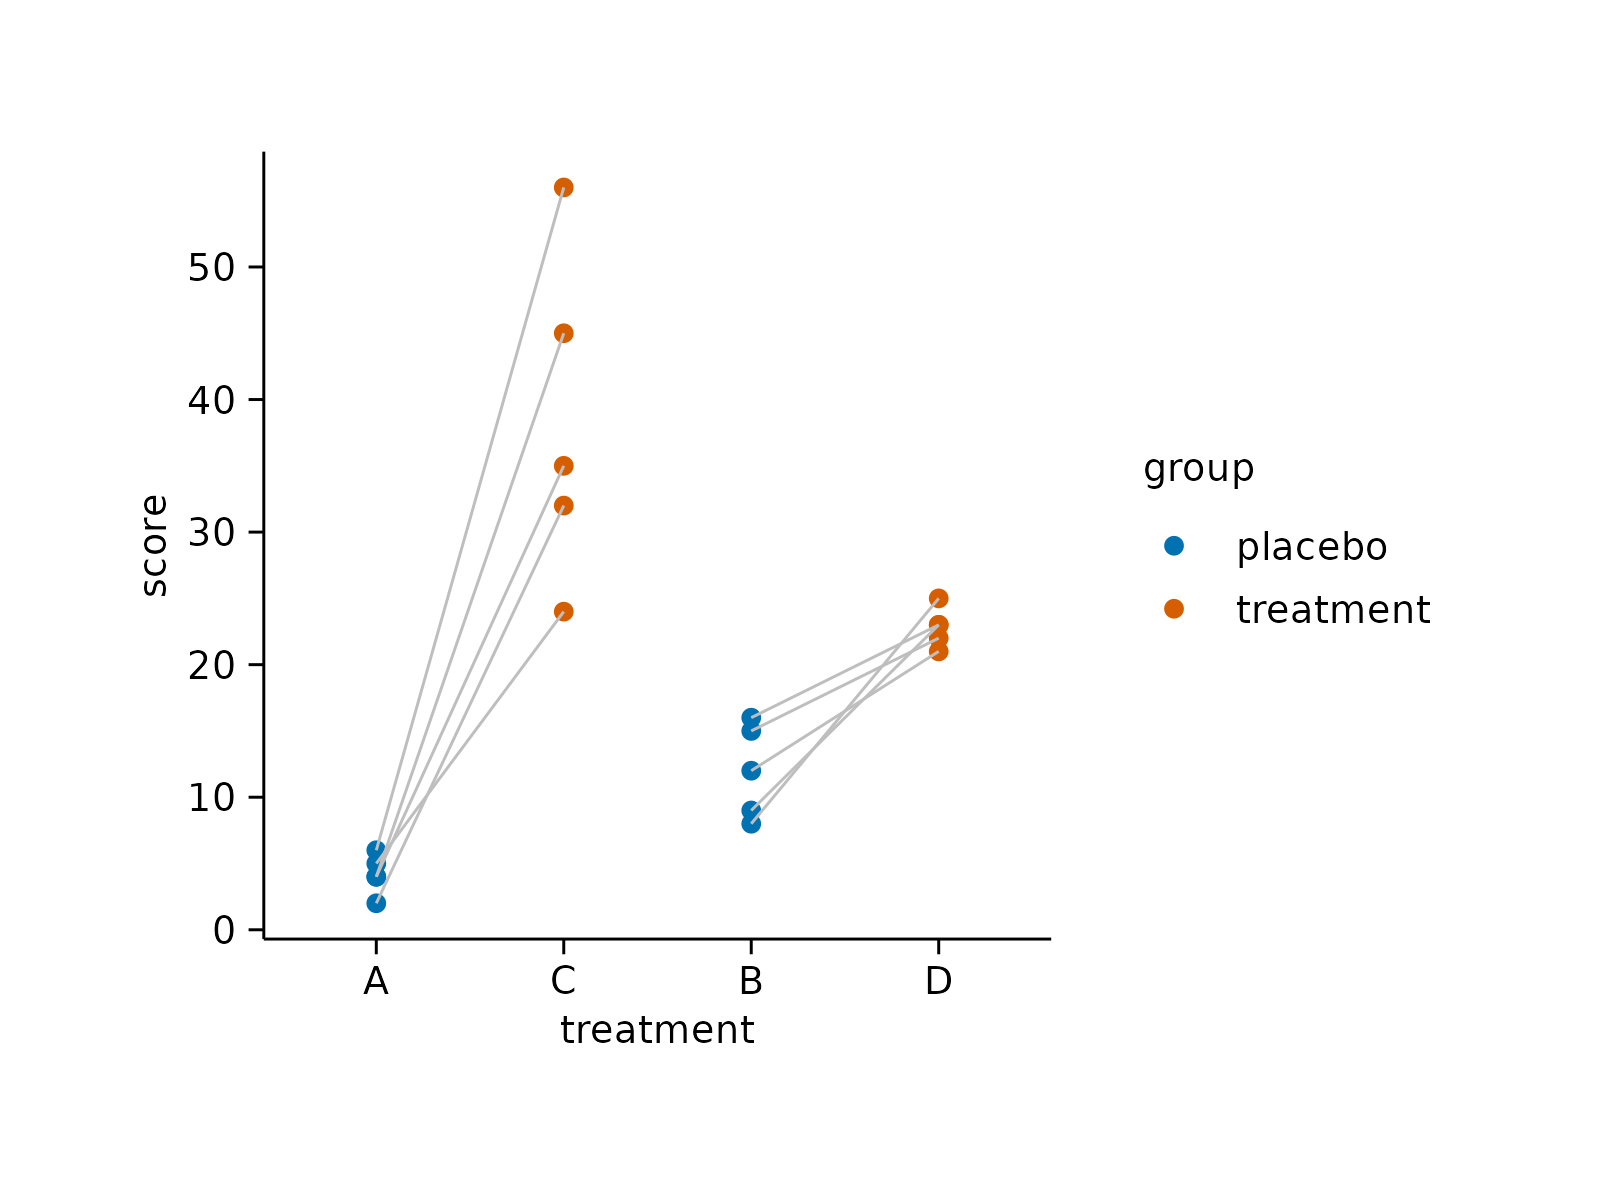
# Paired data points
study |>
tidyplot(x = treatment, y = score, color = group) |>
reorder_x_axis_labels("A", "C", "B", "D") |>
add_data_points() |>
add_line(group = participant, color = "grey")
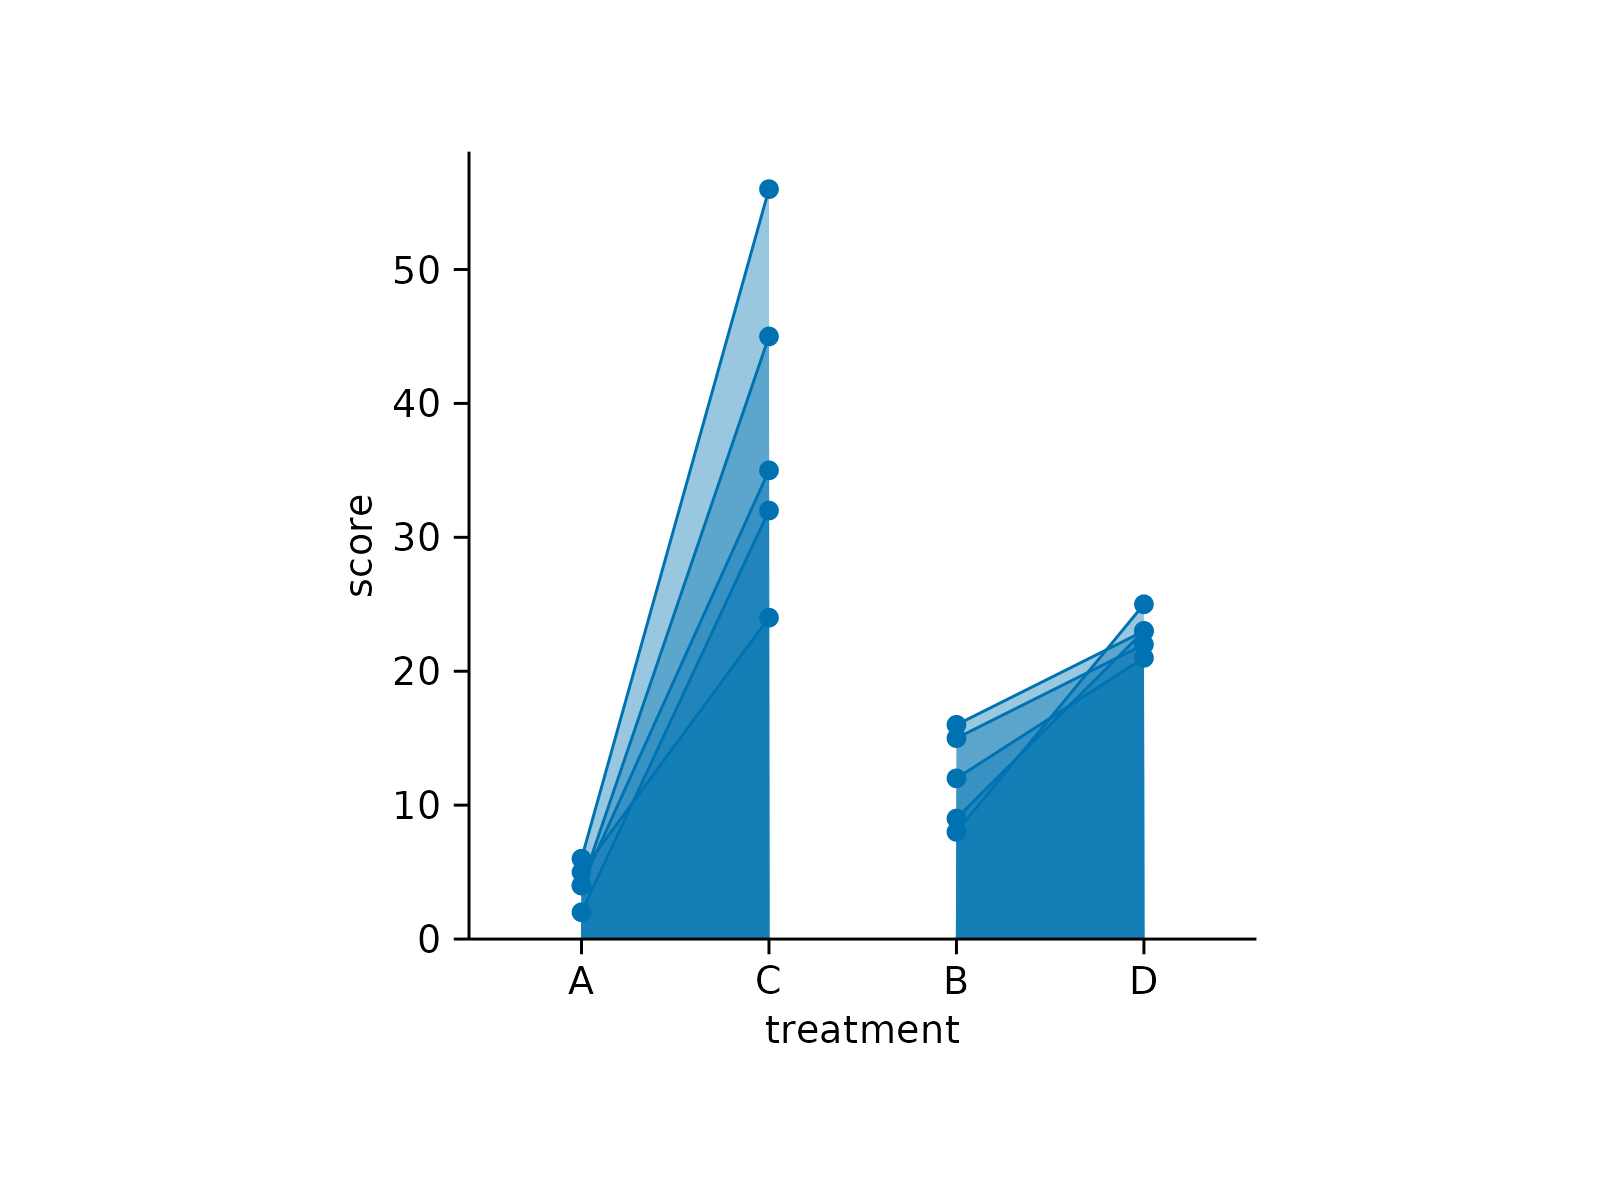
 study |>
tidyplot(x = treatment, y = score) |>
reorder_x_axis_labels("A", "C", "B", "D") |>
add_data_points() |>
add_area(group = participant)
study |>
tidyplot(x = treatment, y = score) |>
reorder_x_axis_labels("A", "C", "B", "D") |>
add_data_points() |>
add_area(group = participant)