Add annotation
Usage
add_annotation_text(plot, text, x, y, fontsize = 7, ...)

add_annotation_rectangle(
  plot,
  xmin,
  xmax,
  ymin,
  ymax,
  fill = plot$tidyplot$ink,
  color = NA,
  alpha = 0.1,
  ...
)

add_annotation_line(plot, x, xend, y, yend, color = plot$tidyplot$ink, ...)
Arguments
- plot
A
tidyplotgenerated with the functiontidyplot().- text
String for annotation text.
- x, xmin, xmax, xend, y, ymin, ymax, yend
Coordinates for the annotation.
- fontsize
Font size in points. Defaults to
7.- ...
Arguments passed on to
ggplot2::annotate().- fill
A hex color for the fill color. For example,
"#FFFFFF"for white.- color
A hex color for the stroke color. For example,
"#FFFFFF"for white.- alpha
A
numberbetween0and1for the opacity of an object. A value of0is completely transparent,1is completely opaque.
Examples
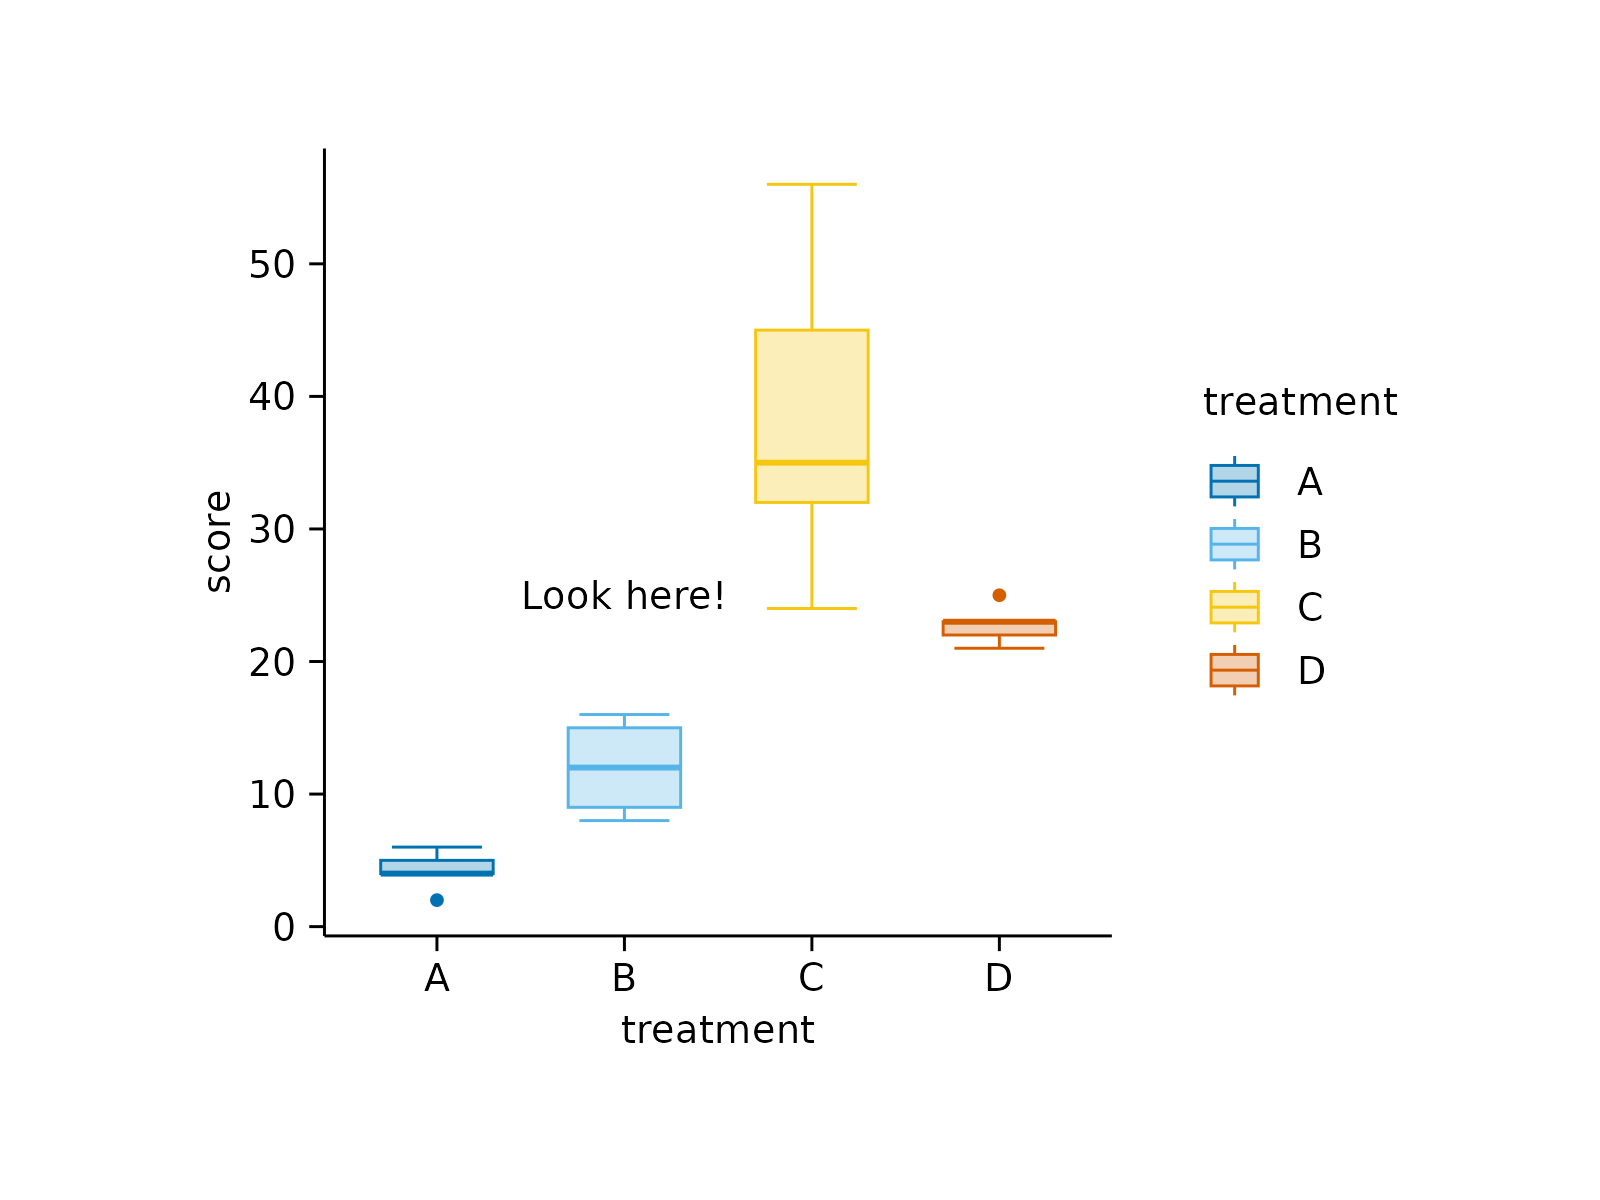
study |>
tidyplot(x = treatment, y = score, color = treatment) |>
add_boxplot() |>
add_annotation_text("Look here!", x = 2, y = 25)
 eu_countries |>
tidyplot(x = area, y = population) |>
add_data_points() |>
add_annotation_rectangle(xmin = 2.5e5, xmax = Inf, ymin = 42, ymax = Inf)
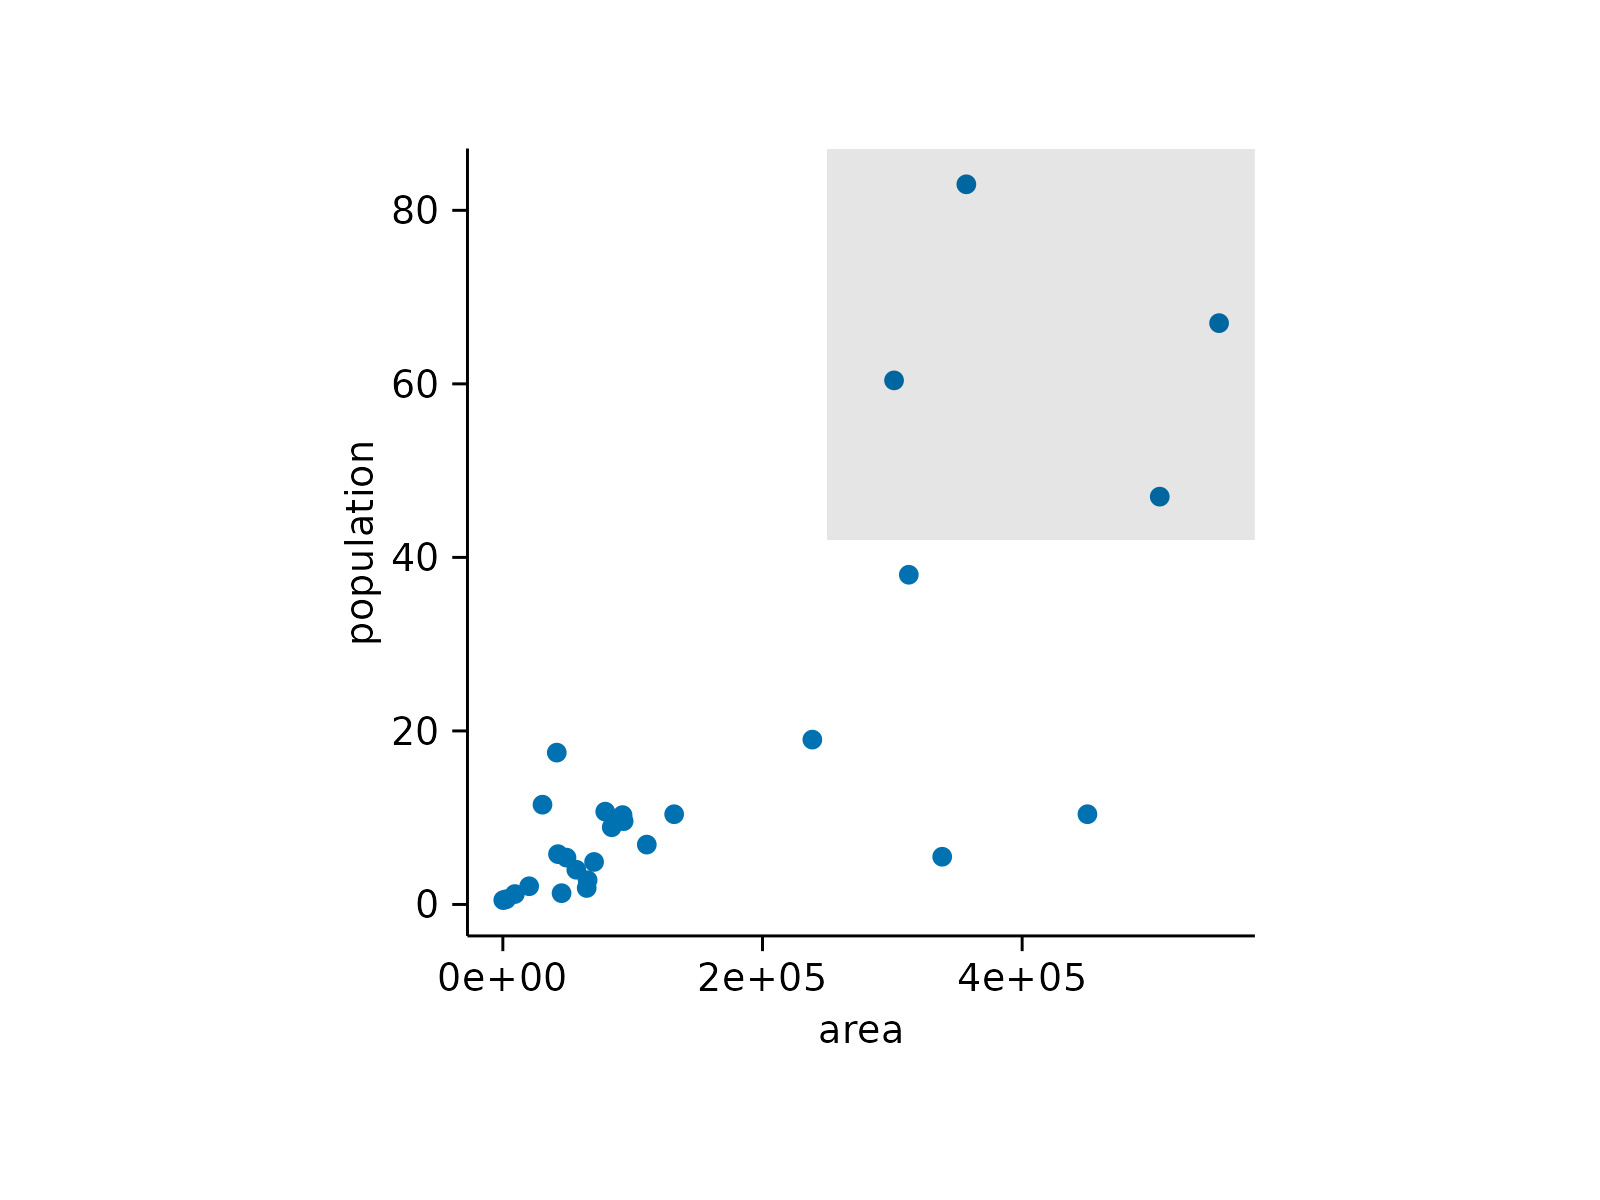
eu_countries |>
tidyplot(x = area, y = population) |>
add_data_points() |>
add_annotation_rectangle(xmin = 2.5e5, xmax = Inf, ymin = 42, ymax = Inf)
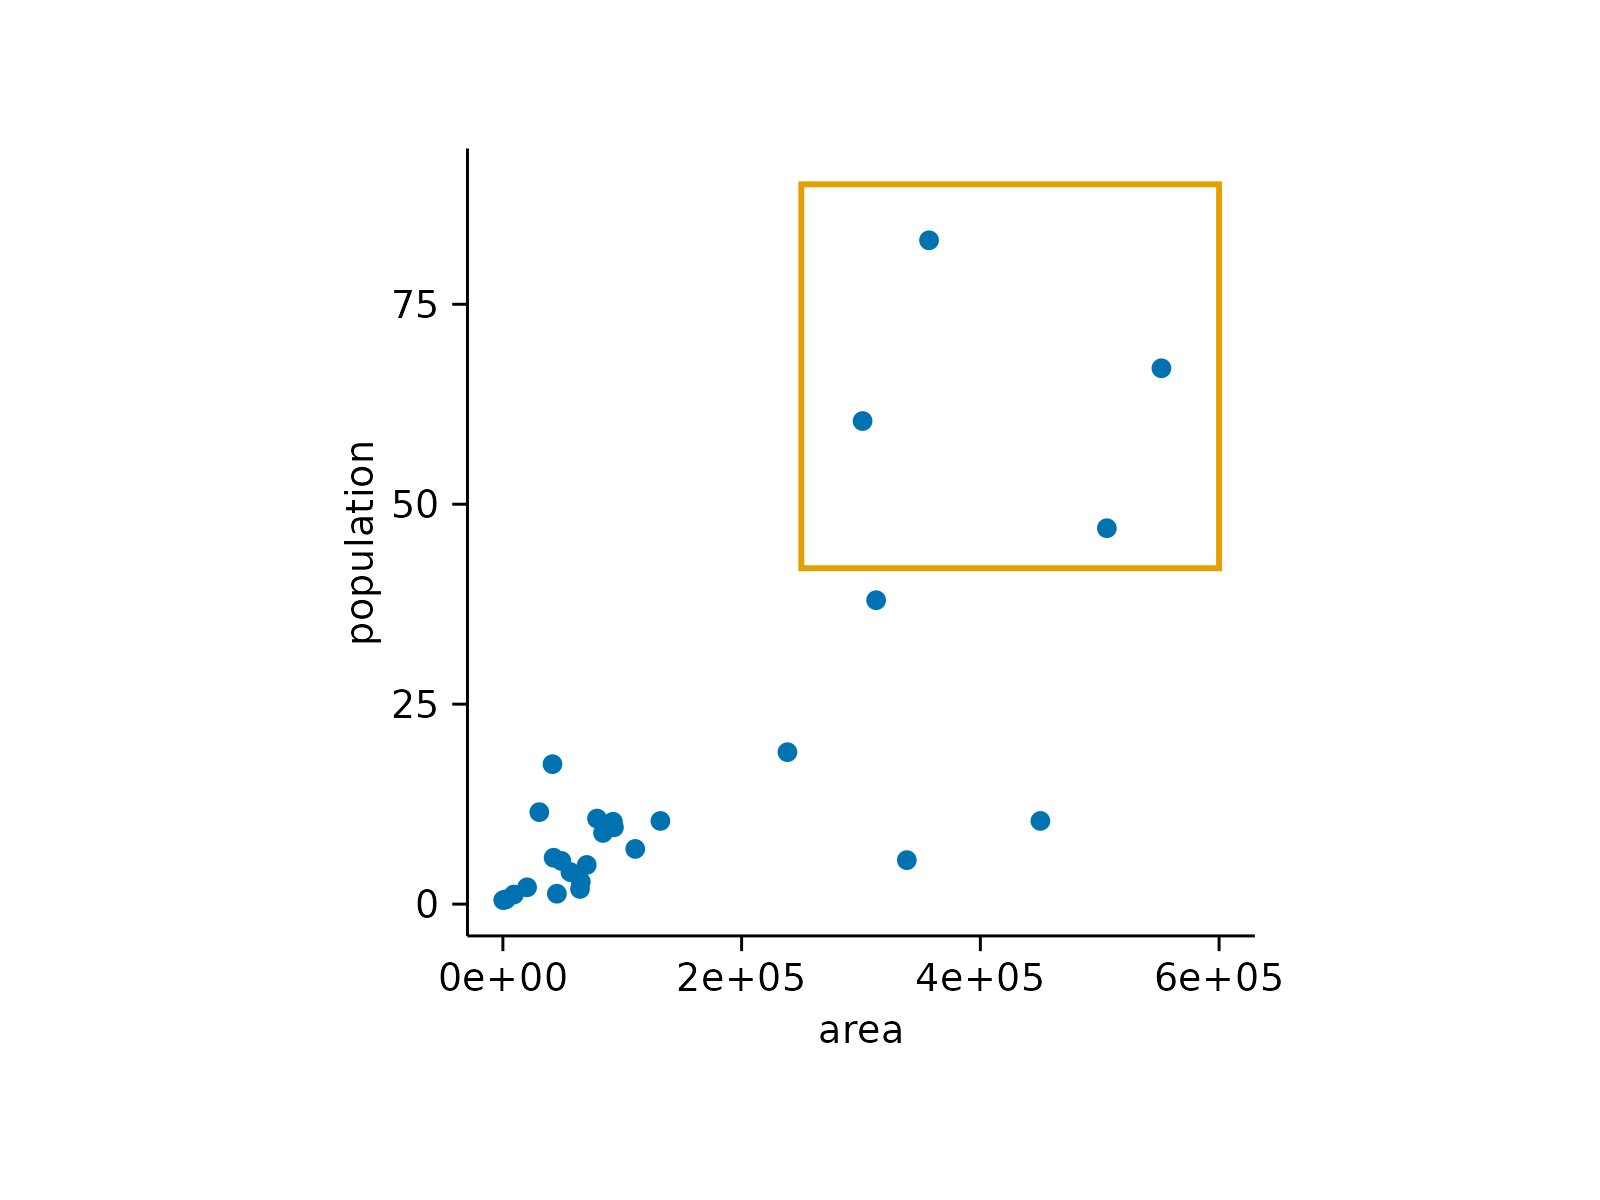
 eu_countries |>
tidyplot(x = area, y = population) |>
add_data_points() |>
add_annotation_rectangle(xmin = 2.5e5, xmax = 6e5, ymin = 42, ymax = 90,
color = "#E69F00", fill = NA)
eu_countries |>
tidyplot(x = area, y = population) |>
add_data_points() |>
add_annotation_rectangle(xmin = 2.5e5, xmax = 6e5, ymin = 42, ymax = 90,
color = "#E69F00", fill = NA)
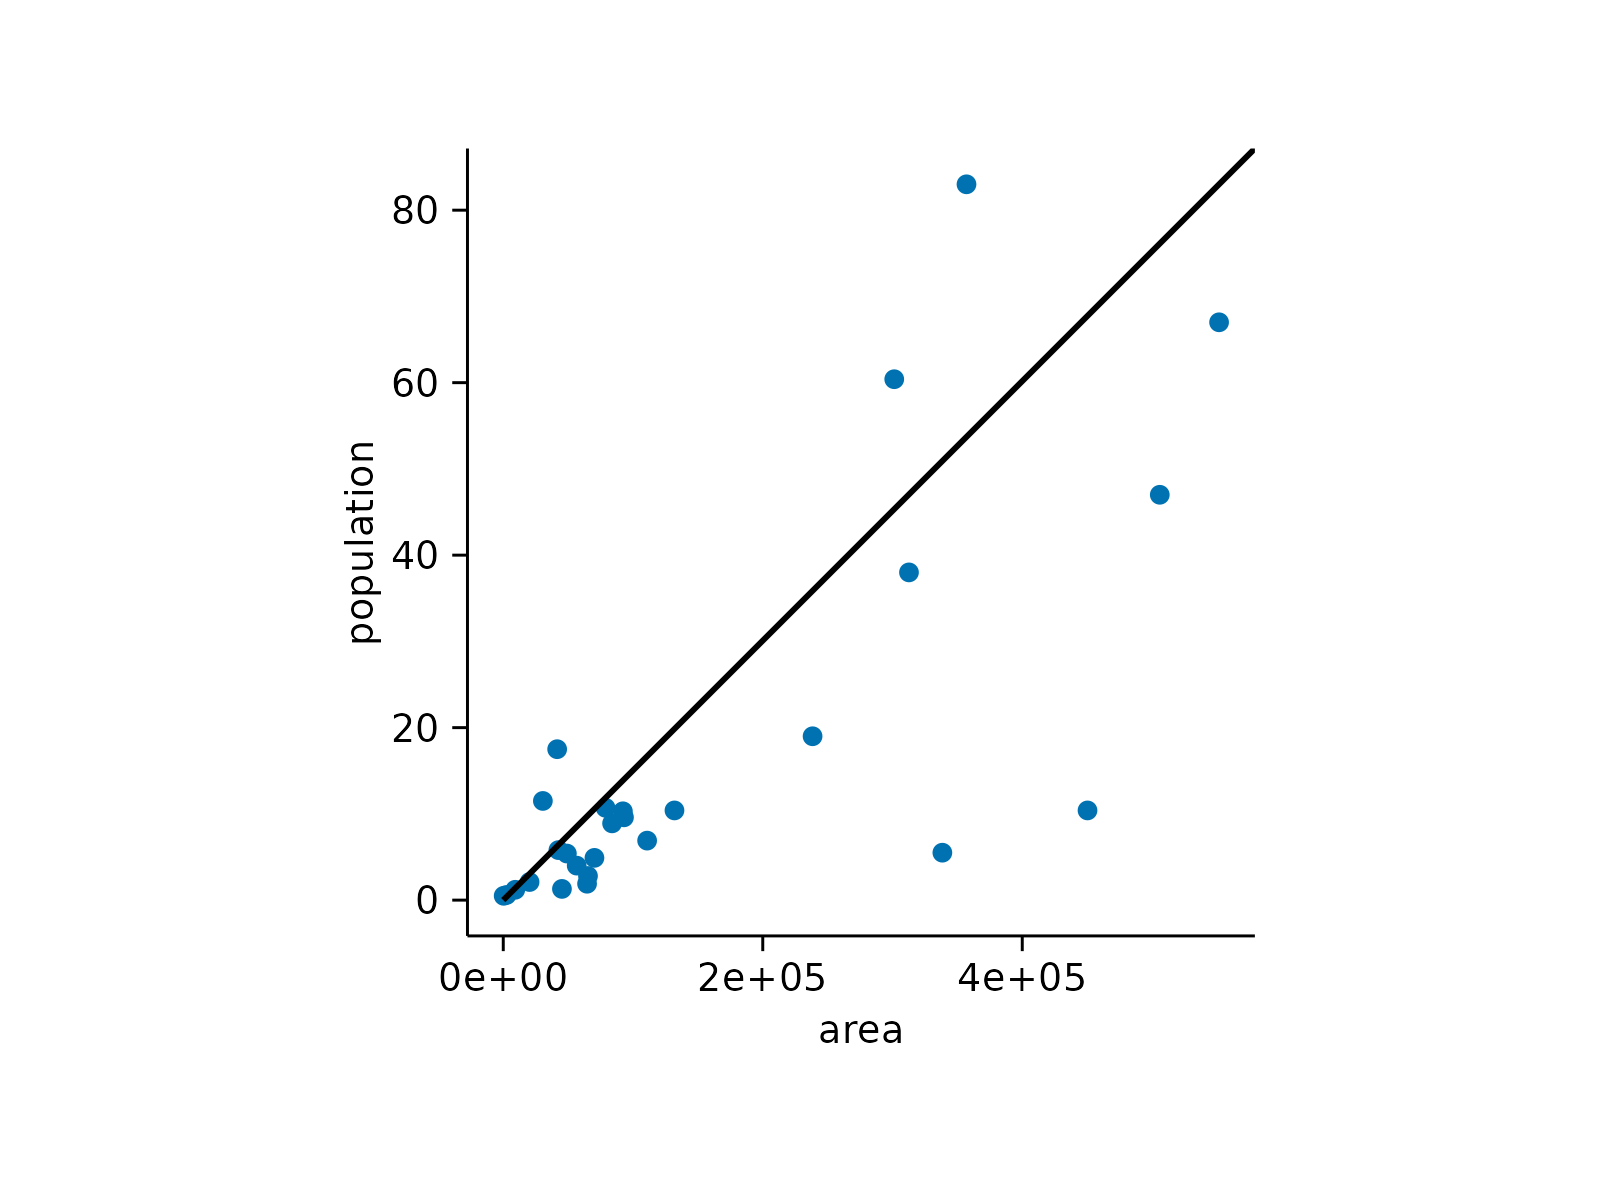
 eu_countries |>
tidyplot(x = area, y = population) |>
add_data_points() |>
add_annotation_line(x = 0, xend = Inf, y = 0, yend = Inf)
eu_countries |>
tidyplot(x = area, y = population) |>
add_data_points() |>
add_annotation_line(x = 0, xend = Inf, y = 0, yend = Inf)