Remove y-axis or parts of it
Usage
remove_y_axis(plot)

remove_y_axis_line(plot)

remove_y_axis_ticks(plot)

remove_y_axis_labels(plot)

remove_y_axis_title(plot)
Arguments
- plot
A
tidyplotgenerated with the functiontidyplot().
Examples
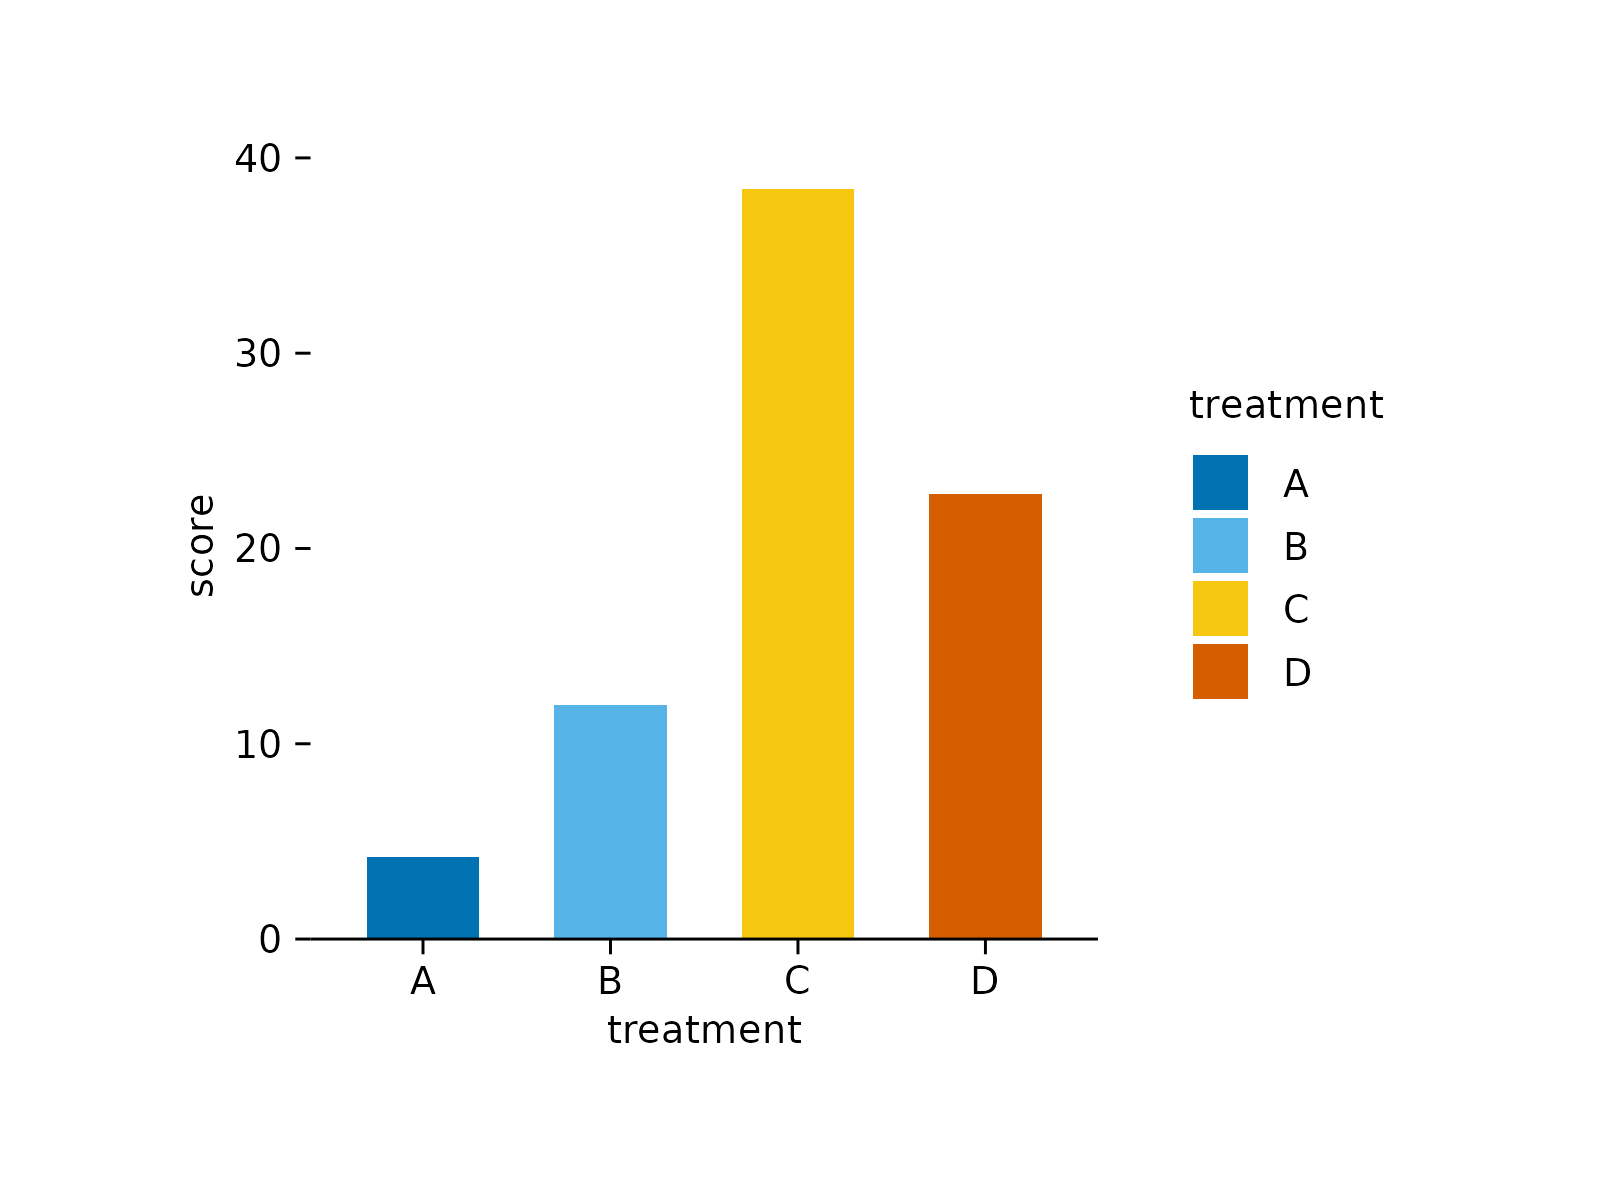
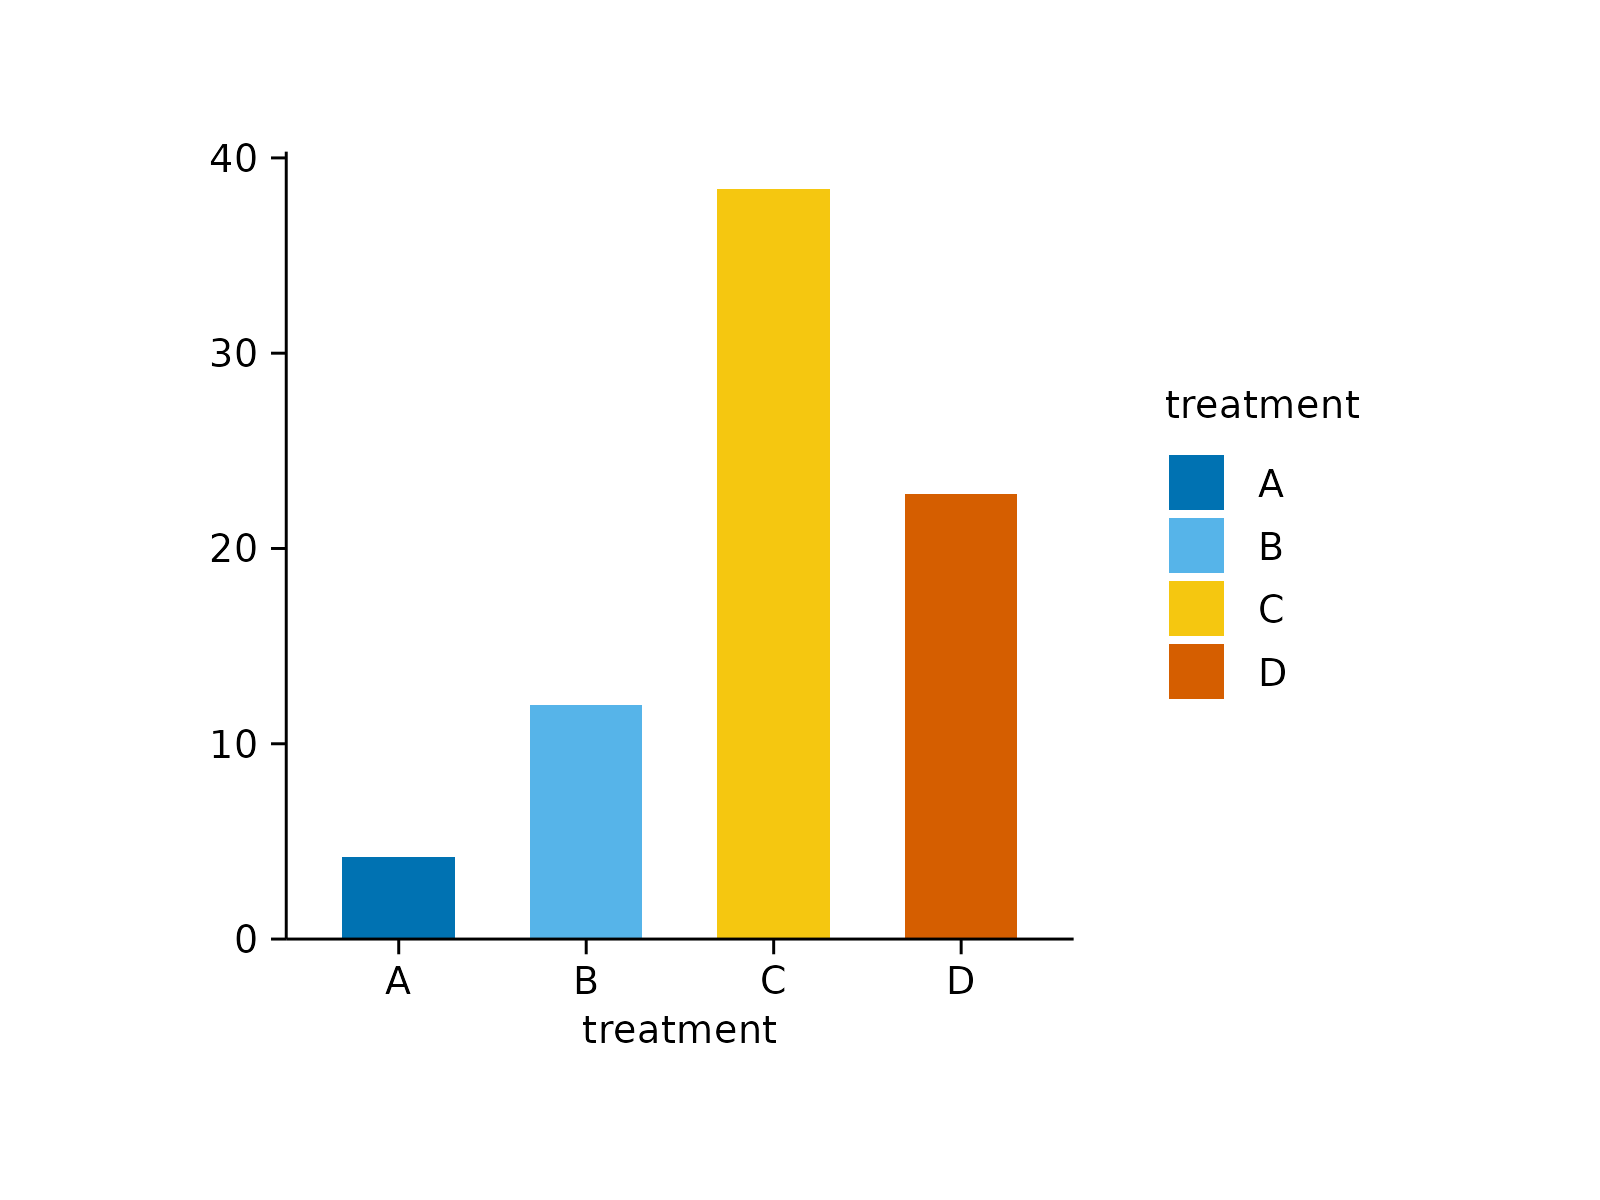
# Before removing
study |>
tidyplot(x = treatment, y = score, color = treatment) |>
add_mean_bar()
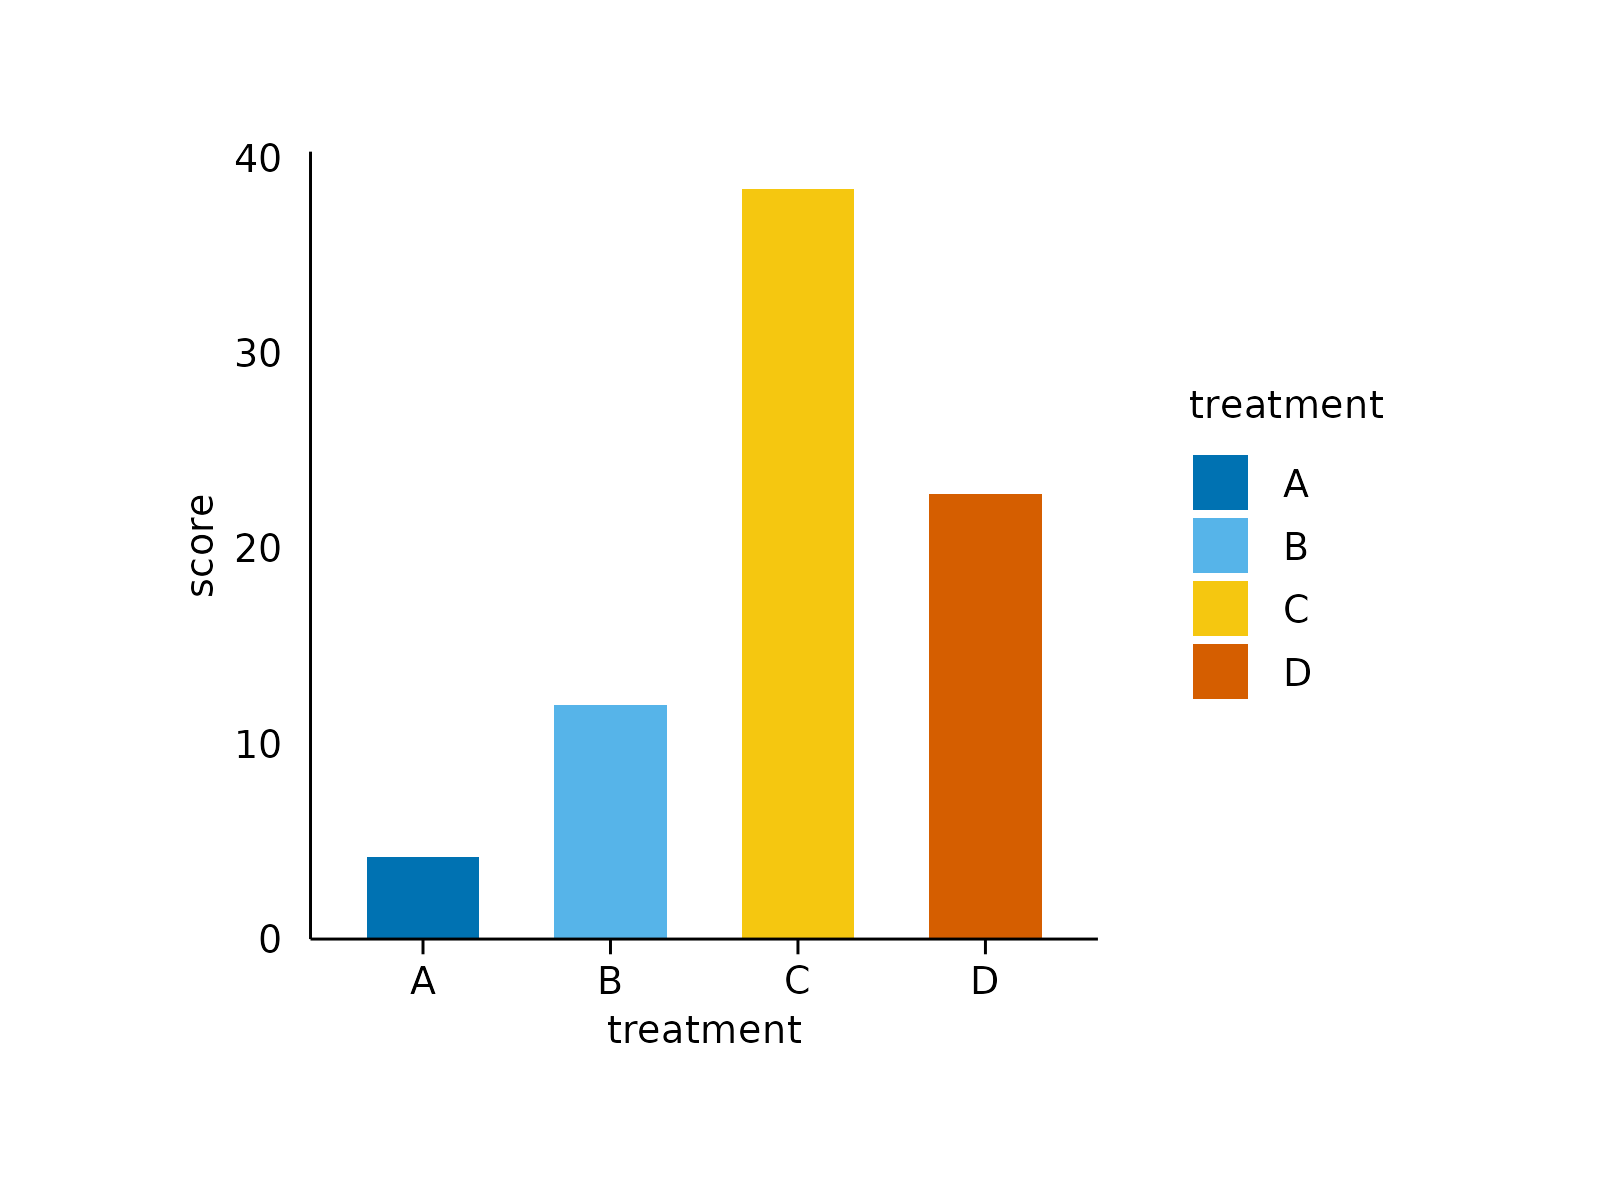
 # After removing
study |>
tidyplot(x = treatment, y = score, color = treatment) |>
add_mean_bar() |>
remove_y_axis_line()
# After removing
study |>
tidyplot(x = treatment, y = score, color = treatment) |>
add_mean_bar() |>
remove_y_axis_line()
 study |>
tidyplot(x = treatment, y = score, color = treatment) |>
add_mean_bar() |>
remove_y_axis_ticks()
study |>
tidyplot(x = treatment, y = score, color = treatment) |>
add_mean_bar() |>
remove_y_axis_ticks()
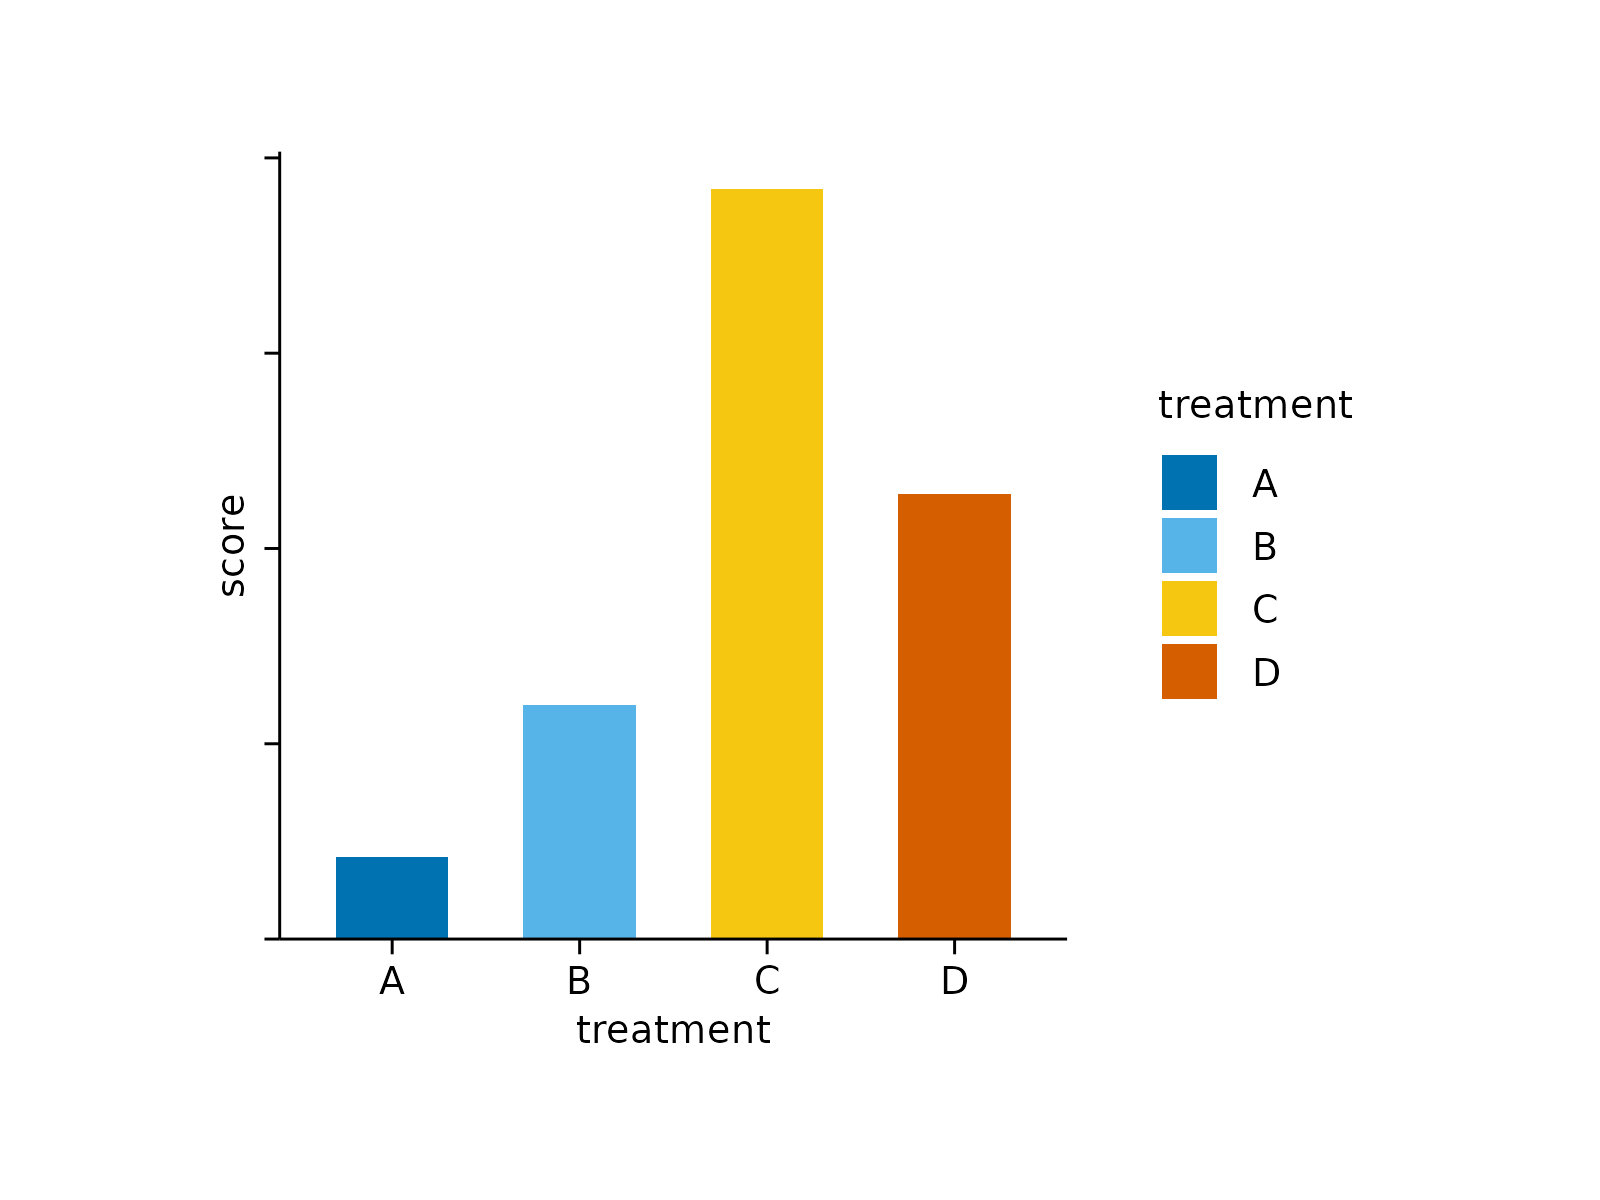
 study |>
tidyplot(x = treatment, y = score, color = treatment) |>
add_mean_bar() |>
remove_y_axis_labels()
study |>
tidyplot(x = treatment, y = score, color = treatment) |>
add_mean_bar() |>
remove_y_axis_labels()
 study |>
tidyplot(x = treatment, y = score, color = treatment) |>
add_mean_bar() |>
remove_y_axis_title()
study |>
tidyplot(x = treatment, y = score, color = treatment) |>
add_mean_bar() |>
remove_y_axis_title()
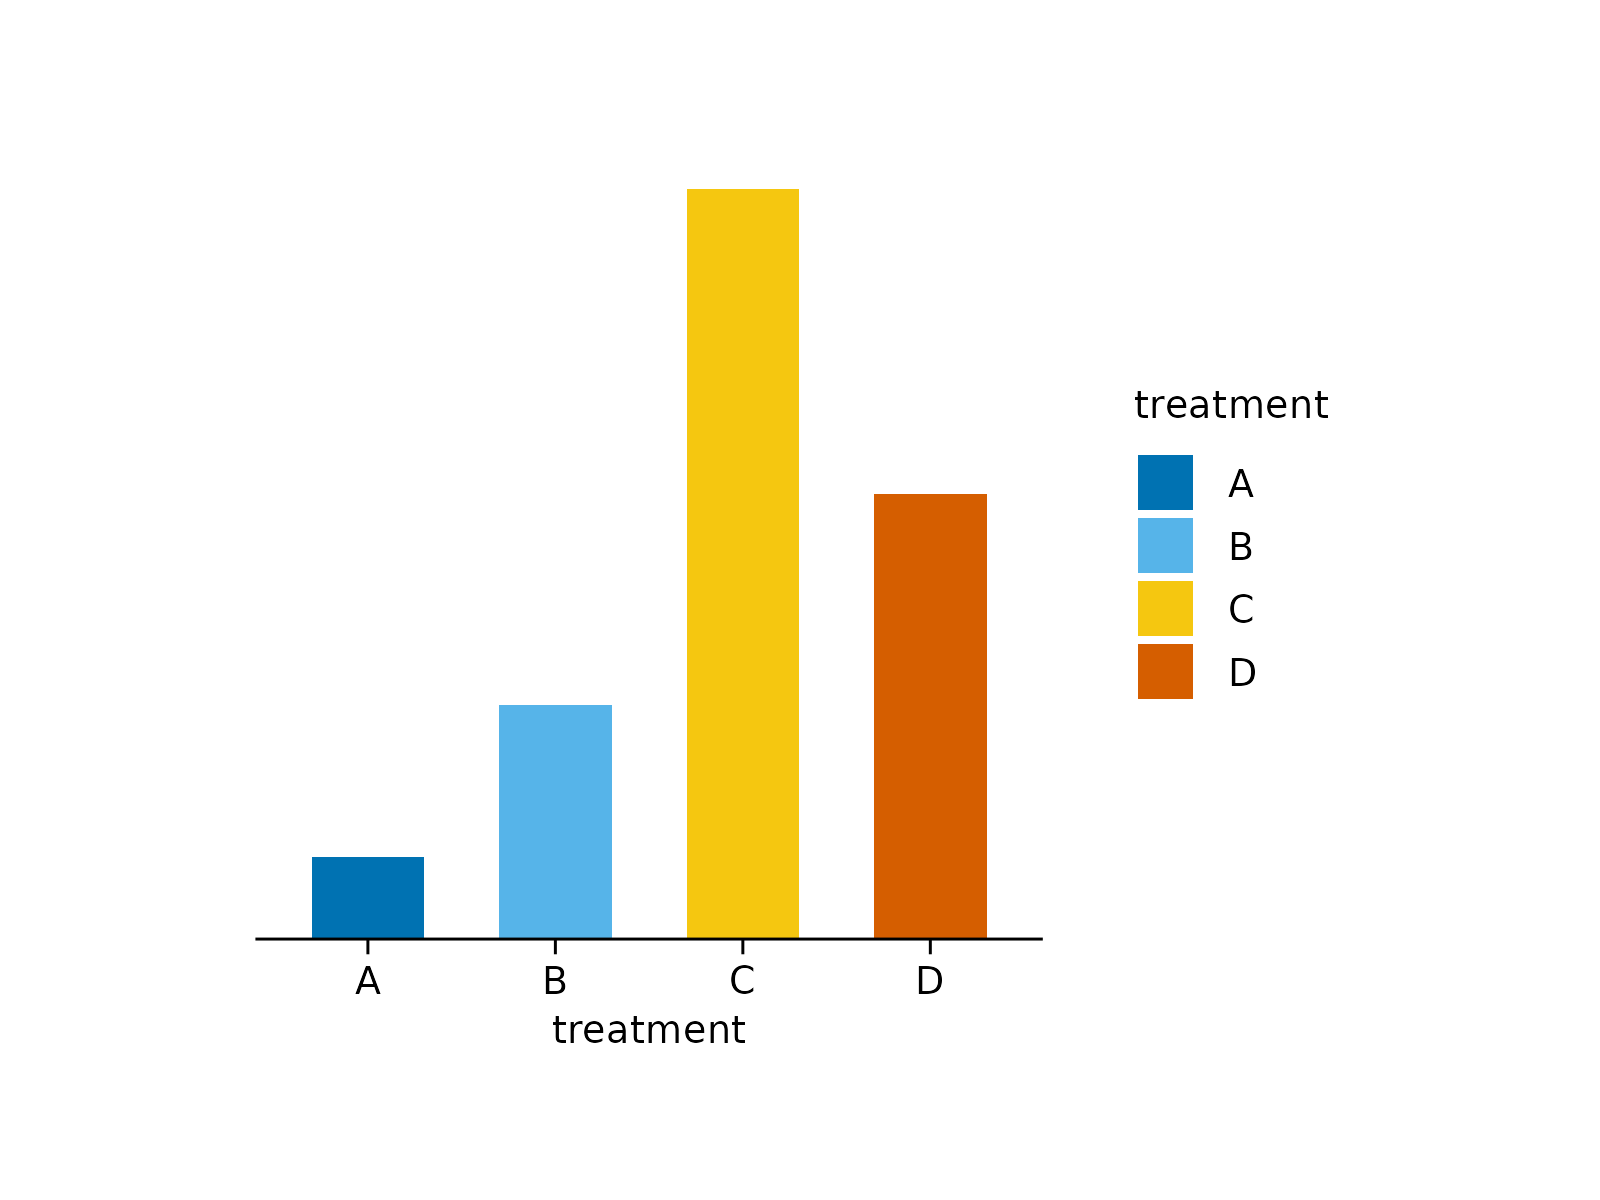
 study |>
tidyplot(x = treatment, y = score, color = treatment) |>
add_mean_bar() |>
remove_y_axis()
study |>
tidyplot(x = treatment, y = score, color = treatment) |>
add_mean_bar() |>
remove_y_axis()