Remove plot area padding
Arguments
- plot
A
tidyplotgenerated with the functiontidyplot().- force_continuous
Whether to force the axis to be continuous. Defaults to
FALSE.
Examples
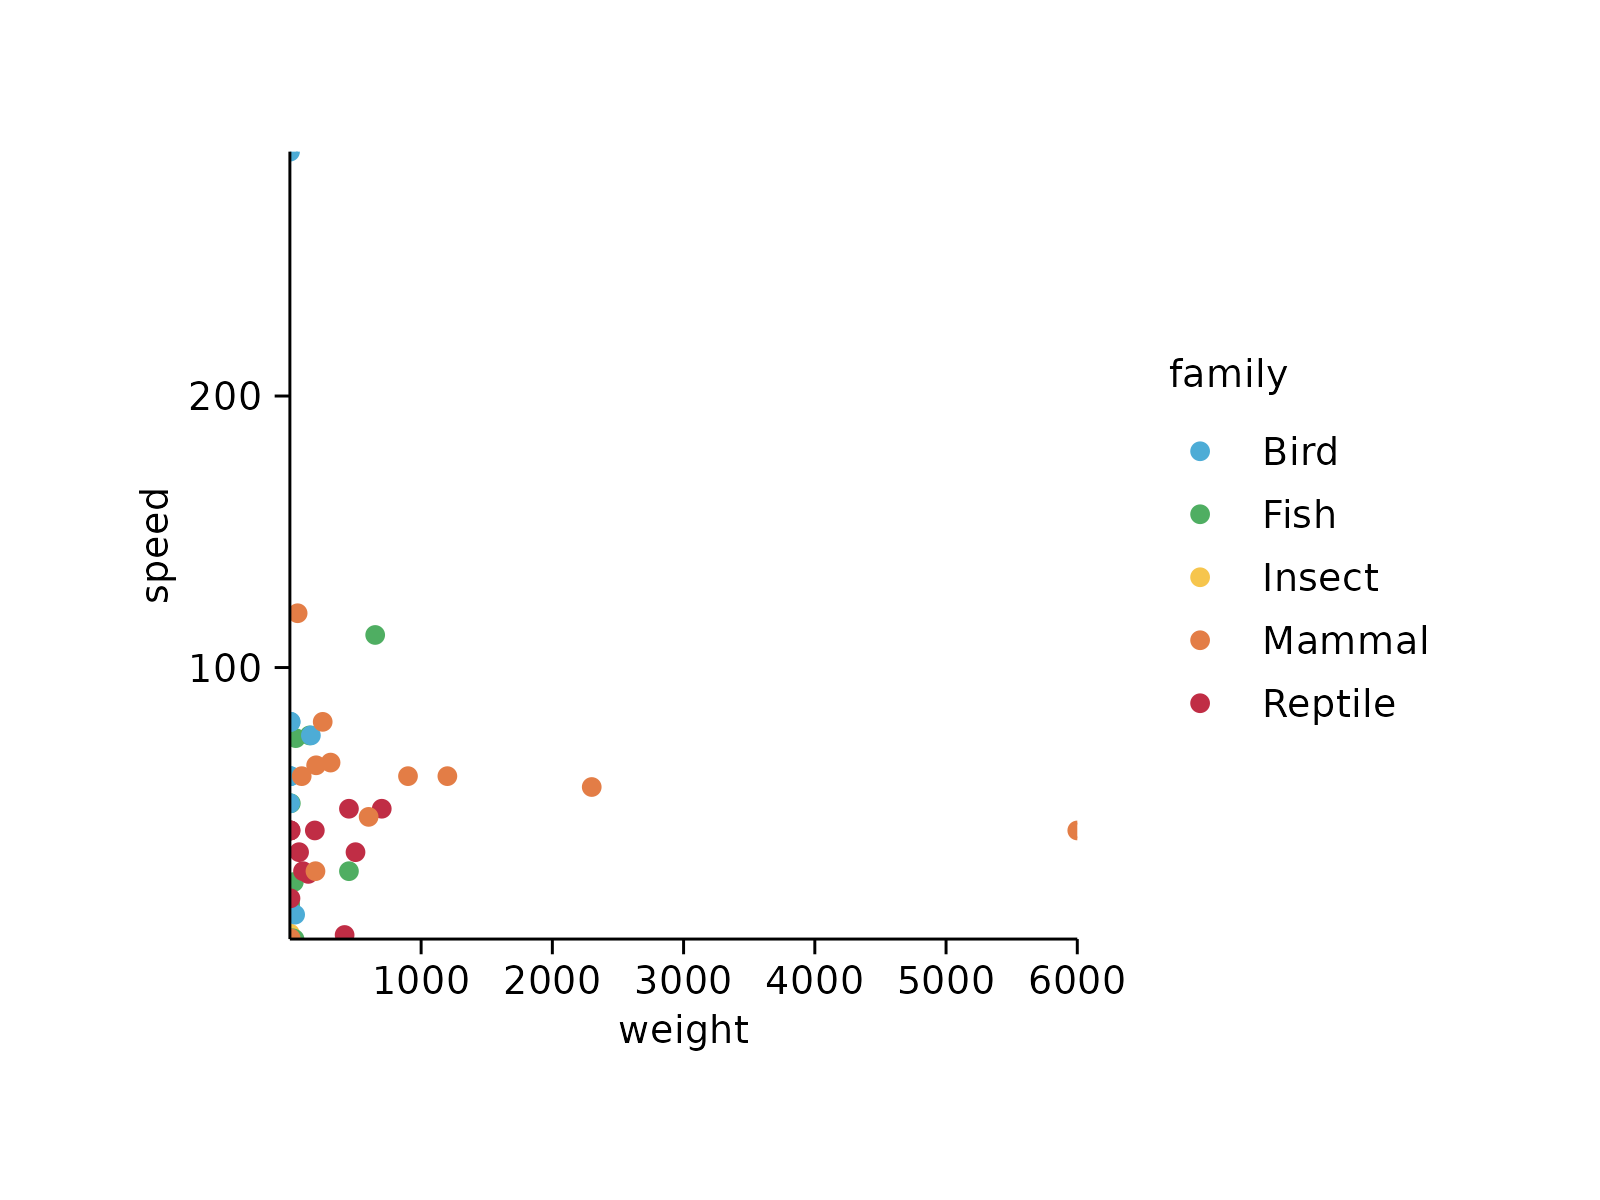
# Before removing
animals %>%
tidyplot(x = weight, y = speed, color = family) %>%
add_data_points()
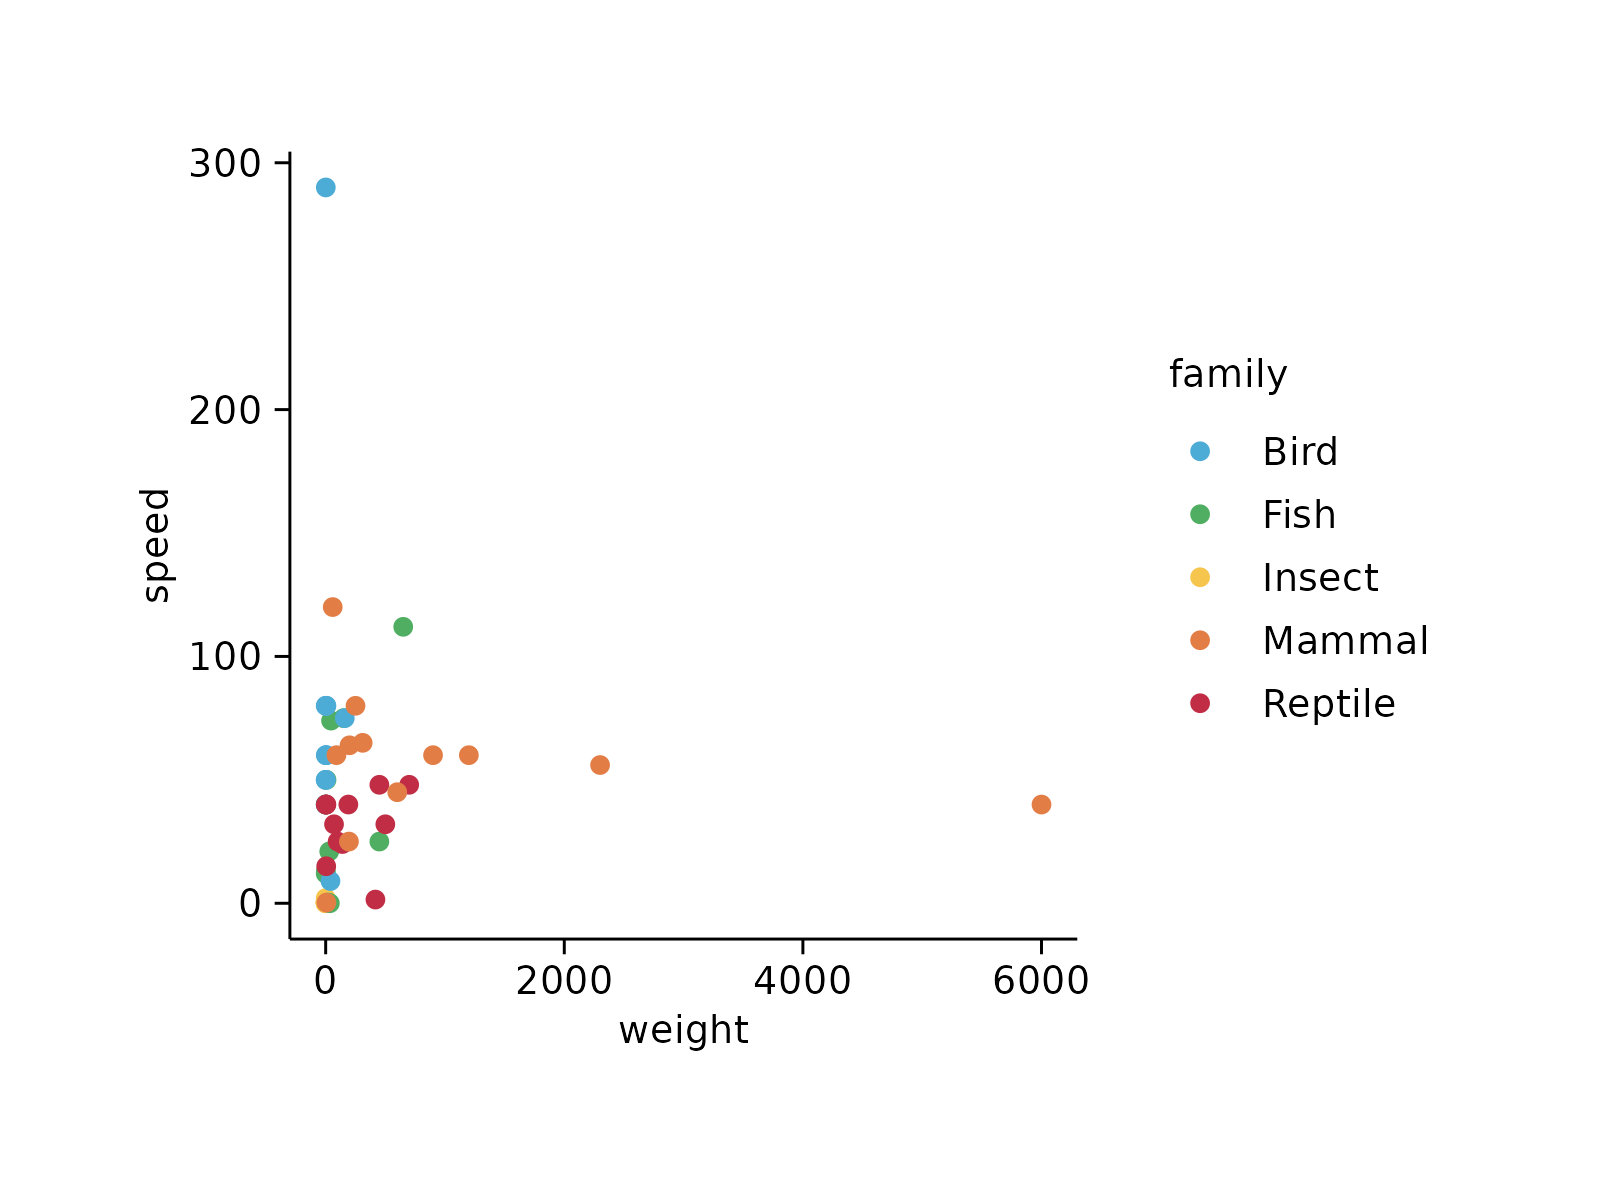 # After removing
animals %>%
tidyplot(x = weight, y = speed, color = family) %>%
add_data_points() %>%
remove_plot_area_padding()
# After removing
animals %>%
tidyplot(x = weight, y = speed, color = family) %>%
add_data_points() %>%
remove_plot_area_padding()