Adjust plot area padding
Usage
adjust_padding(
  plot,
  top = NA,
  right = NA,
  bottom = NA,
  left = NA,
  all = NA,
  force_continuous = FALSE,
  ...
)
Arguments
- plot
A
tidyplotgenerated with the functiontidyplot().- top
Extra space between the data points and the top. Defaults to
NA, which does not change the padding.- right
Extra space between the data points and the right. Defaults to
NA, which does not change the padding.- bottom
Extra space between the data points and the bottom. Defaults to
NA, which does not change the padding.- left
Extra space between the data points and the left. Defaults to
NA, which does not change the padding.- all
Extra space around the data pointst. Overwrites
top,right,bottom,leftif set. Defaults toNA, which does not change the padding.- force_continuous
Whether to force the axis to be continuous. Defaults to
FALSE.- ...
Arguments passed on to the
geomfunction.
Examples
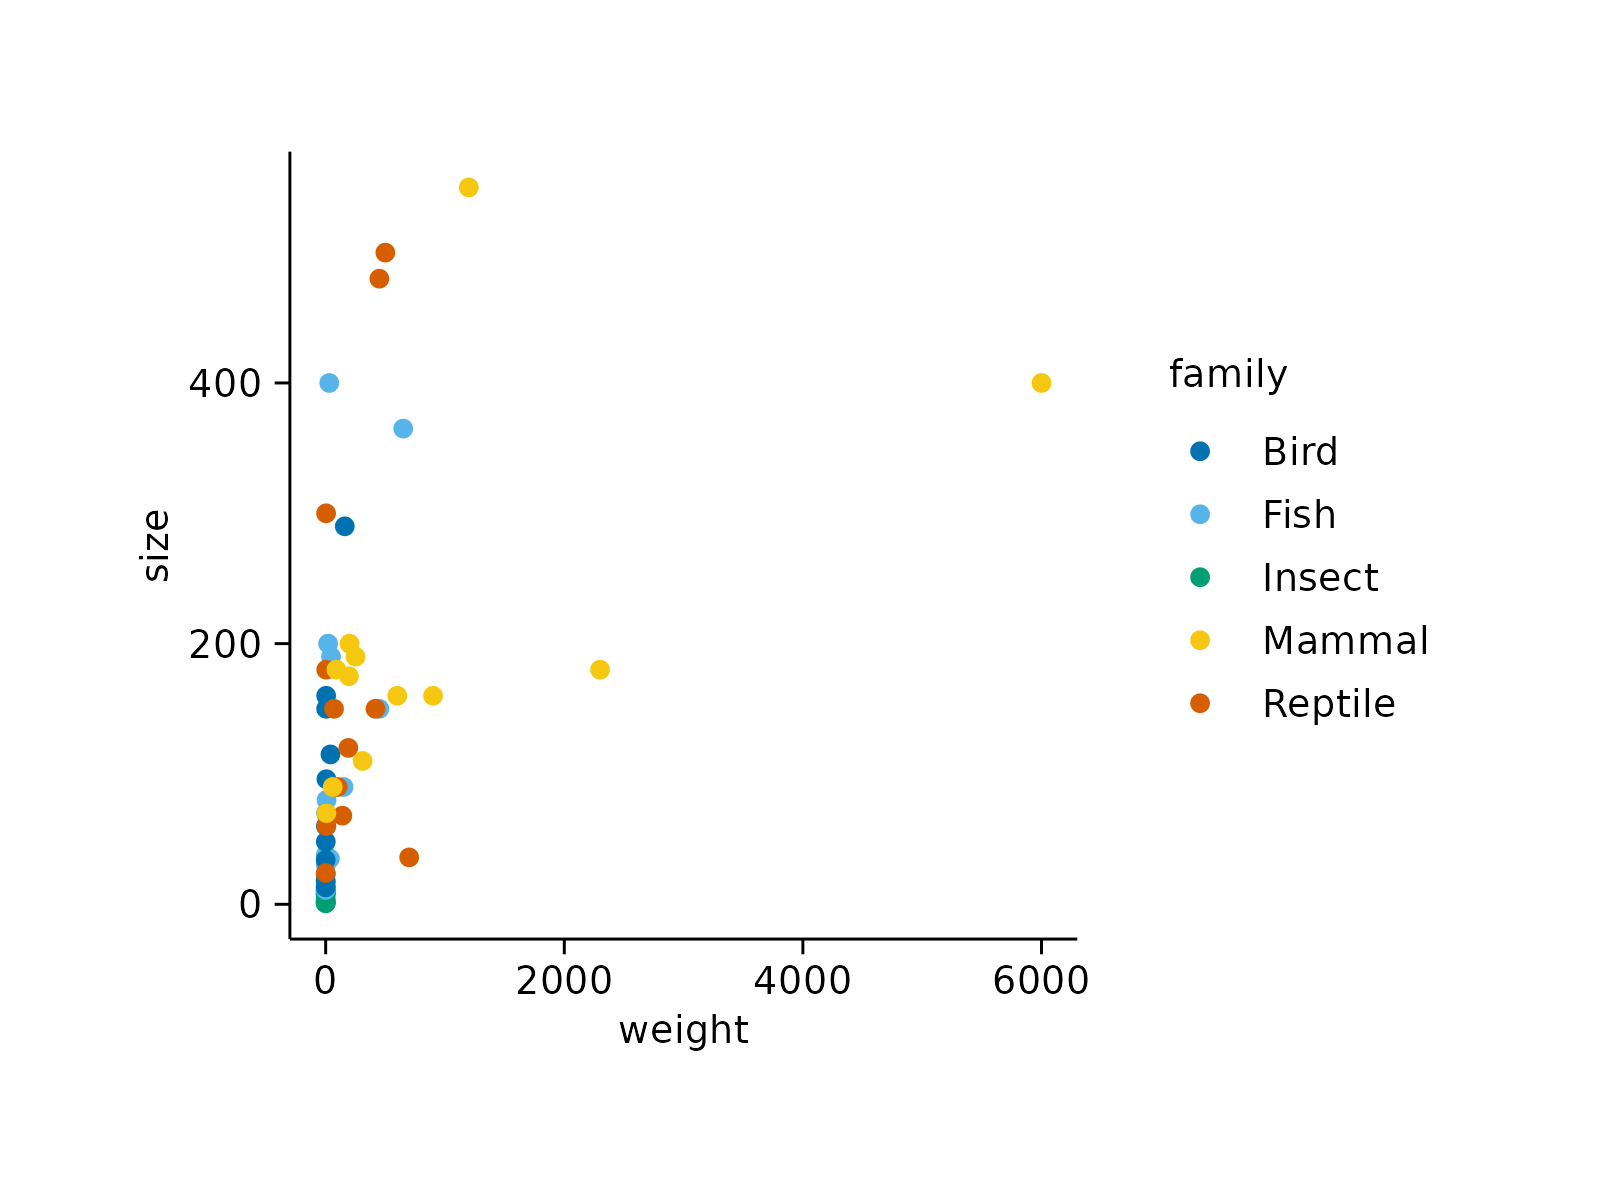
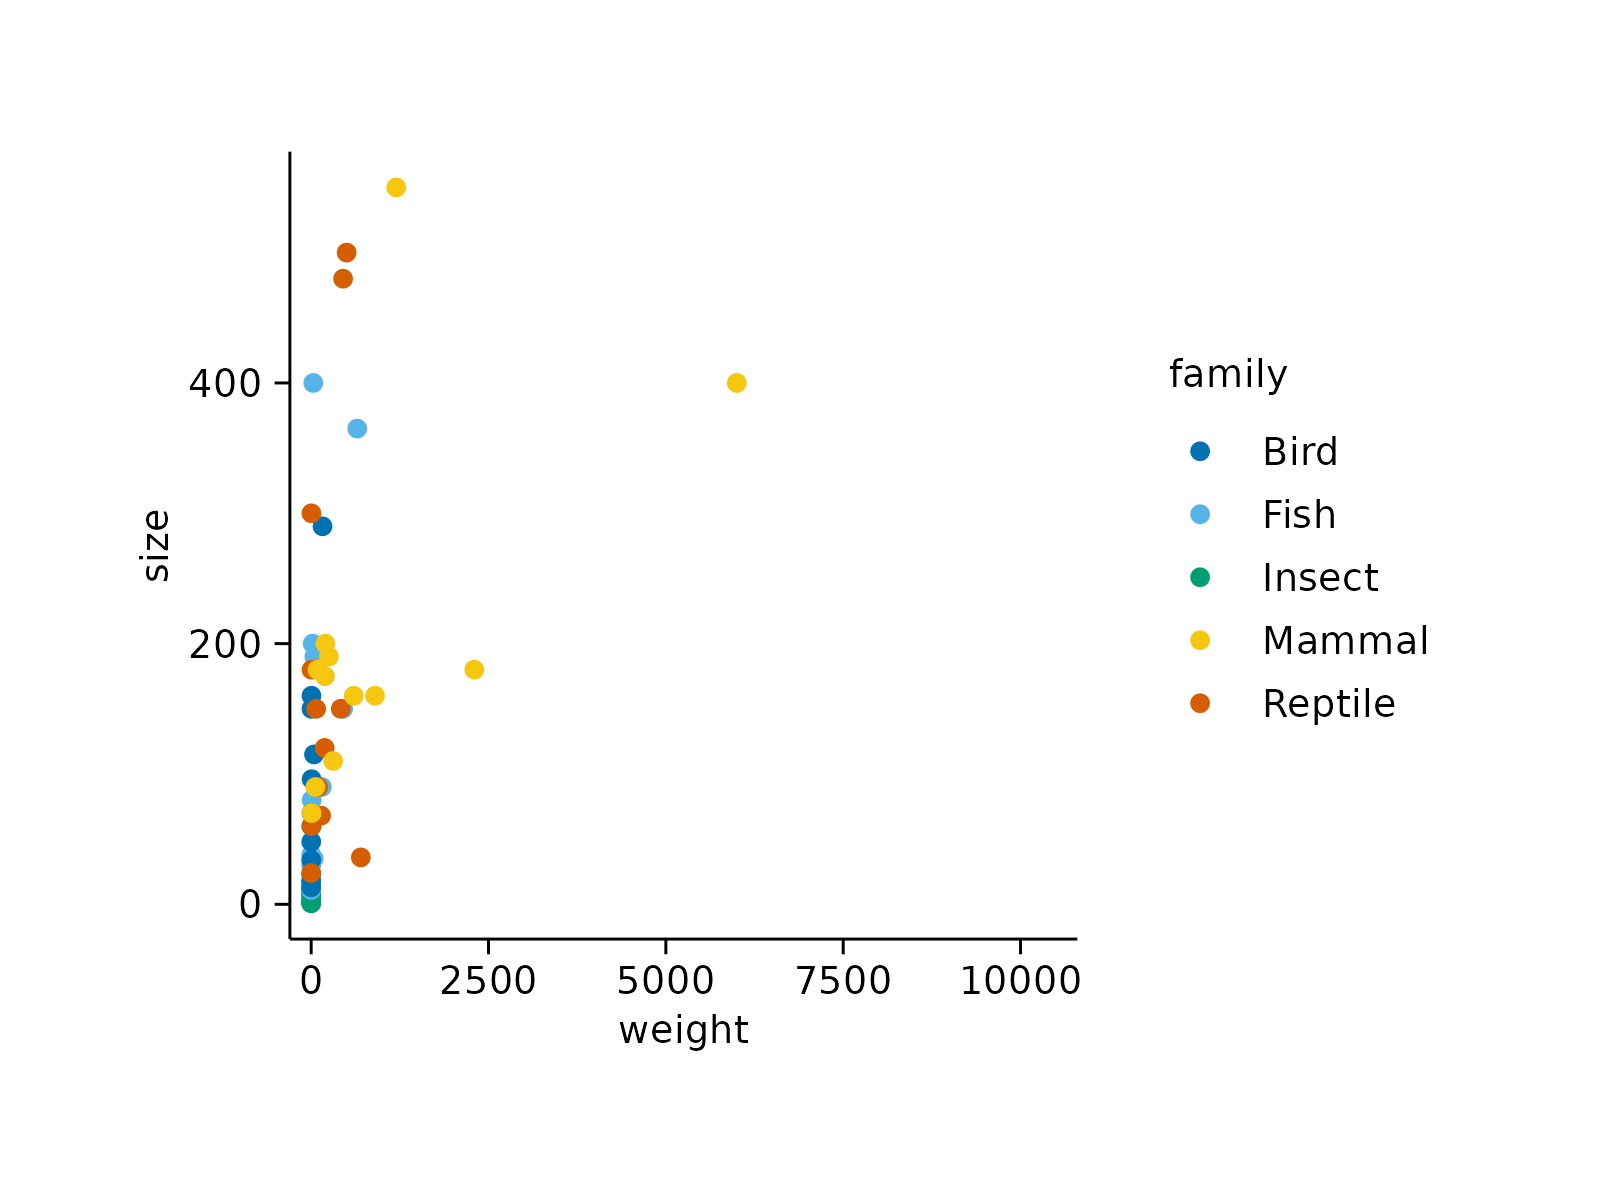
# Plot without adjustments
animals |>
tidyplot(x = weight, y = size, color = family) |>
add_data_points() |>
adjust_padding()
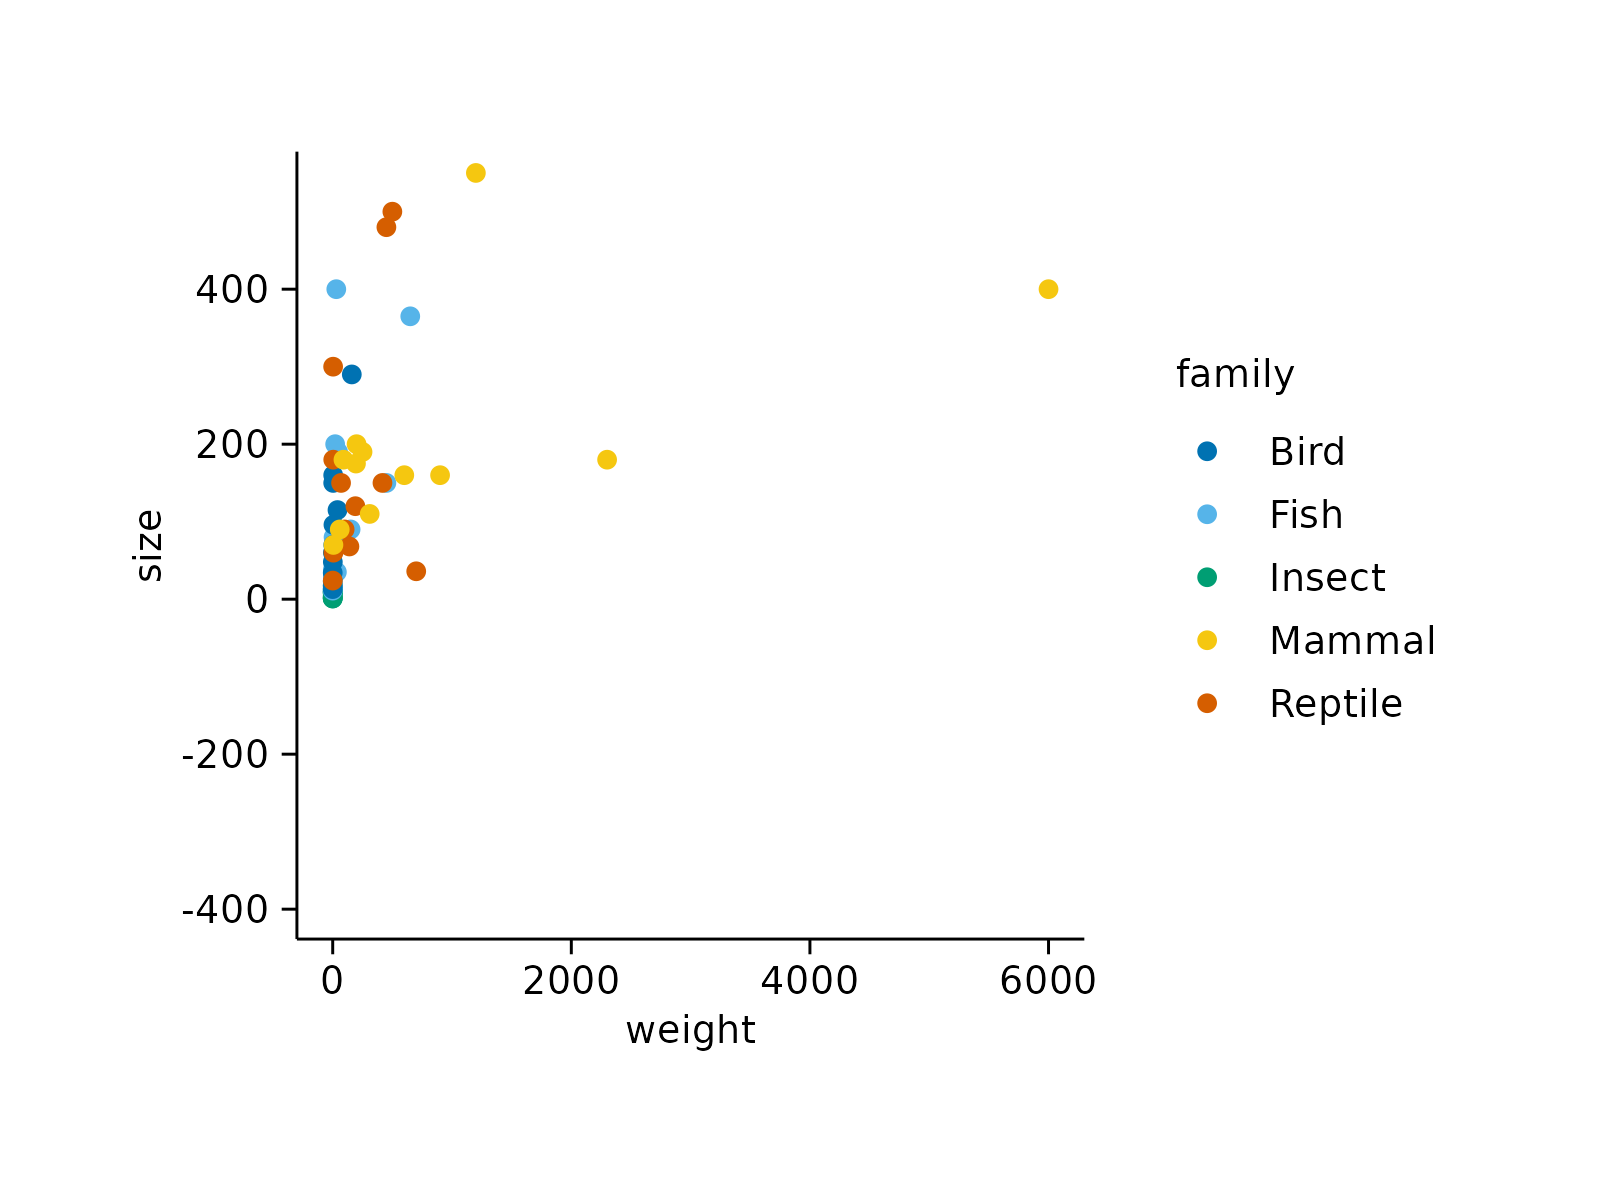
 # Increase plot area padding
animals |>
tidyplot(x = weight, y = size, color = family) |>
add_data_points() |>
adjust_padding(all = 0.2)
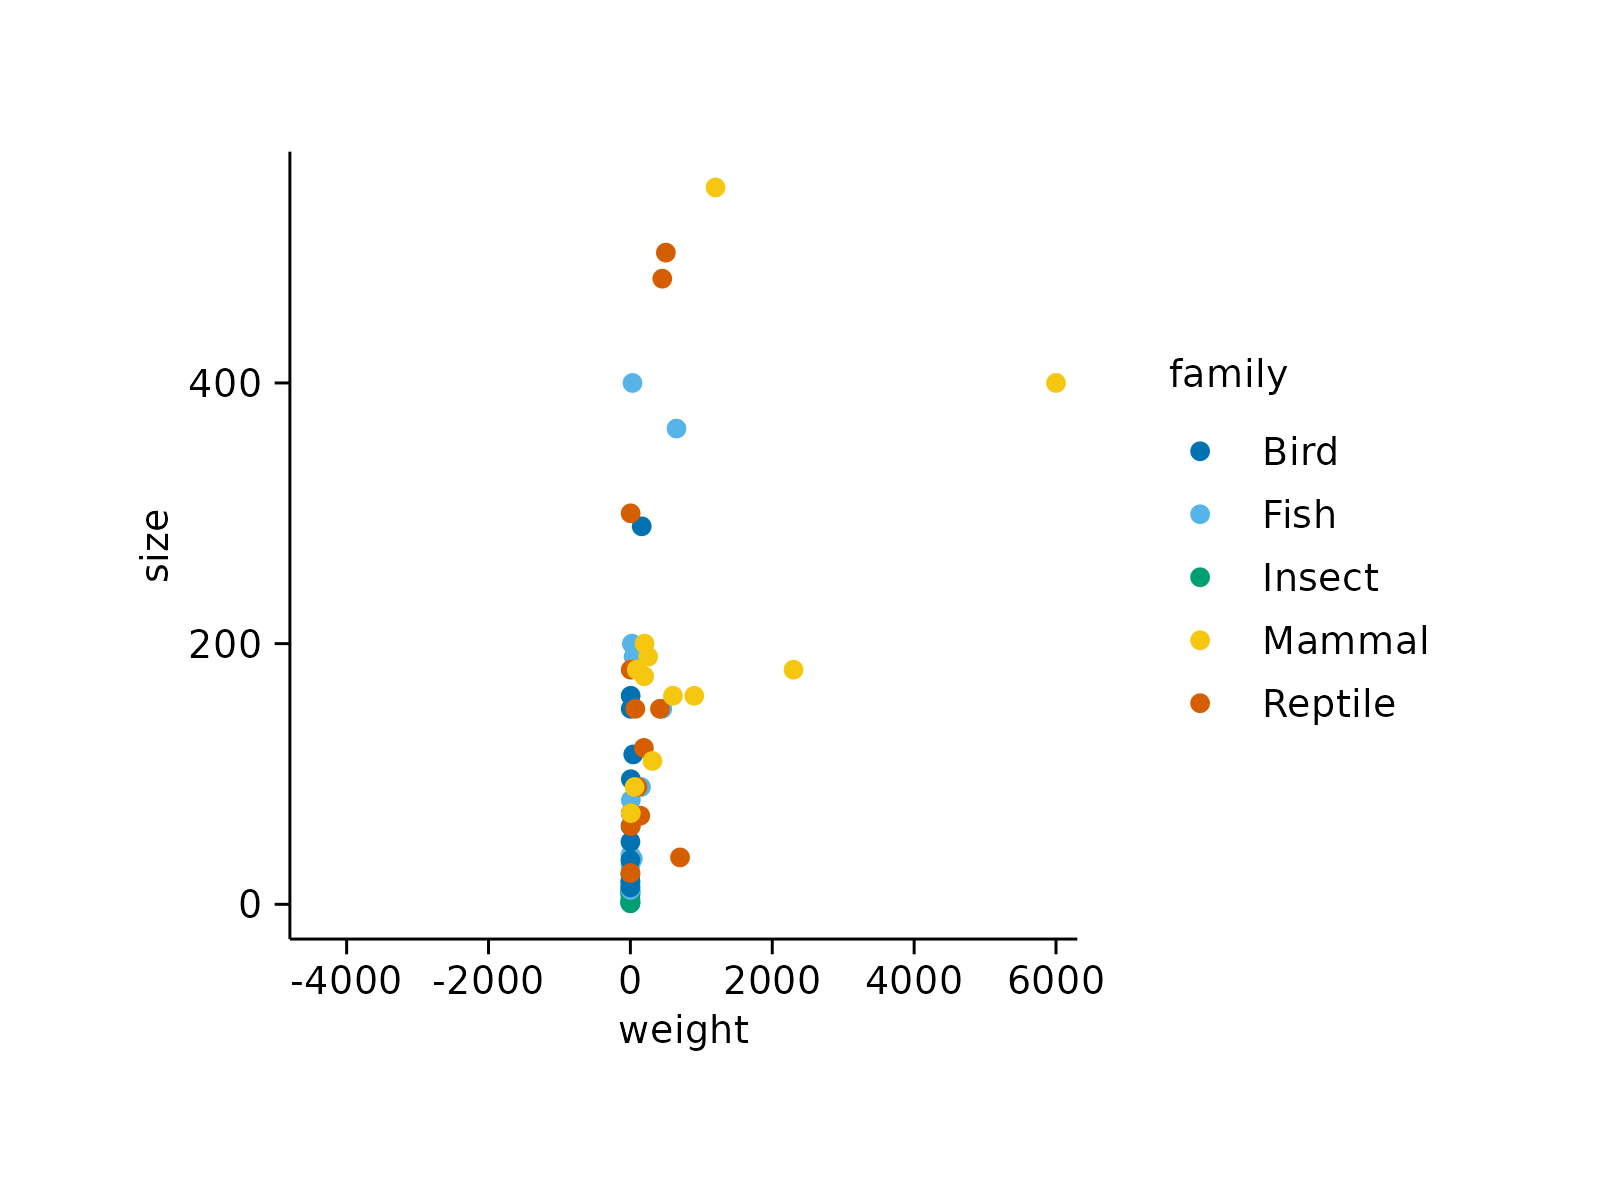
# Increase plot area padding
animals |>
tidyplot(x = weight, y = size, color = family) |>
add_data_points() |>
adjust_padding(all = 0.2)
 animals |>
tidyplot(x = weight, y = size, color = family) |>
add_data_points() |>
adjust_padding(top = 0.8)
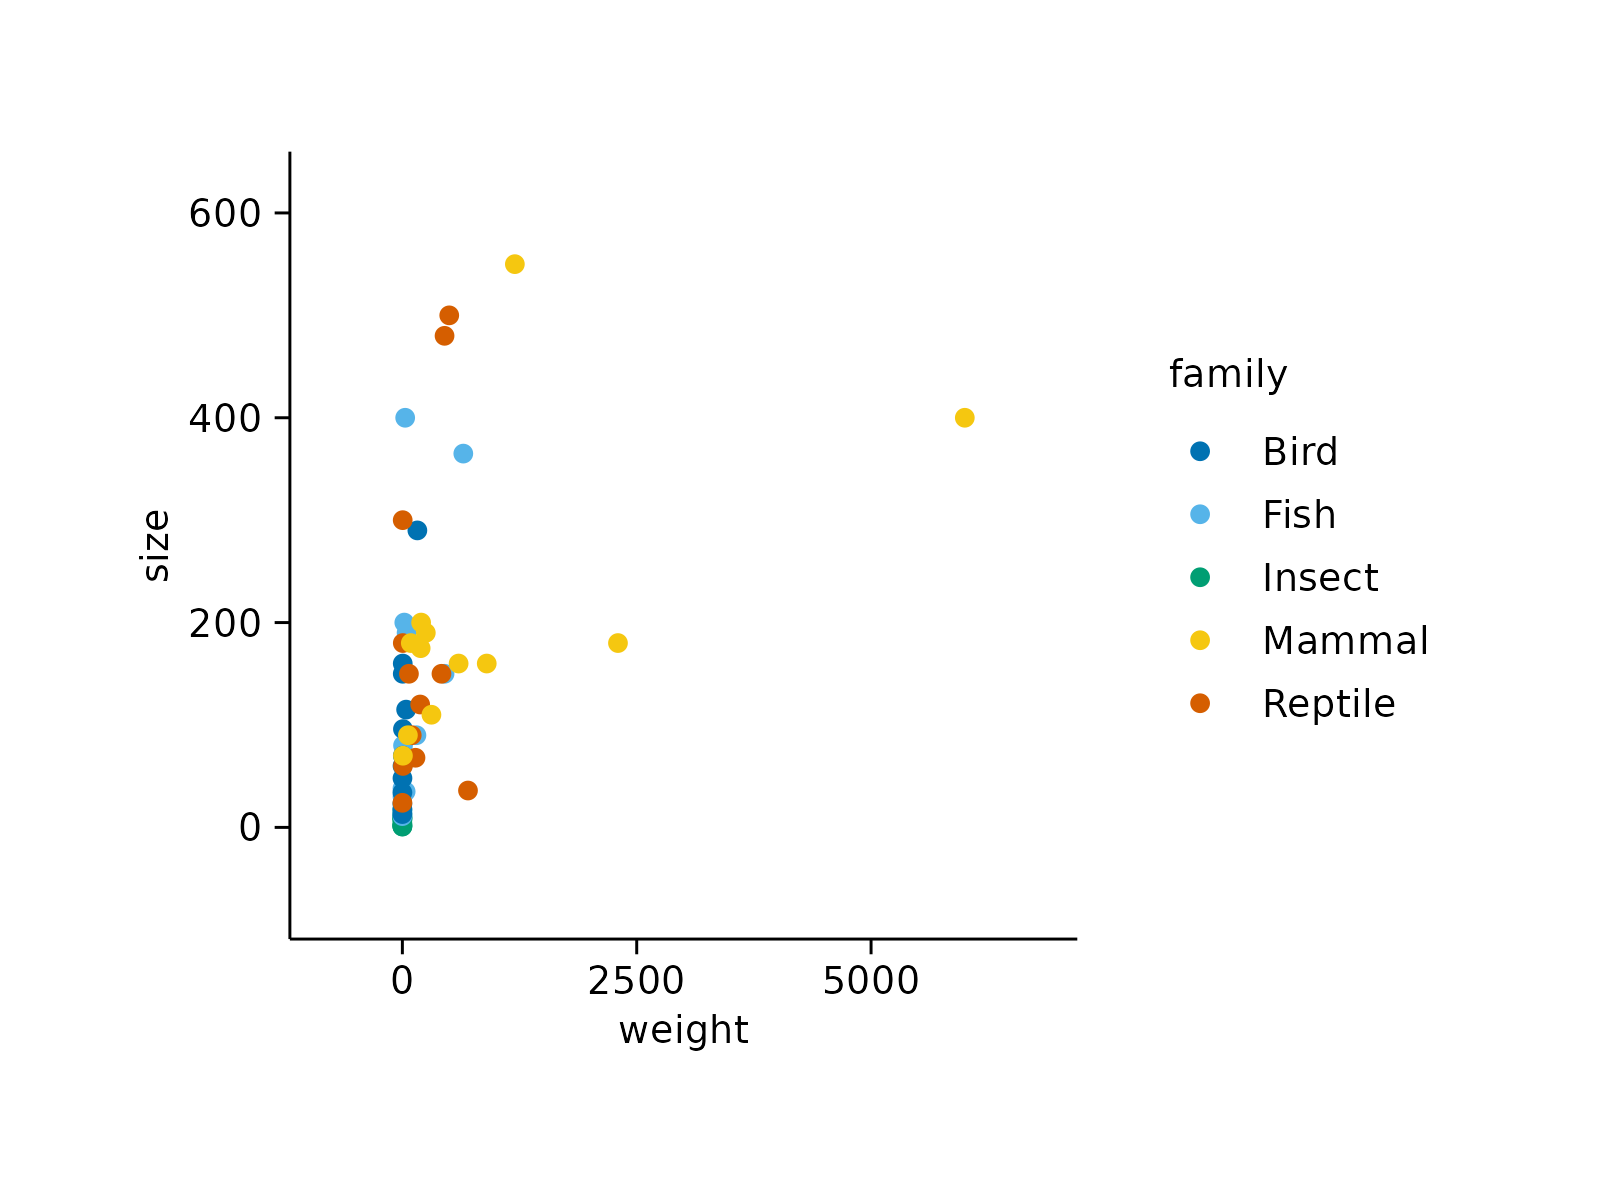
animals |>
tidyplot(x = weight, y = size, color = family) |>
add_data_points() |>
adjust_padding(top = 0.8)
 animals |>
tidyplot(x = weight, y = size, color = family) |>
add_data_points() |>
adjust_padding(bottom = 0.8)
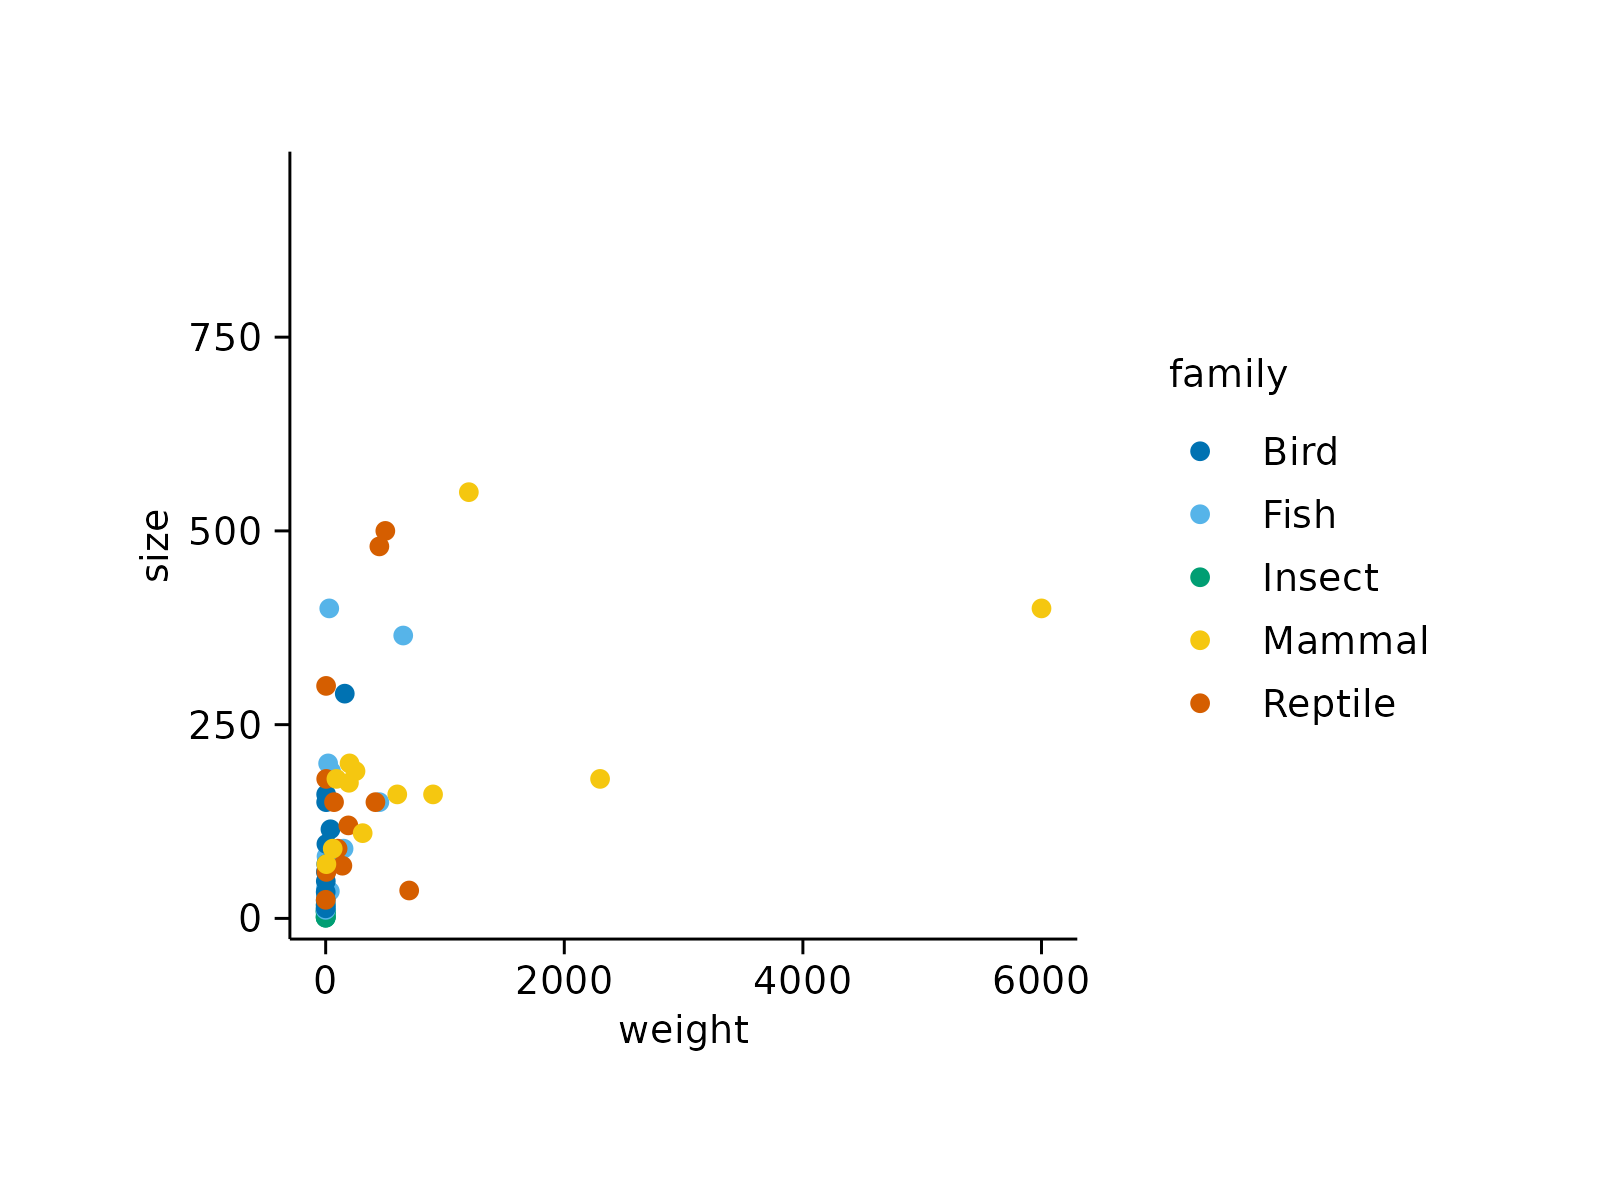
animals |>
tidyplot(x = weight, y = size, color = family) |>
add_data_points() |>
adjust_padding(bottom = 0.8)
 animals |>
tidyplot(x = weight, y = size, color = family) |>
add_data_points() |>
adjust_padding(right = 0.8)
animals |>
tidyplot(x = weight, y = size, color = family) |>
add_data_points() |>
adjust_padding(right = 0.8)
 animals |>
tidyplot(x = weight, y = size, color = family) |>
add_data_points() |>
adjust_padding(left = 0.8)
animals |>
tidyplot(x = weight, y = size, color = family) |>
add_data_points() |>
adjust_padding(left = 0.8)