add_sem_ribbon()adds the standard error of mean.add_range_ribbon()adds the range from smallest to largest value.add_sd_ribbon()adds the standard deviation.add_ci95_ribbon()adds the 95% confidence interval.
Usage
add_sem_ribbon(plot, dodge_width = NULL, alpha = 0.4, color = NA, ...)

add_range_ribbon(plot, dodge_width = NULL, alpha = 0.4, color = NA, ...)

add_sd_ribbon(plot, dodge_width = NULL, alpha = 0.4, color = NA, ...)

add_ci95_ribbon(plot, dodge_width = NULL, alpha = 0.4, color = NA, ...)
Arguments
- plot
A
tidyplotgenerated with the functiontidyplot().- dodge_width
For adjusting the distance between grouped objects. Defaults to
0.8for plots with at least one discrete axis and0for plots with two continuous axes.- alpha
A
numberbetween0and1for the opacity of an object. A value of0is completely transparent,1is completely opaque.- color
A hex color for the stroke color. For example,
"#FFFFFF"for white.- ...
Arguments passed on to the
geomfunction.
Examples
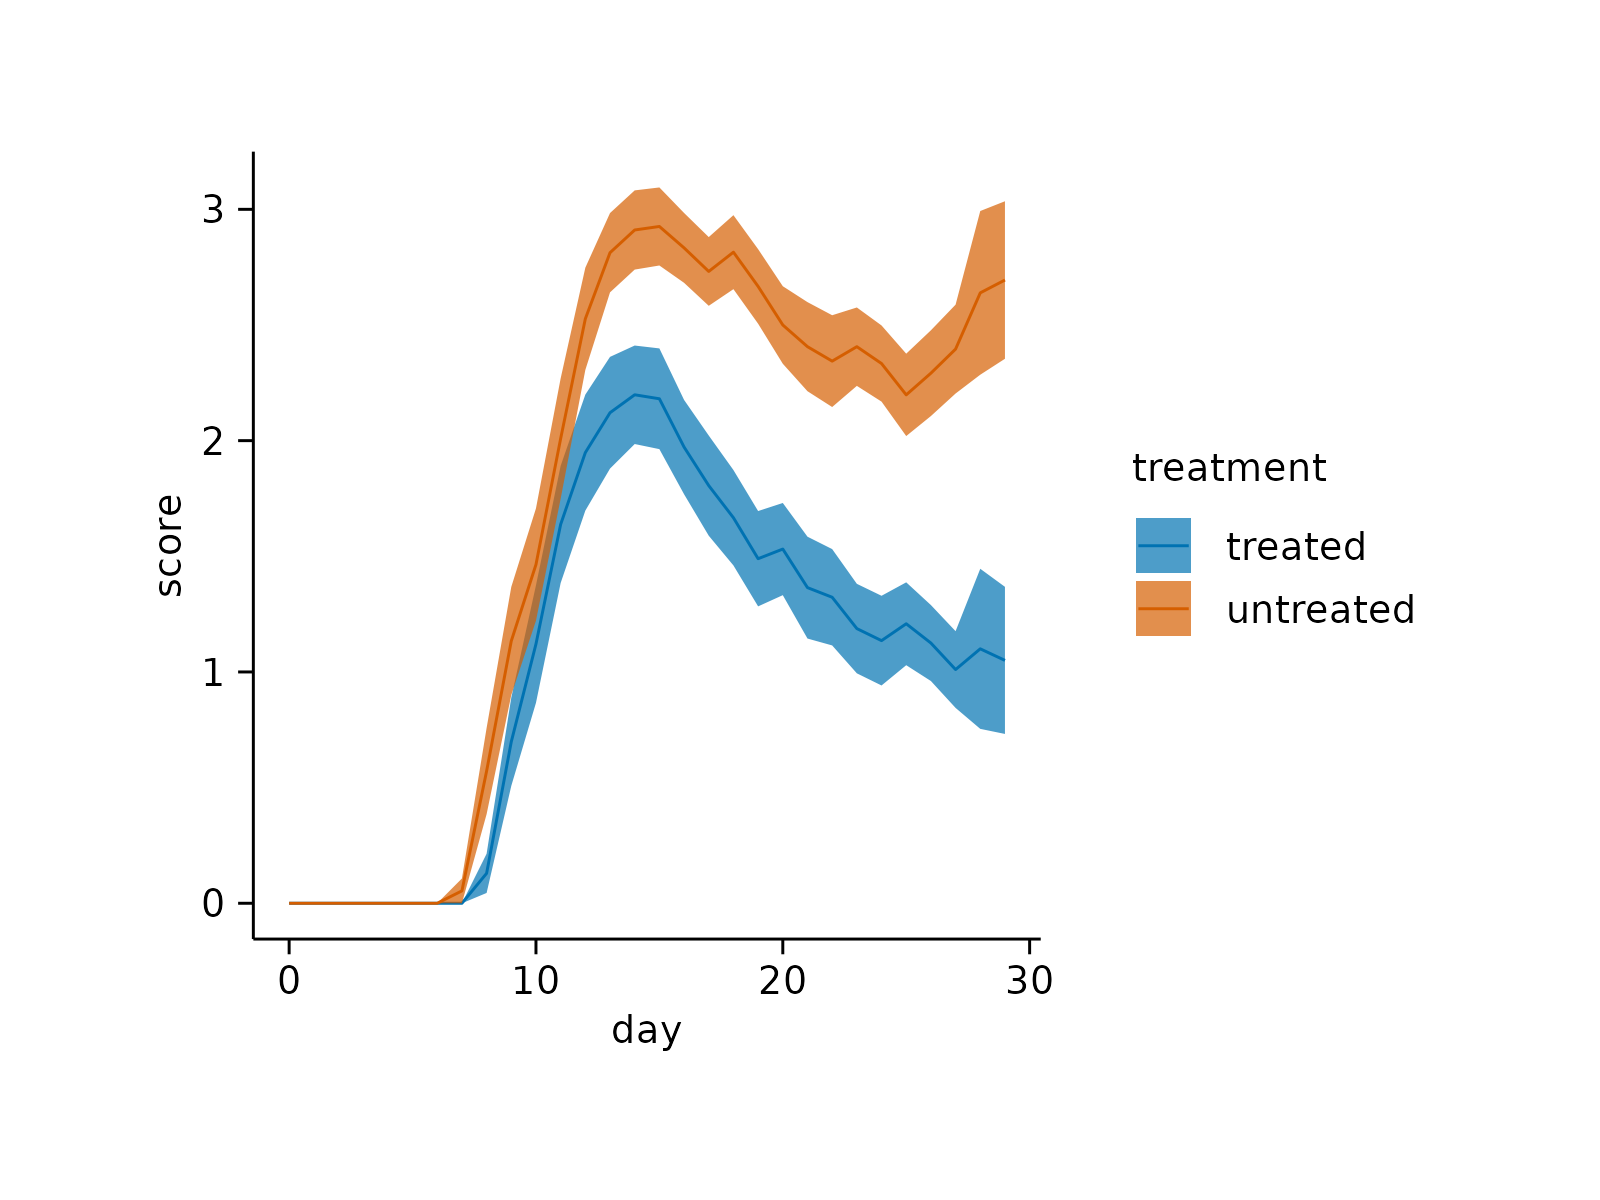
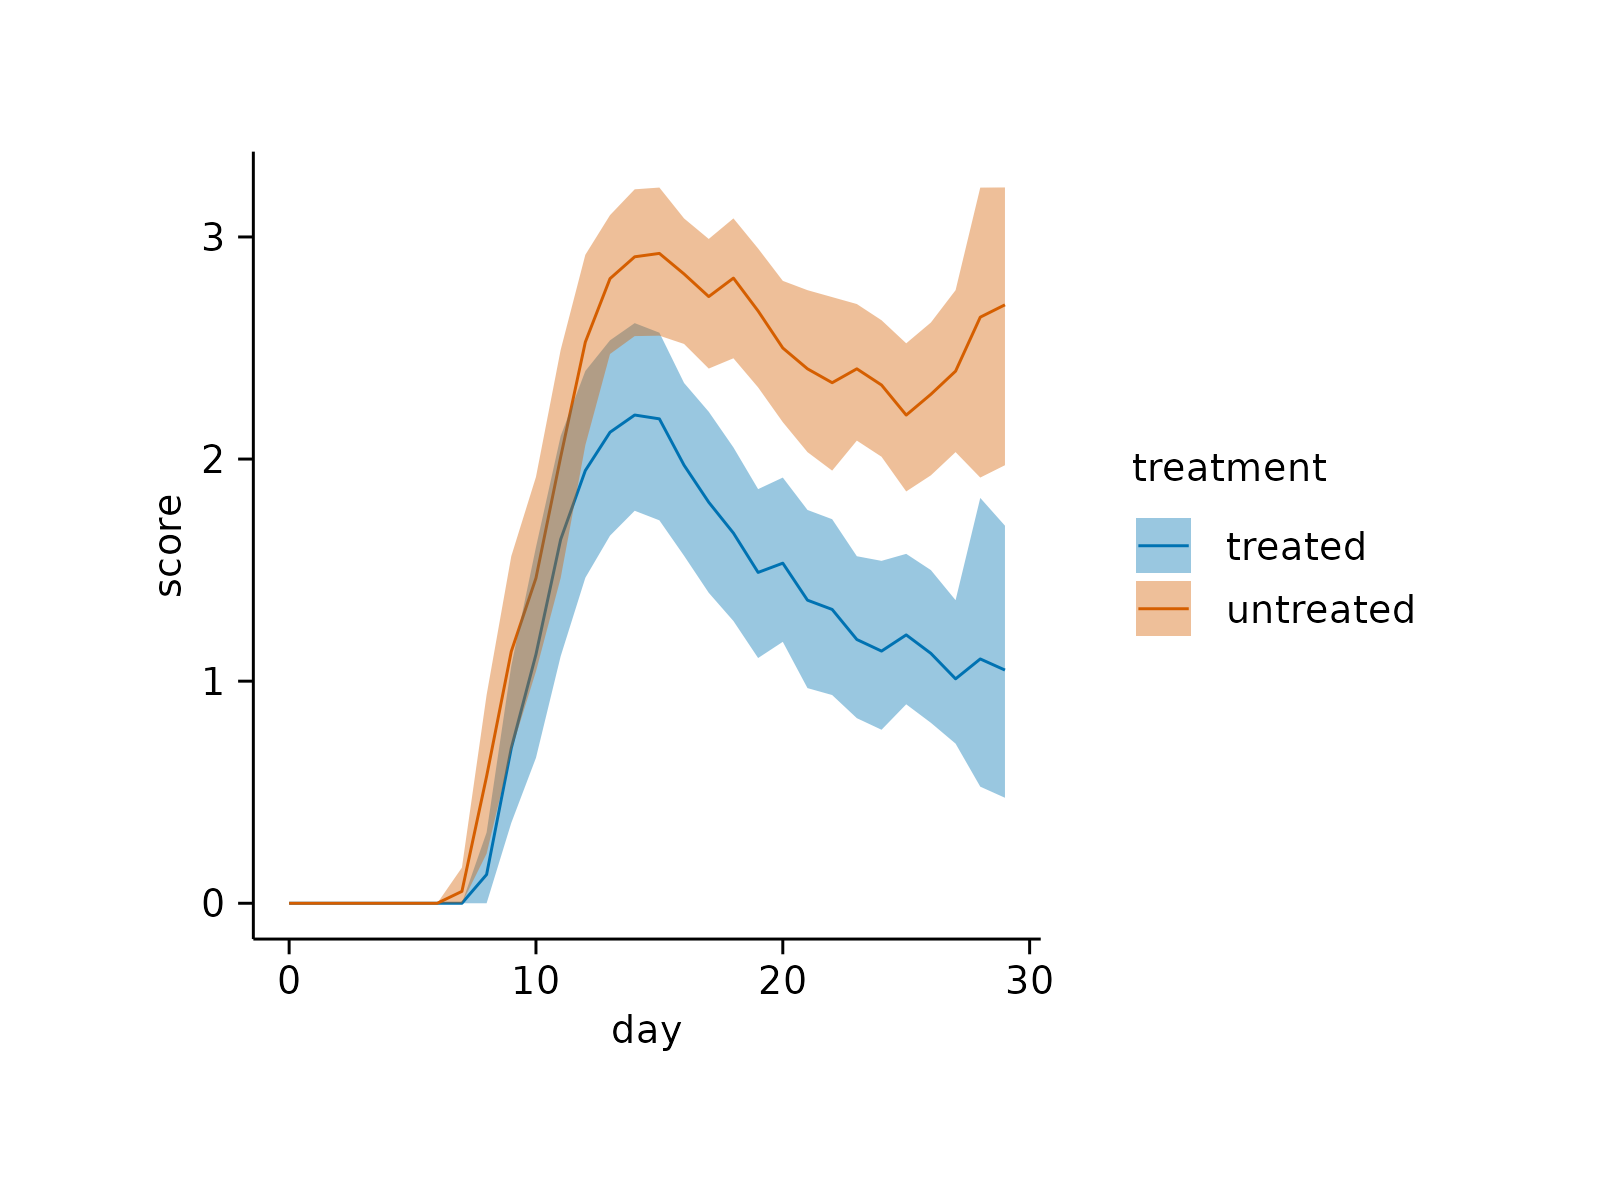
# Standard error of the mean
time_course |>
tidyplot(x = day, y = score, color = treatment) |>
add_mean_line() |>
add_sem_ribbon()
#> Warning: Removed 170 rows containing non-finite outside the scale range
#> (`stat_summary()`).
#> Warning: Removed 170 rows containing non-finite outside the scale range
#> (`stat_summary()`).
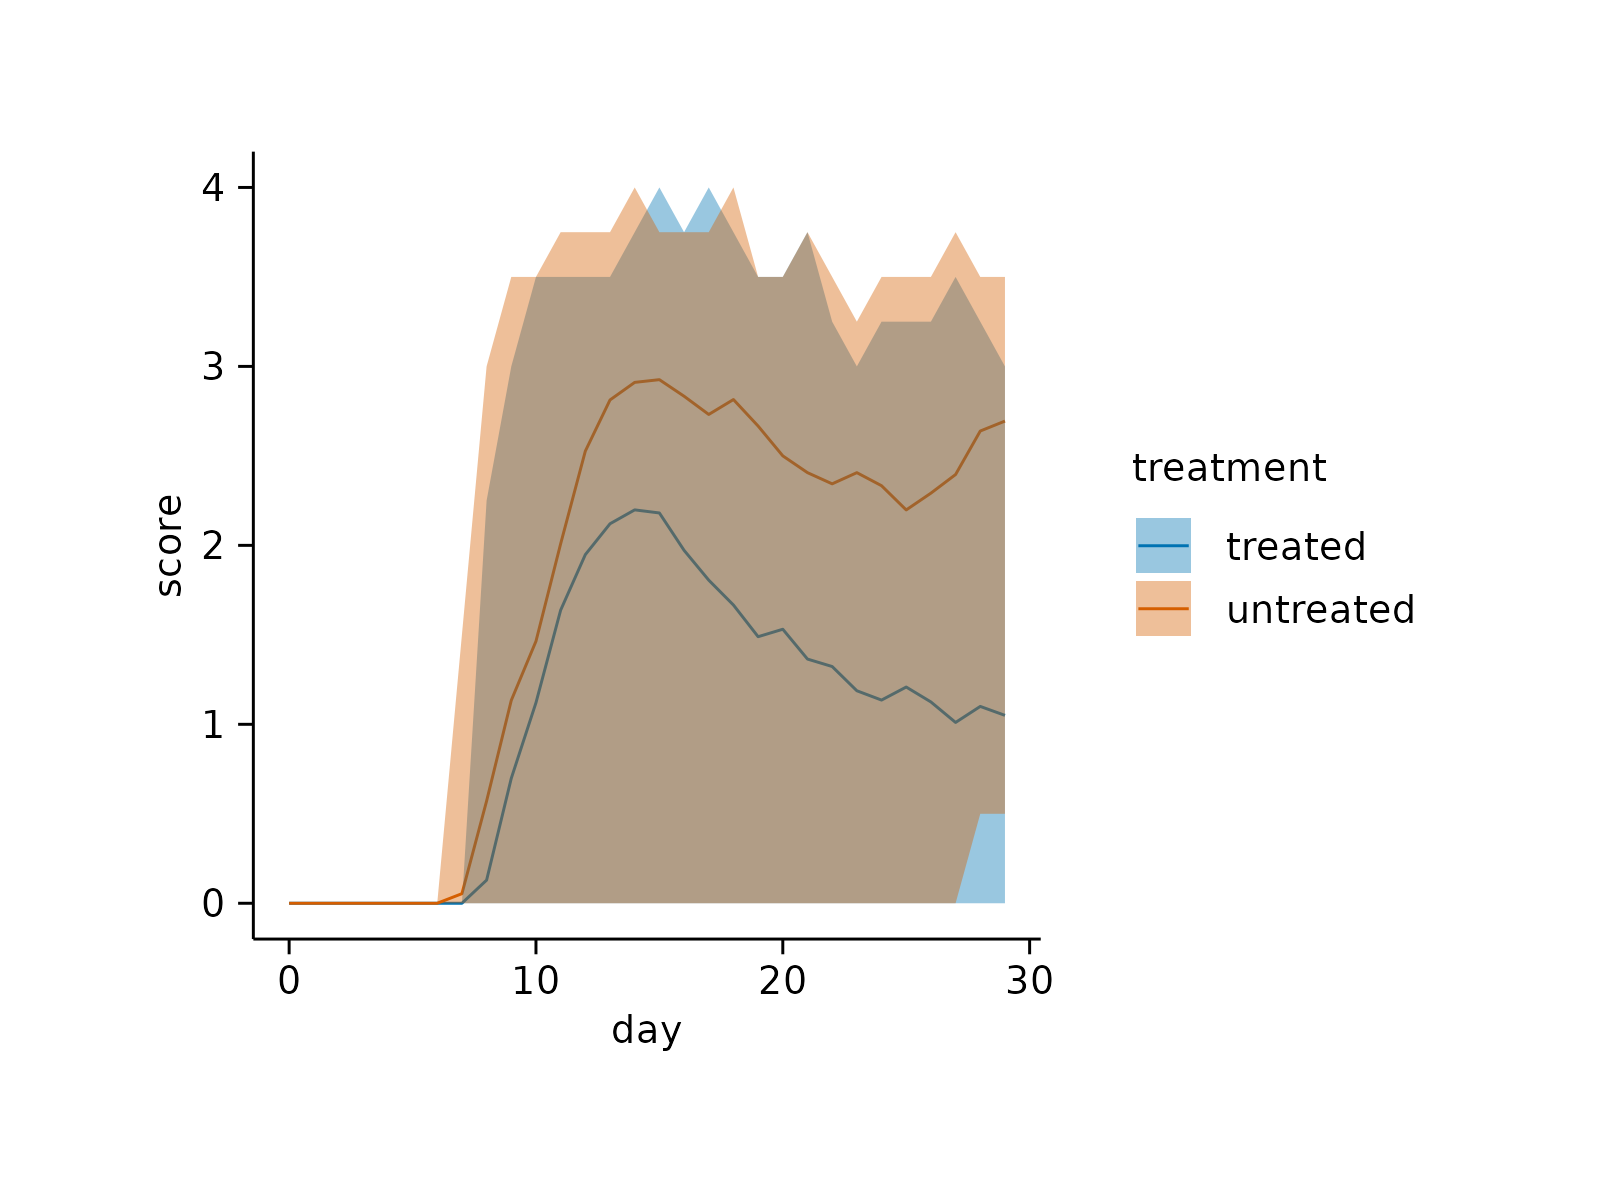
 # Range from minimum to maximum value
time_course |>
tidyplot(x = day, y = score, color = treatment) |>
add_mean_line() |>
add_range_ribbon()
#> Warning: Removed 170 rows containing non-finite outside the scale range
#> (`stat_summary()`).
#> Warning: Removed 170 rows containing non-finite outside the scale range
#> (`stat_summary()`).
# Range from minimum to maximum value
time_course |>
tidyplot(x = day, y = score, color = treatment) |>
add_mean_line() |>
add_range_ribbon()
#> Warning: Removed 170 rows containing non-finite outside the scale range
#> (`stat_summary()`).
#> Warning: Removed 170 rows containing non-finite outside the scale range
#> (`stat_summary()`).
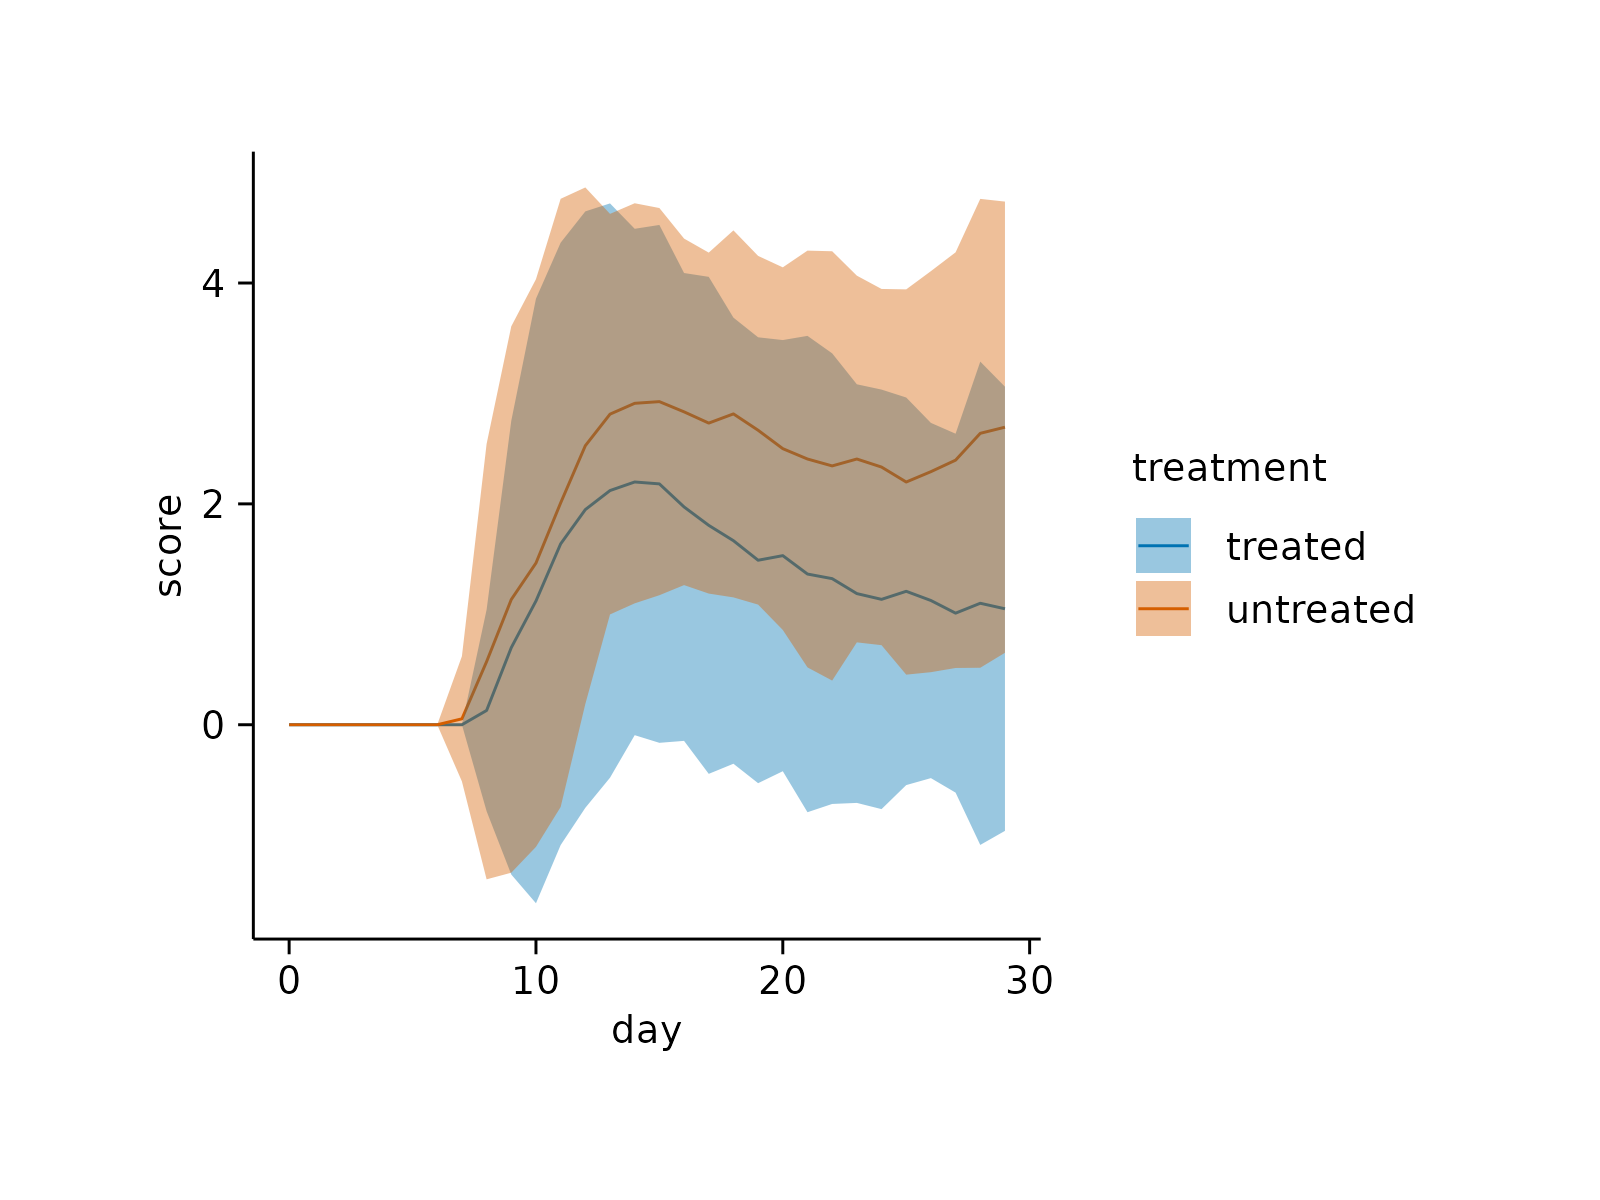
 # Standard deviation
time_course |>
tidyplot(x = day, y = score, color = treatment) |>
add_mean_line() |>
add_sd_ribbon()
#> Warning: Removed 170 rows containing non-finite outside the scale range
#> (`stat_summary()`).
#> Warning: Removed 170 rows containing non-finite outside the scale range
#> (`stat_summary()`).
# Standard deviation
time_course |>
tidyplot(x = day, y = score, color = treatment) |>
add_mean_line() |>
add_sd_ribbon()
#> Warning: Removed 170 rows containing non-finite outside the scale range
#> (`stat_summary()`).
#> Warning: Removed 170 rows containing non-finite outside the scale range
#> (`stat_summary()`).
 # 95% confidence interval
time_course |>
tidyplot(x = day, y = score, color = treatment) |>
add_mean_line() |>
add_ci95_ribbon()
#> Warning: Removed 170 rows containing non-finite outside the scale range
#> (`stat_summary()`).
#> Warning: Removed 170 rows containing non-finite outside the scale range
#> (`stat_summary()`).
# 95% confidence interval
time_course |>
tidyplot(x = day, y = score, color = treatment) |>
add_mean_line() |>
add_ci95_ribbon()
#> Warning: Removed 170 rows containing non-finite outside the scale range
#> (`stat_summary()`).
#> Warning: Removed 170 rows containing non-finite outside the scale range
#> (`stat_summary()`).
 # Changing arguments: alpha
time_course |>
tidyplot(x = day, y = score, color = treatment) |>
add_mean_line() |>
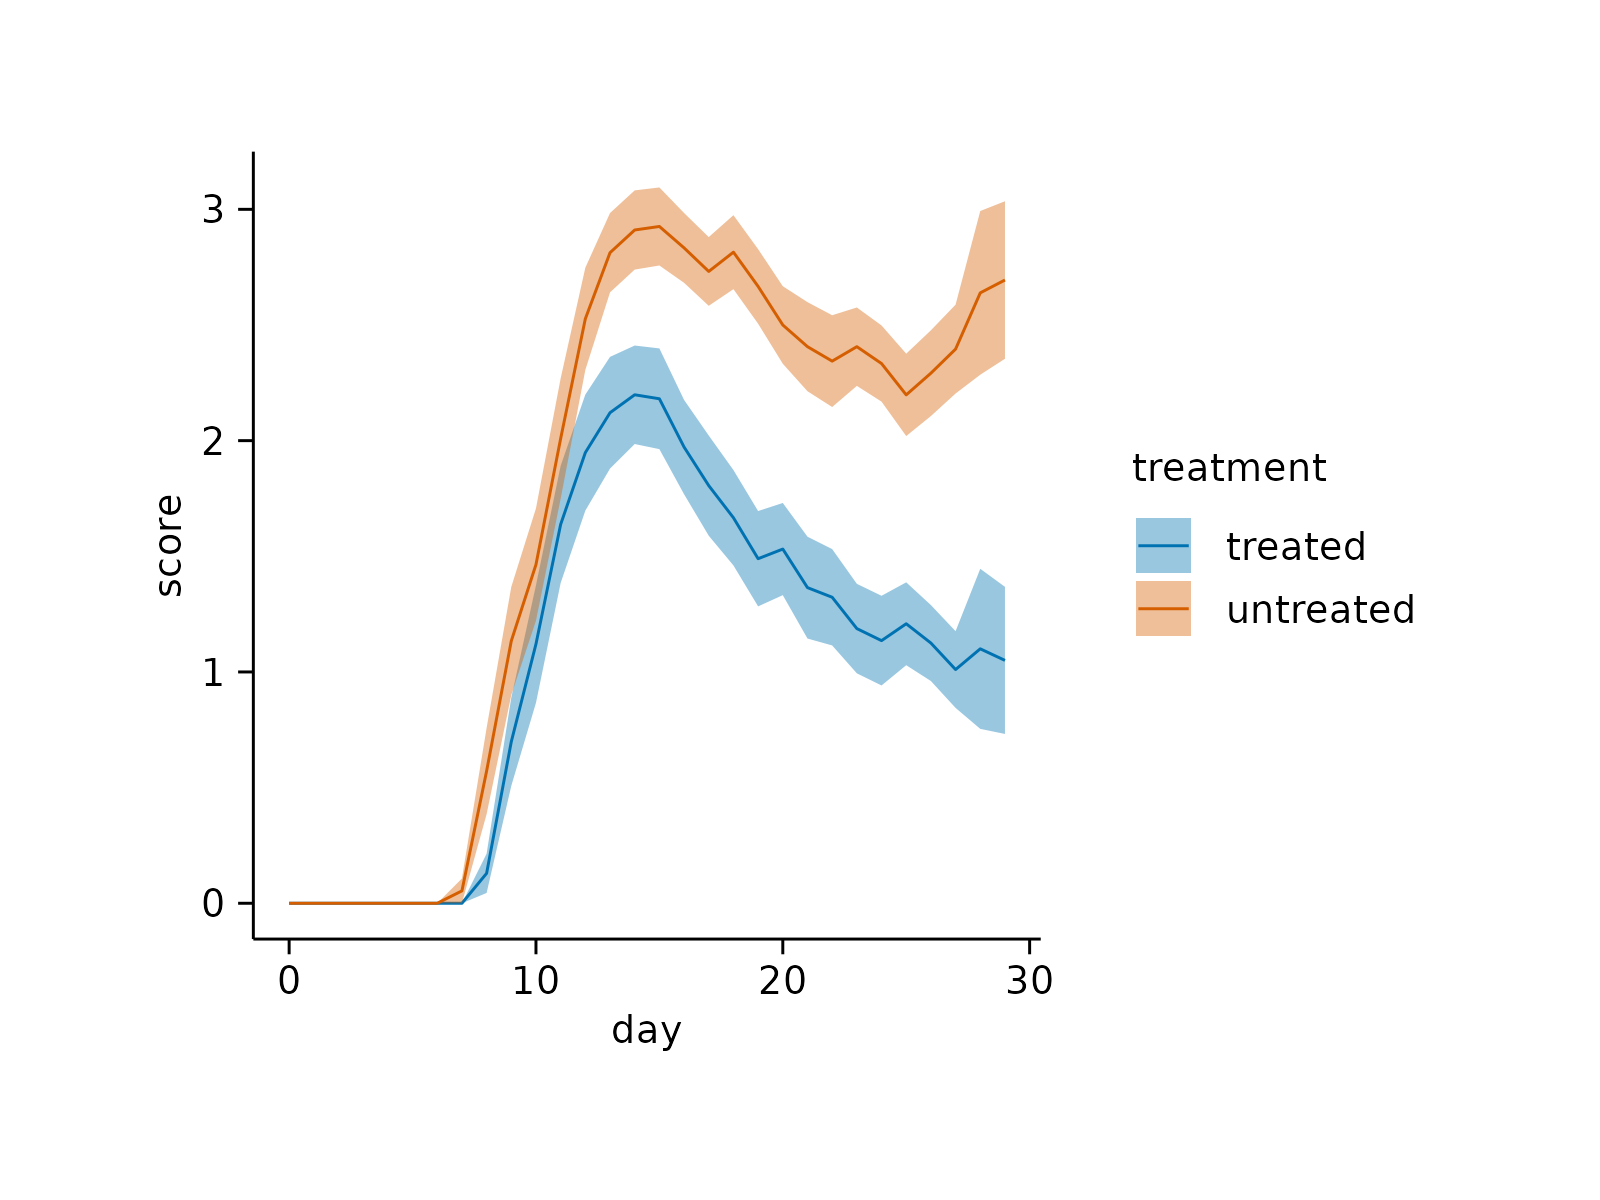
add_sem_ribbon(alpha = 0.7)
#> Warning: Removed 170 rows containing non-finite outside the scale range
#> (`stat_summary()`).
#> Warning: Removed 170 rows containing non-finite outside the scale range
#> (`stat_summary()`).
# Changing arguments: alpha
time_course |>
tidyplot(x = day, y = score, color = treatment) |>
add_mean_line() |>
add_sem_ribbon(alpha = 0.7)
#> Warning: Removed 170 rows containing non-finite outside the scale range
#> (`stat_summary()`).
#> Warning: Removed 170 rows containing non-finite outside the scale range
#> (`stat_summary()`).