Add reference lines
Arguments
- plot
A
tidyplotgenerated with the functiontidyplot().- x
Numeric values where the reference lines should meet the x-axis. For example,
x = 4orx = c(2,3,4).- y
Numeric values where the reference lines should meet the y-axis. For example,
y = 4ory = c(2,3,4).- linetype
Either an integer (0-6) or a name (0 = blank, 1 = solid, 2 = dashed, 3 = dotted, 4 = dotdash, 5 = longdash, 6 = twodash).
- linewidth
Thickness of the line in points (pt). Typical values range between
0.25and1.- ...
Arguments passed on to the
geomfunction.
Examples
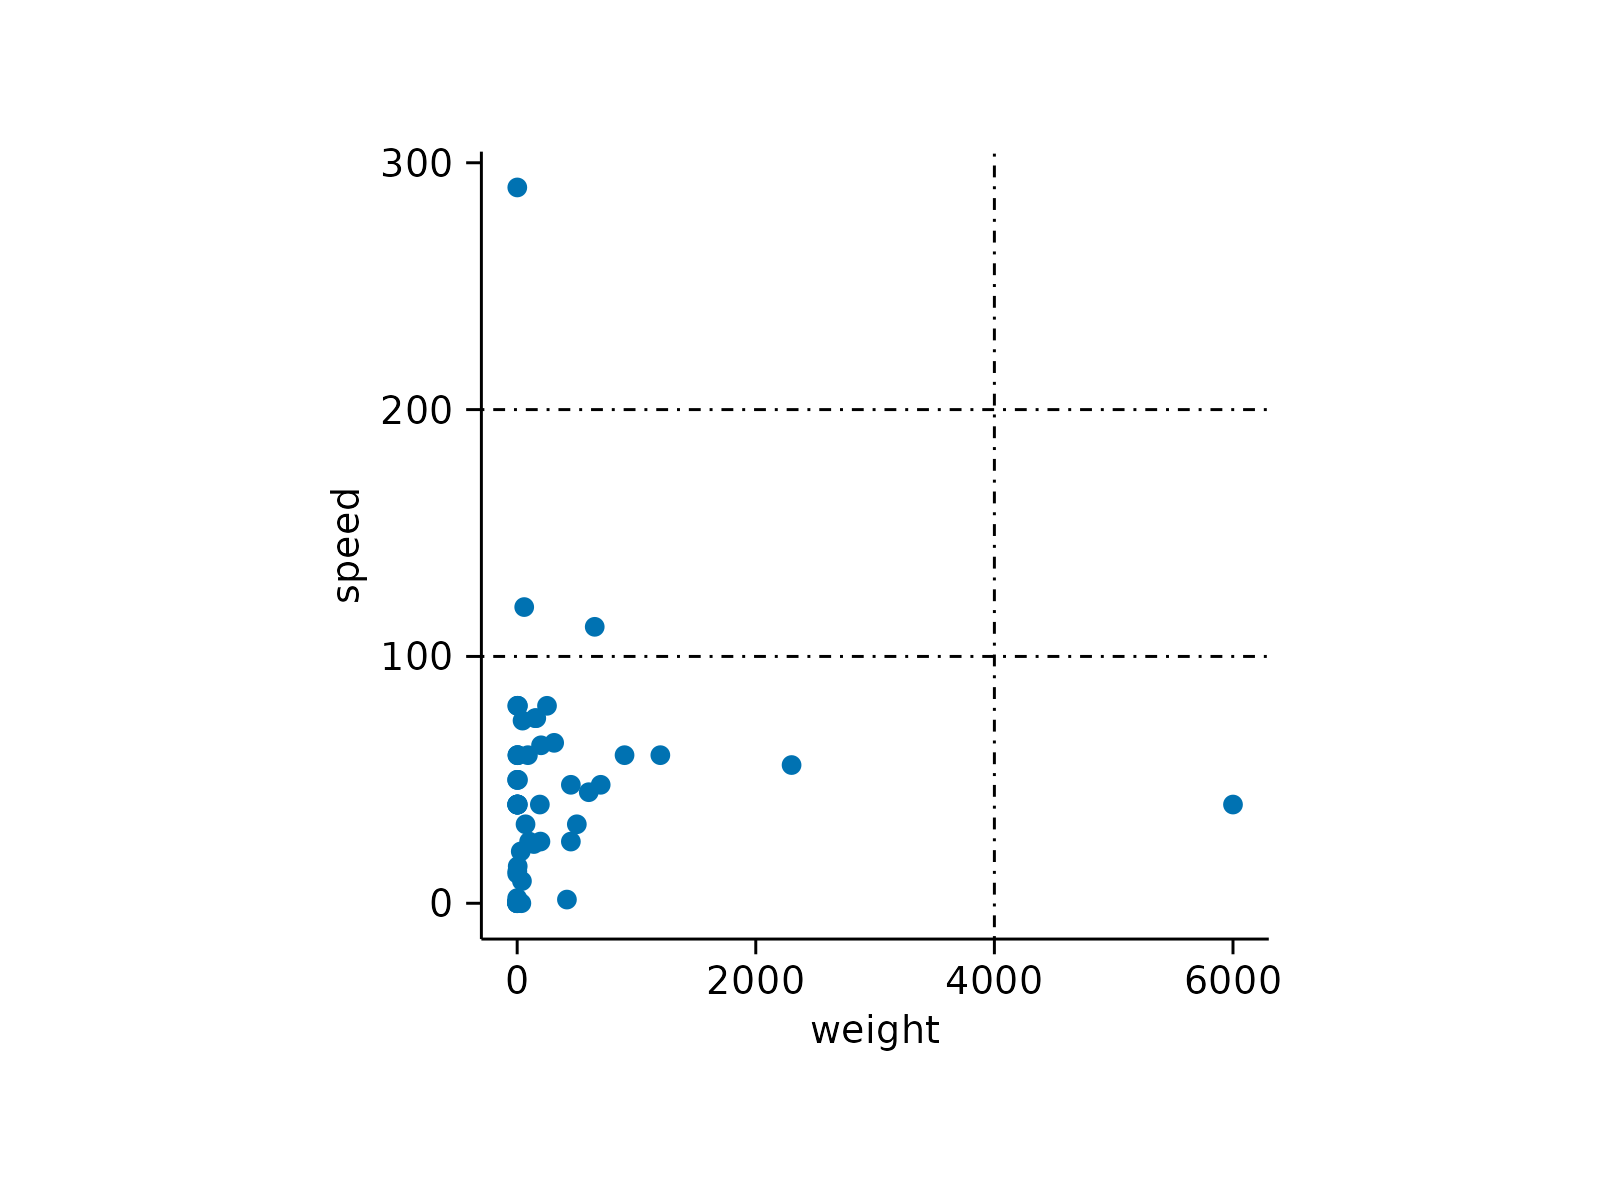
animals |>
tidyplot(x = weight, y = speed) |>
add_reference_lines(x = 4000, y = c(100, 200)) |>
add_data_points()
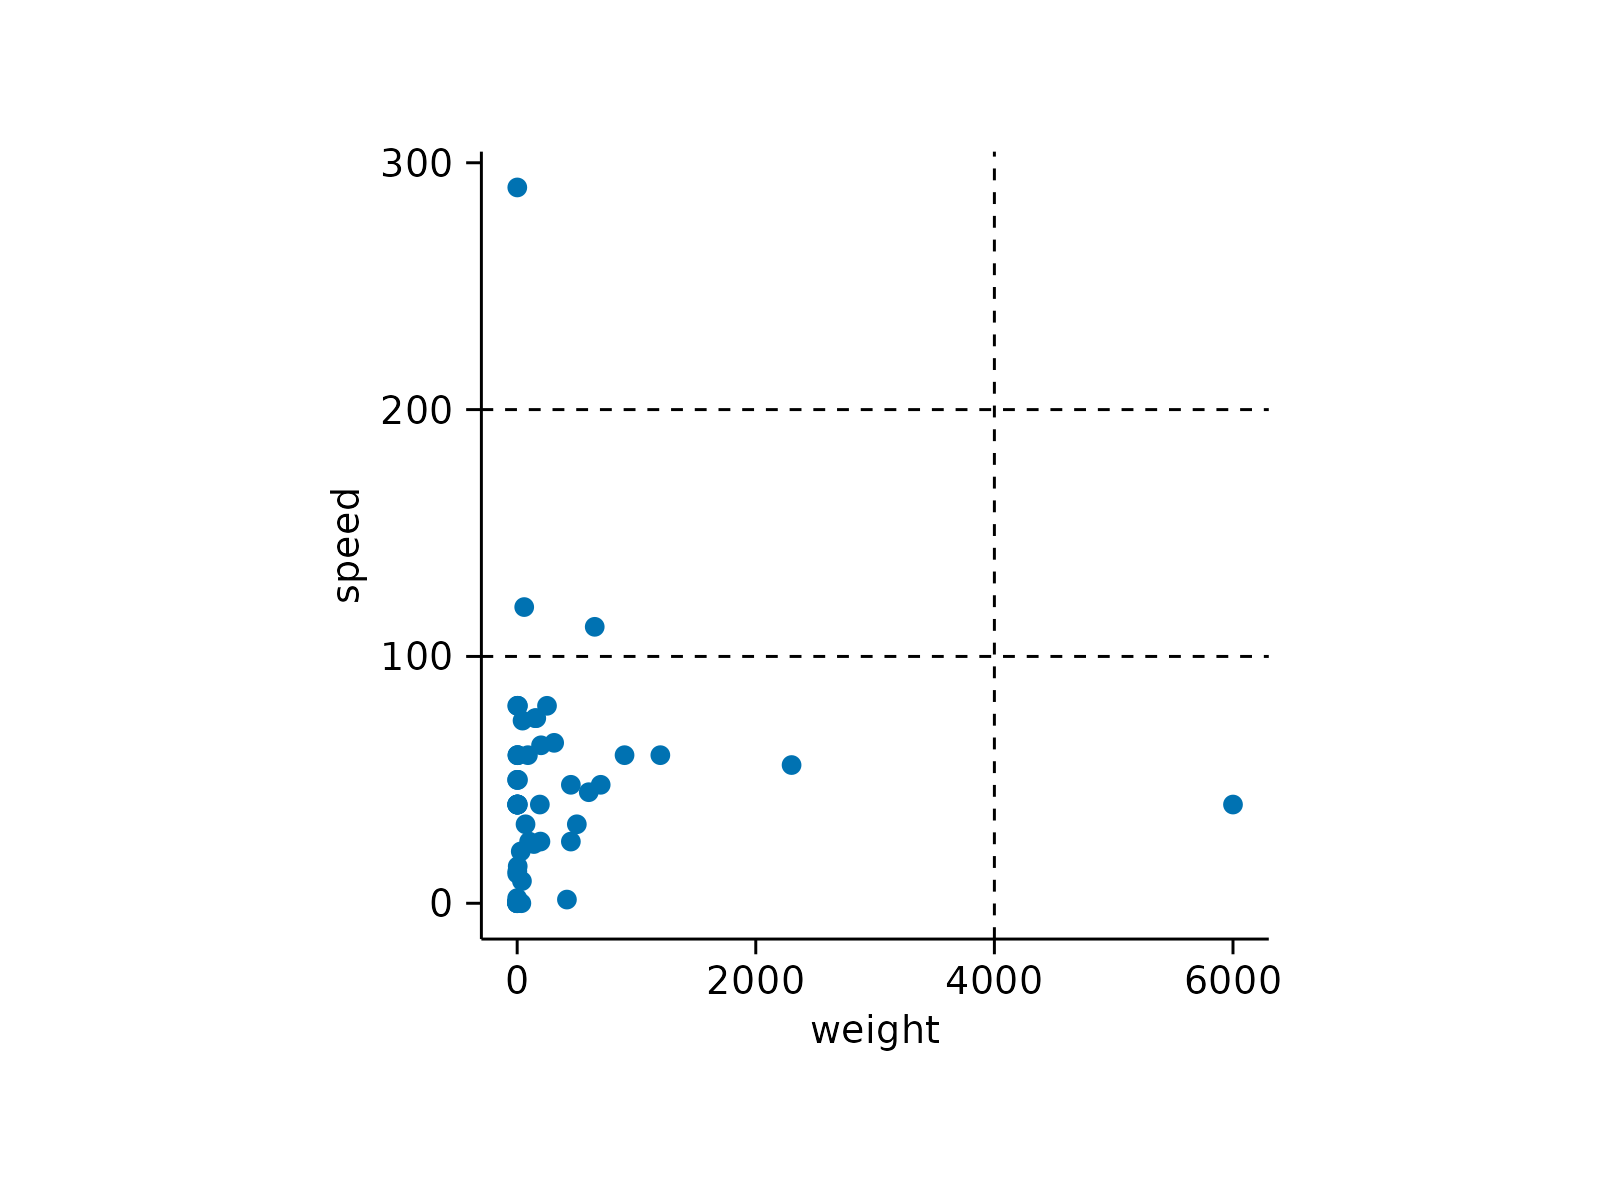 animals |>
tidyplot(x = weight, y = speed) |>
add_reference_lines(x = 4000, y = c(100, 200), linetype = "dotdash") |>
add_data_points()
animals |>
tidyplot(x = weight, y = speed) |>
add_reference_lines(x = 4000, y = c(100, 200), linetype = "dotdash") |>
add_data_points()