add_error_ribbon()adds the standard error of mean.add_range_ribbon()adds the range from smallest to largest value.add_sd_ribbon()adds the standard deviation.add_ci95_ribbon()adds the 95% confidence interval.
Usage
add_error_ribbon(plot, dodge_width = NULL, alpha = 0.3, color = NA, ...)

add_range_ribbon(plot, dodge_width = NULL, alpha = 0.3, color = NA, ...)

add_sd_ribbon(plot, dodge_width = NULL, alpha = 0.3, color = NA, ...)

add_ci95_ribbon(plot, dodge_width = NULL, alpha = 0.3, color = NA, ...)
Arguments
- plot
A
tidyplotgenerated with the functiontidyplot().- dodge_width
For adjusting the distance between grouped objects.
- alpha
common
- color
common
- ...
Arguments passed on to the
geomfunction.
Examples
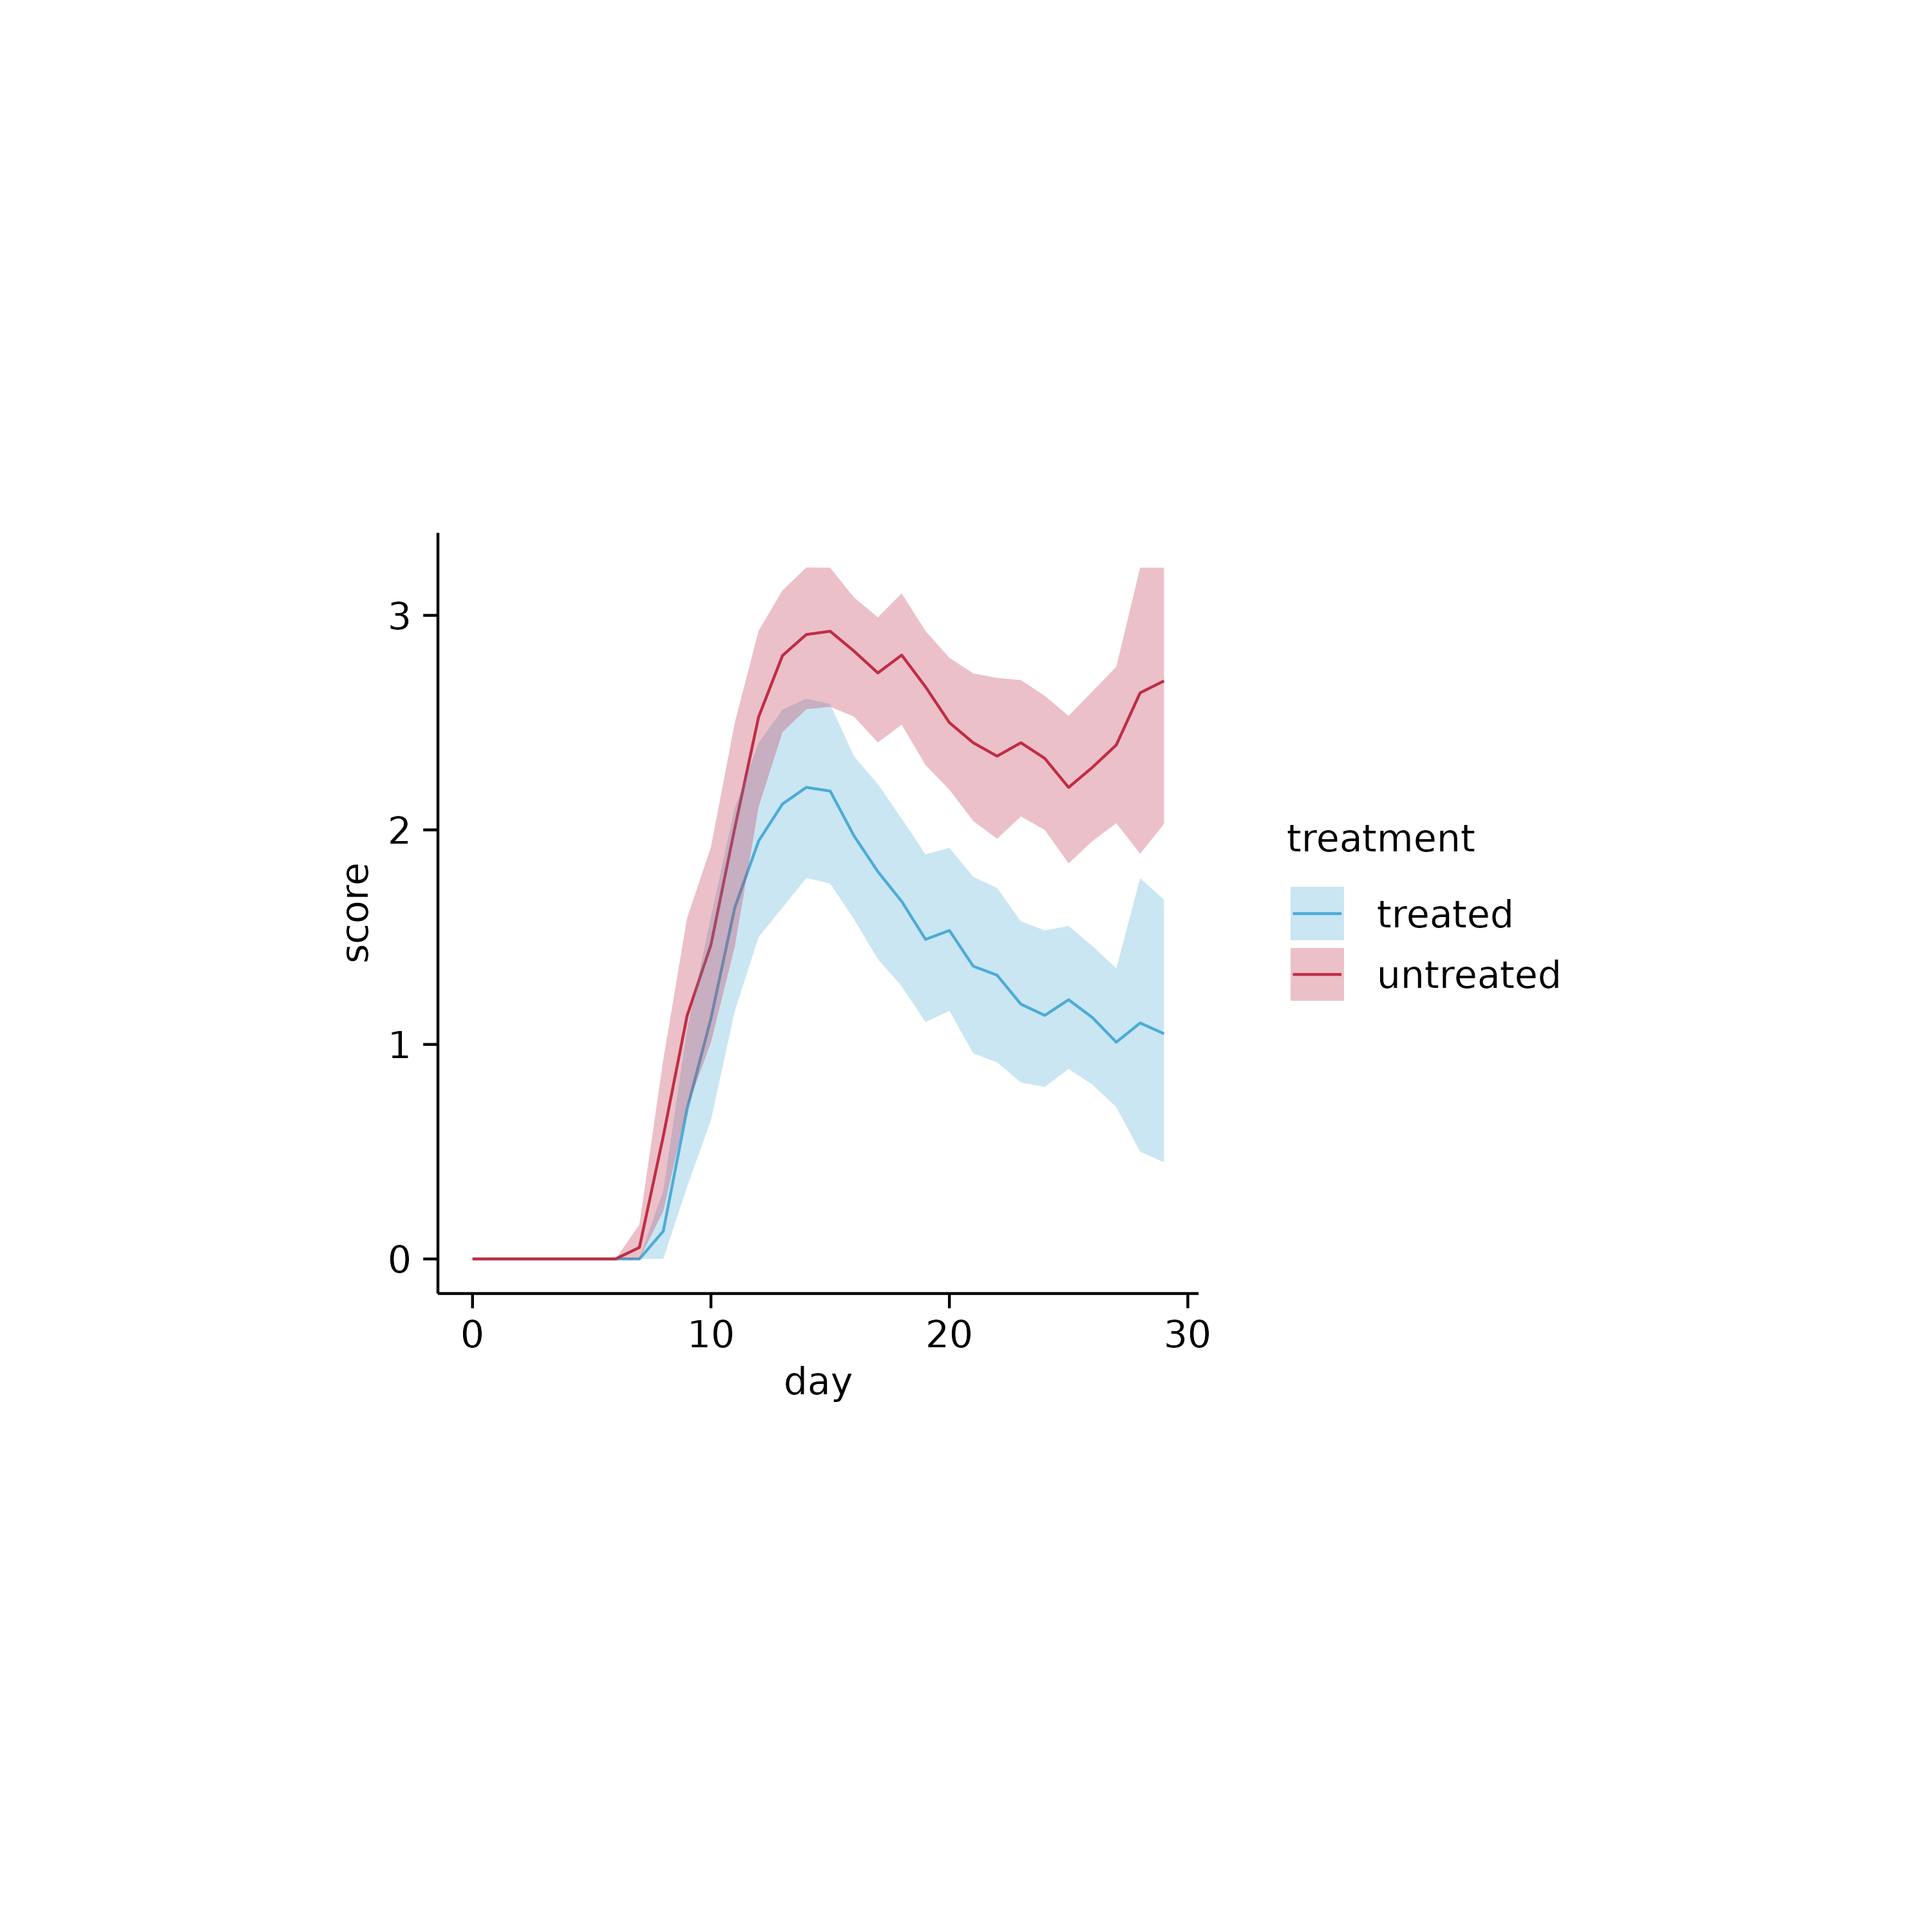
time_course %>%
tidyplot(x = day, y = score, color = treatment, dodge_width = 0) %>%
add_mean_line() %>%
add_error_ribbon()
#> ✔ adjust_x_axis: continuous
#> ✔ adjust_y_axis: continuous
#> ℹ adjust_colors: Too many colors. 5 colors provided, but only 2 needed.
#> ✔ adjust_colors: applied discrete color values
#> ✔ adjust_plot_area_size: width = 50 mm, height = 50 mm
#> Warning: Removed 170 rows containing non-finite outside the scale range
#> (`stat_summary()`).
#> Warning: Removed 170 rows containing non-finite outside the scale range
#> (`stat_summary()`).
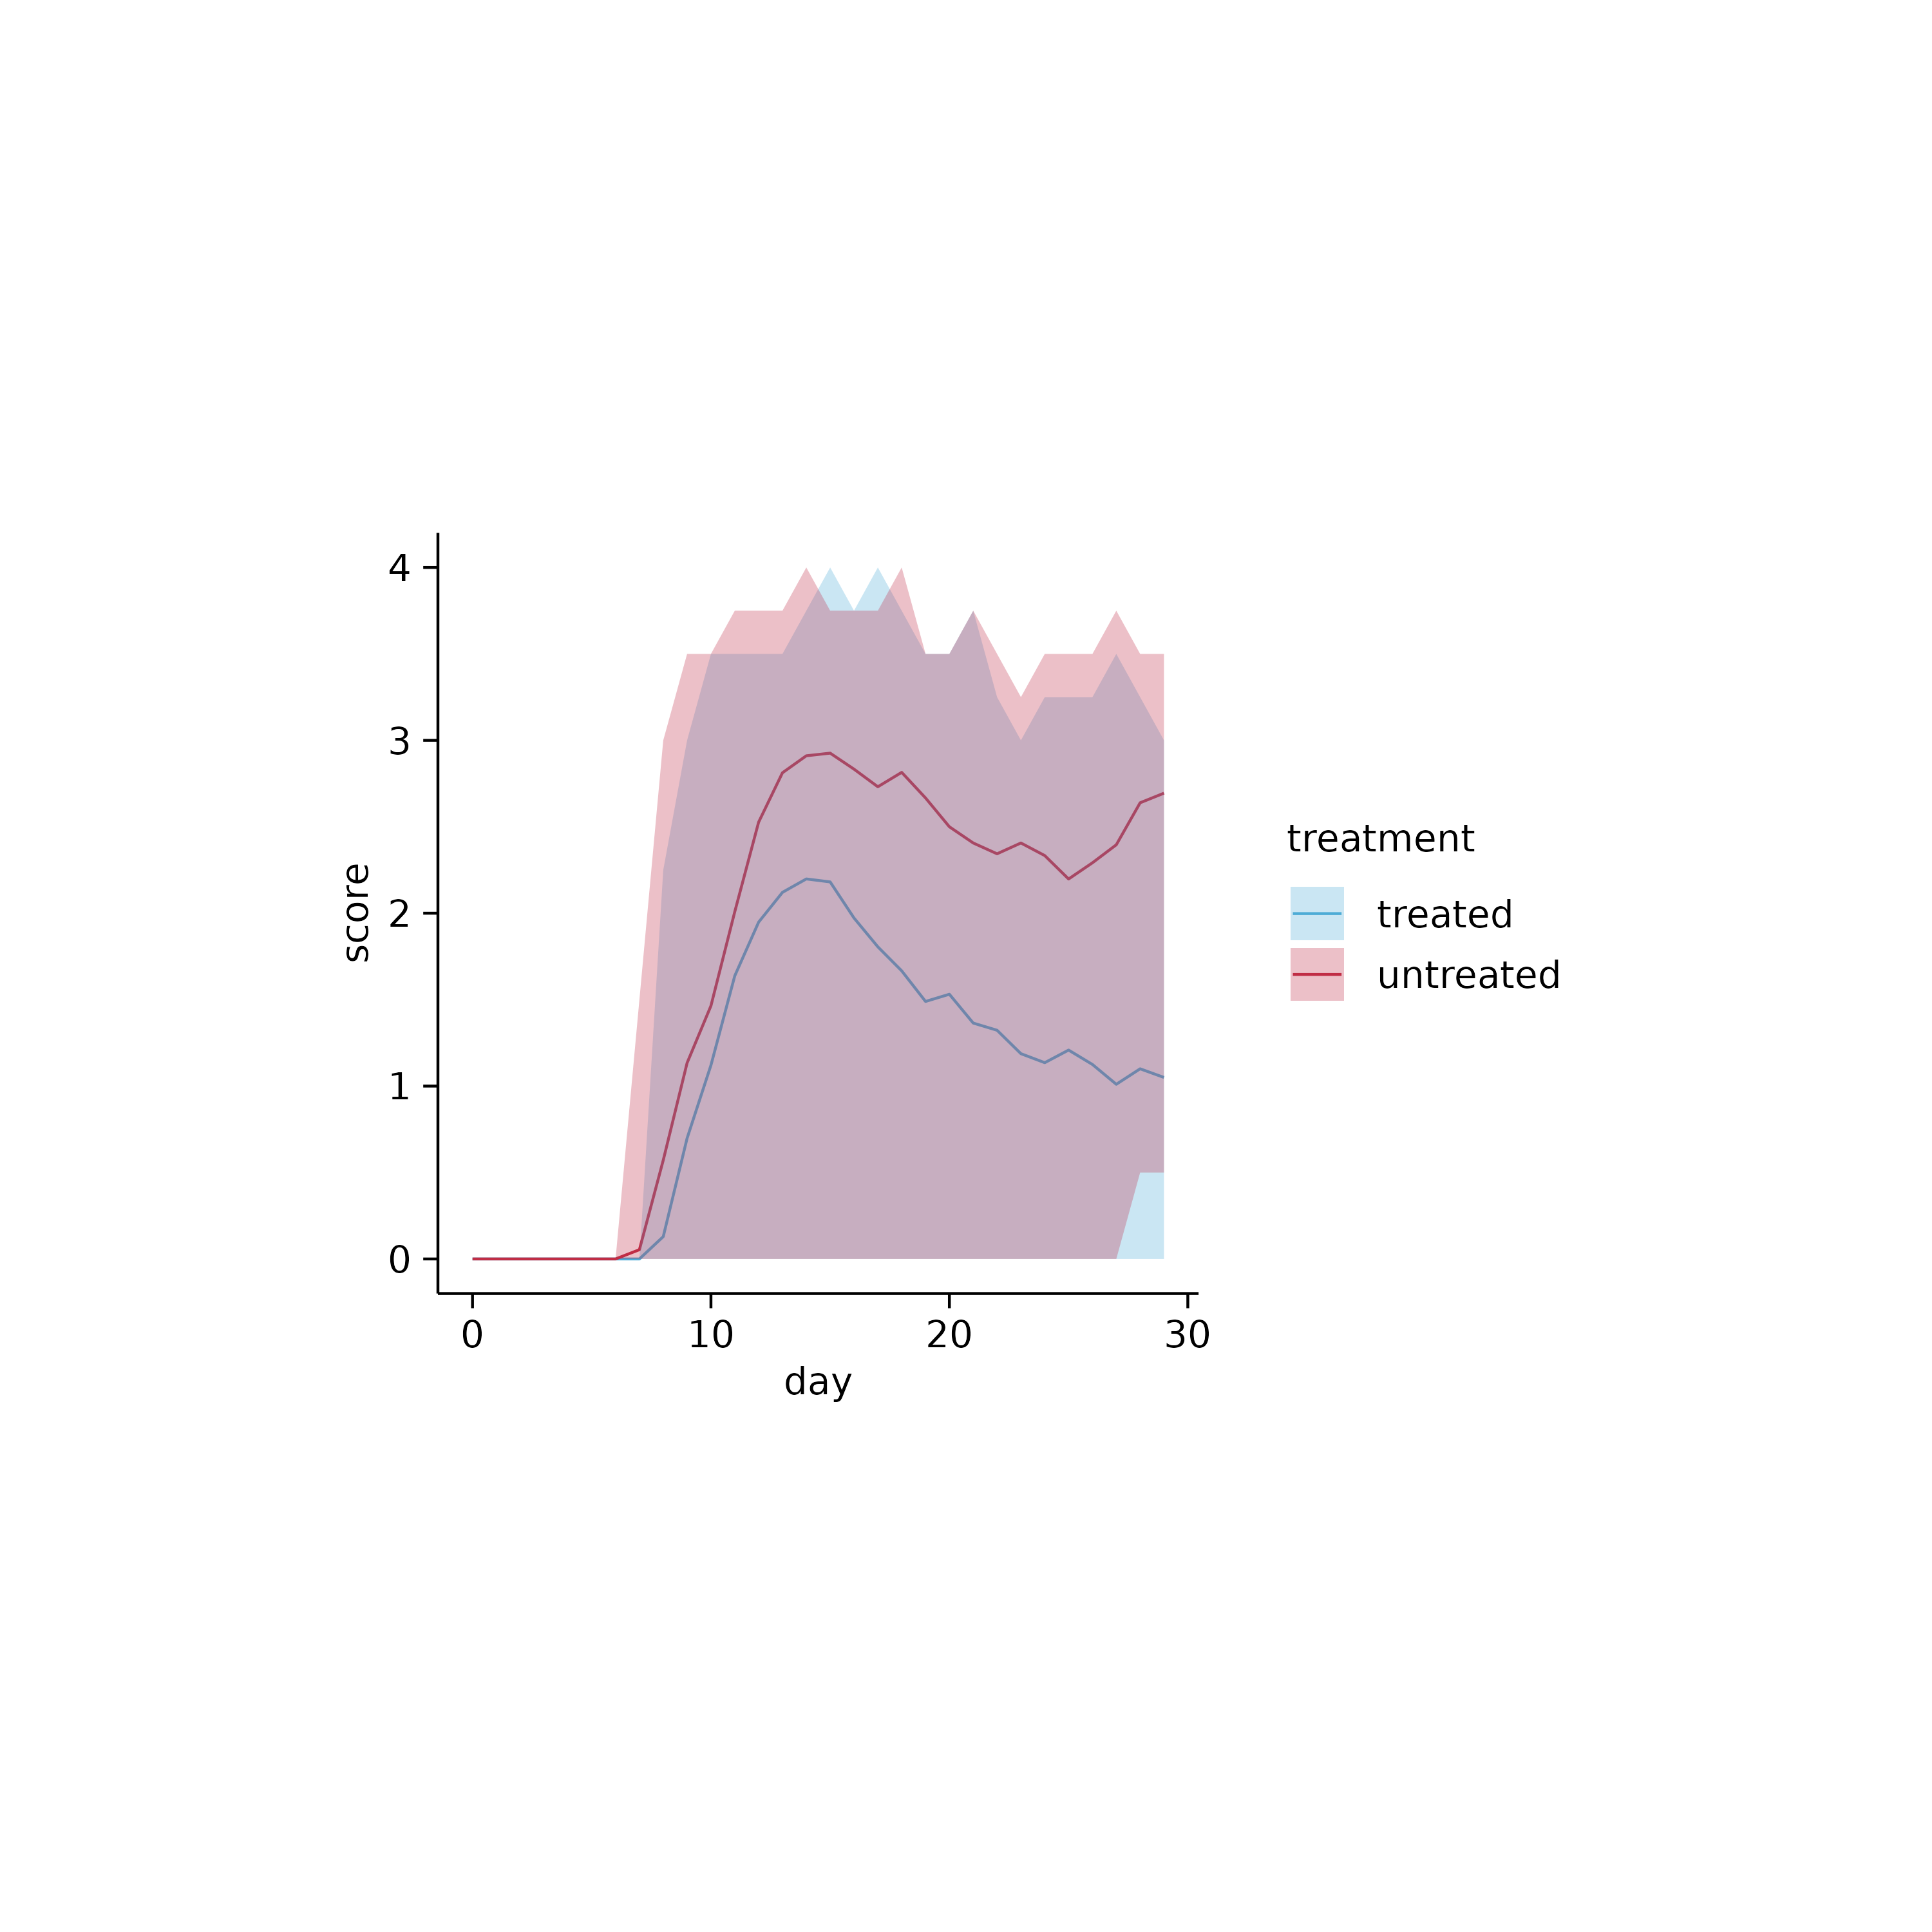
 time_course %>%
tidyplot(x = day, y = score, color = treatment, dodge_width = 0) %>%
add_mean_line() %>%
add_range_ribbon()
#> ✔ adjust_x_axis: continuous
#> ✔ adjust_y_axis: continuous
#> ℹ adjust_colors: Too many colors. 5 colors provided, but only 2 needed.
#> ✔ adjust_colors: applied discrete color values
#> ✔ adjust_plot_area_size: width = 50 mm, height = 50 mm
#> Warning: Removed 170 rows containing non-finite outside the scale range
#> (`stat_summary()`).
#> Warning: Removed 170 rows containing non-finite outside the scale range
#> (`stat_summary()`).
time_course %>%
tidyplot(x = day, y = score, color = treatment, dodge_width = 0) %>%
add_mean_line() %>%
add_range_ribbon()
#> ✔ adjust_x_axis: continuous
#> ✔ adjust_y_axis: continuous
#> ℹ adjust_colors: Too many colors. 5 colors provided, but only 2 needed.
#> ✔ adjust_colors: applied discrete color values
#> ✔ adjust_plot_area_size: width = 50 mm, height = 50 mm
#> Warning: Removed 170 rows containing non-finite outside the scale range
#> (`stat_summary()`).
#> Warning: Removed 170 rows containing non-finite outside the scale range
#> (`stat_summary()`).
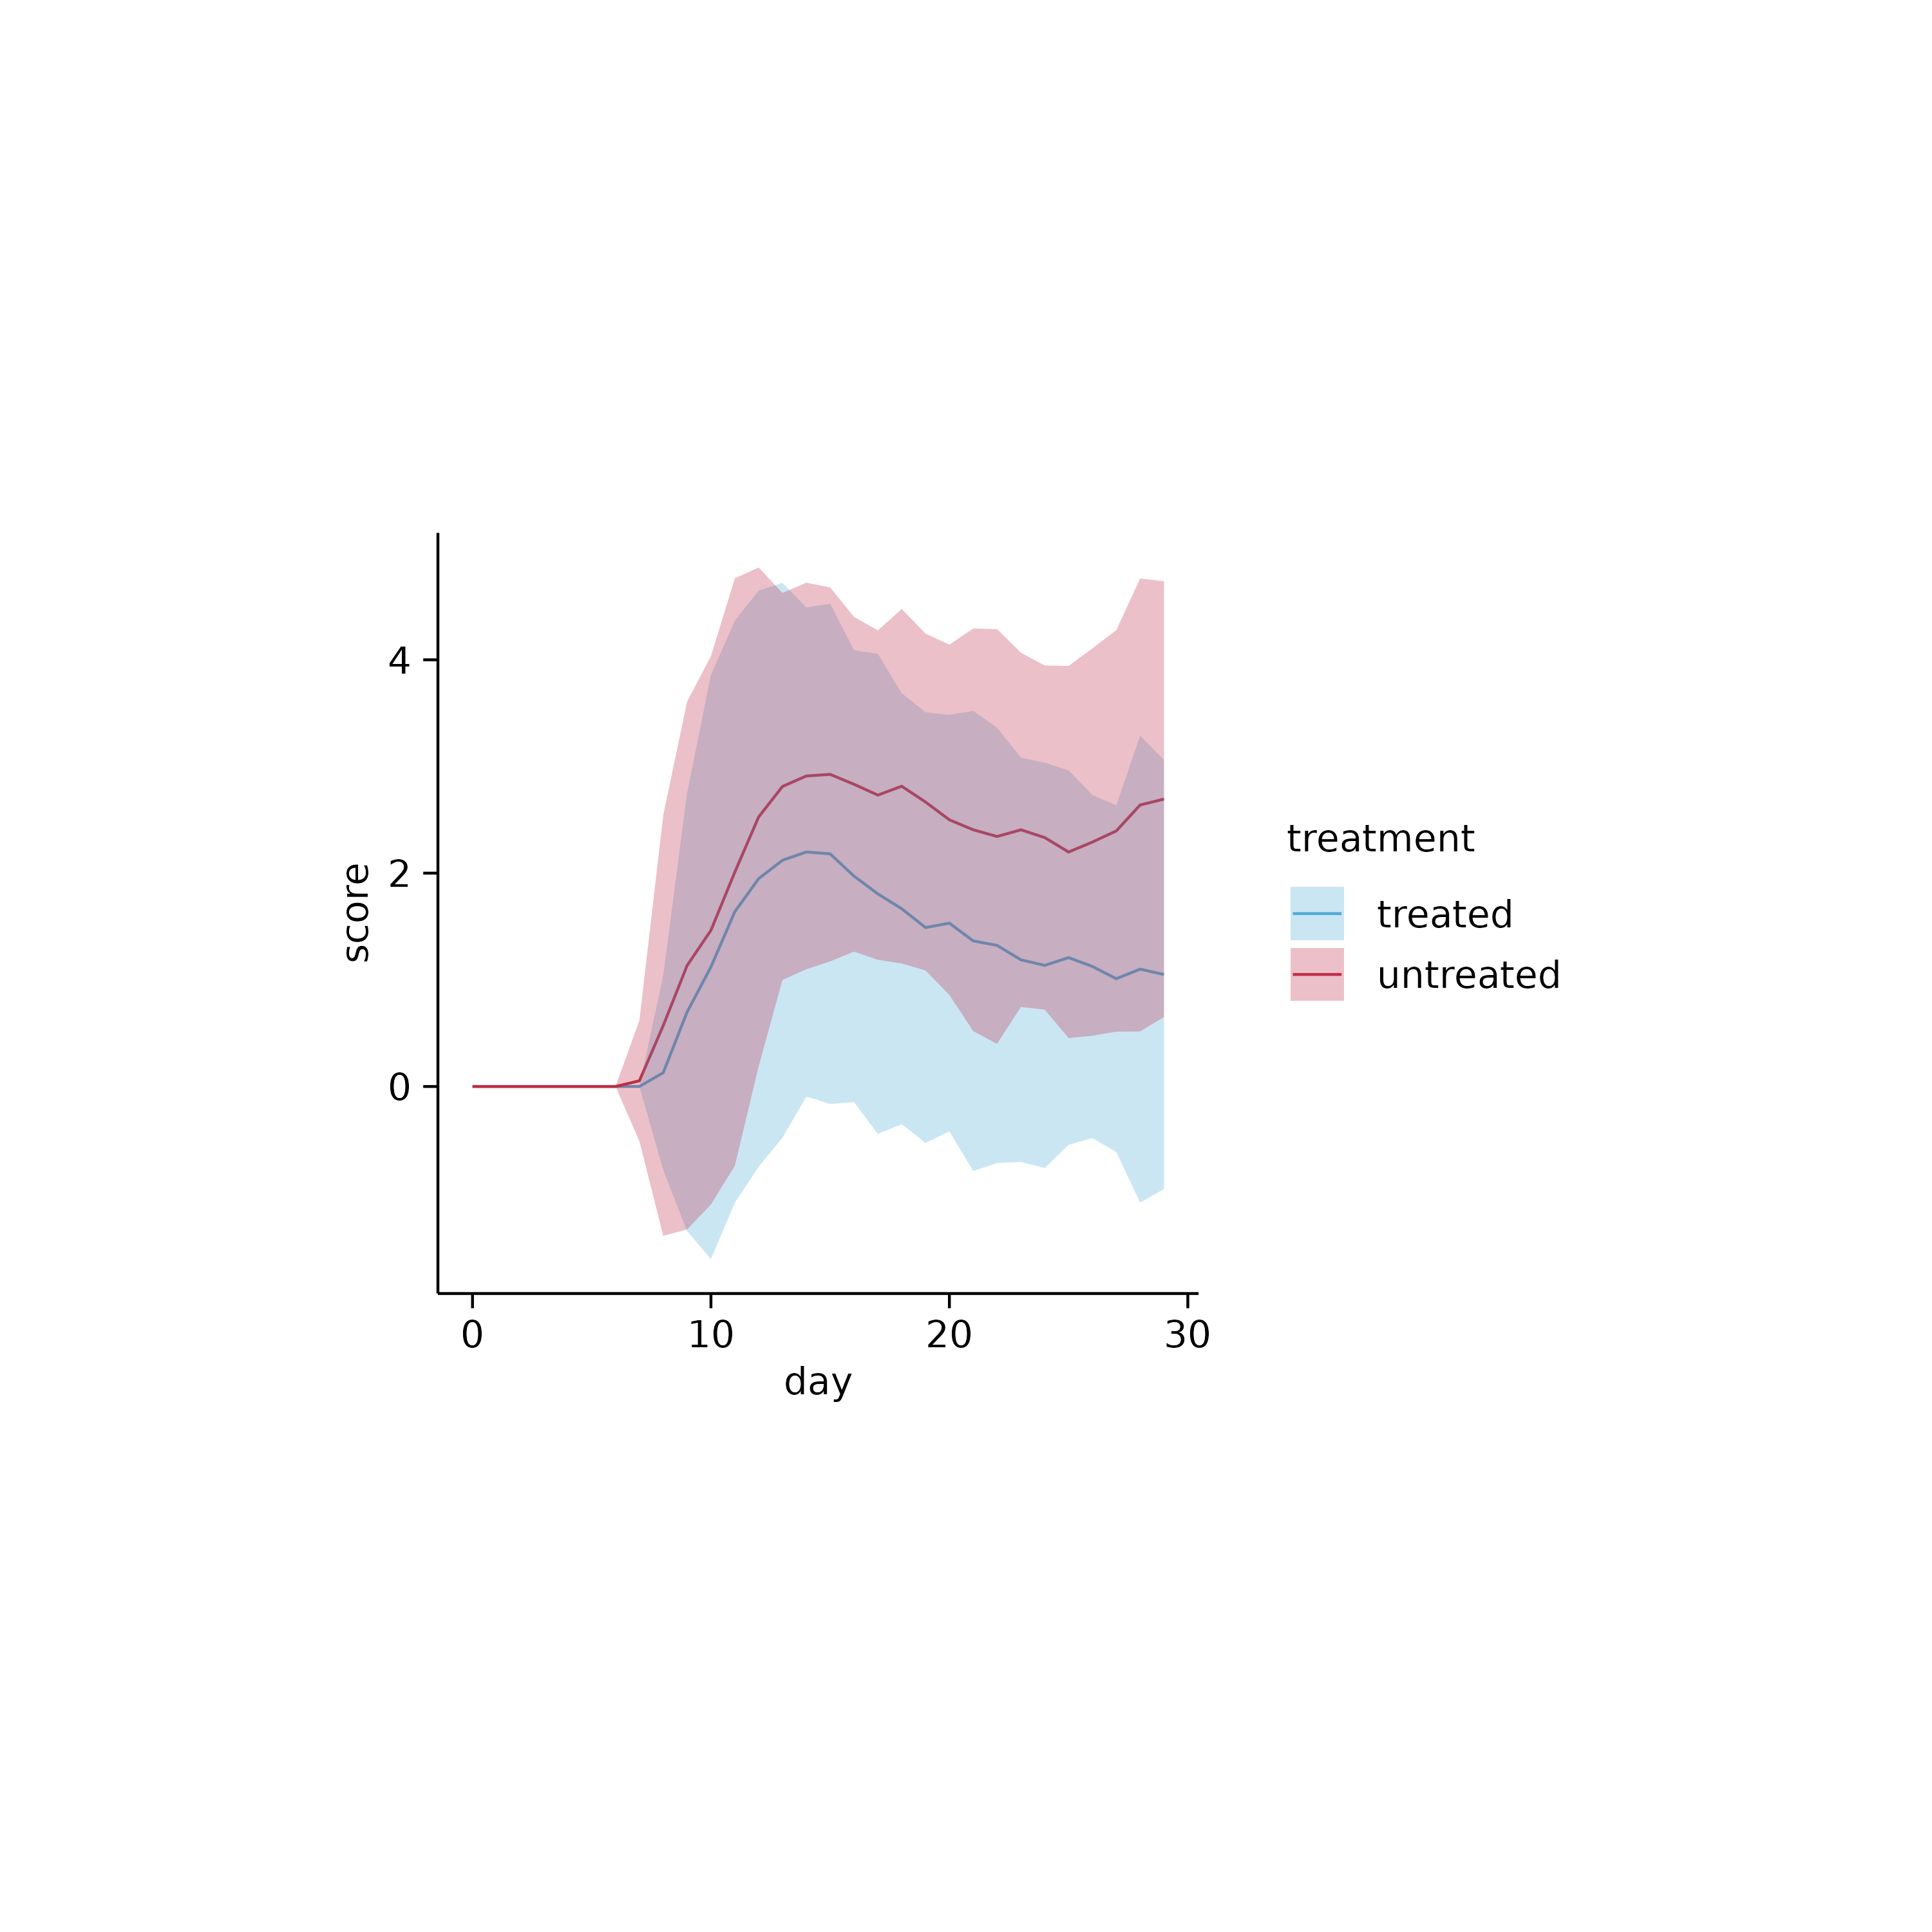
 time_course %>%
tidyplot(x = day, y = score, color = treatment, dodge_width = 0) %>%
add_mean_line() %>%
add_sd_ribbon()
#> ✔ adjust_x_axis: continuous
#> ✔ adjust_y_axis: continuous
#> ℹ adjust_colors: Too many colors. 5 colors provided, but only 2 needed.
#> ✔ adjust_colors: applied discrete color values
#> ✔ adjust_plot_area_size: width = 50 mm, height = 50 mm
#> Warning: Removed 170 rows containing non-finite outside the scale range
#> (`stat_summary()`).
#> Warning: Removed 170 rows containing non-finite outside the scale range
#> (`stat_summary()`).
time_course %>%
tidyplot(x = day, y = score, color = treatment, dodge_width = 0) %>%
add_mean_line() %>%
add_sd_ribbon()
#> ✔ adjust_x_axis: continuous
#> ✔ adjust_y_axis: continuous
#> ℹ adjust_colors: Too many colors. 5 colors provided, but only 2 needed.
#> ✔ adjust_colors: applied discrete color values
#> ✔ adjust_plot_area_size: width = 50 mm, height = 50 mm
#> Warning: Removed 170 rows containing non-finite outside the scale range
#> (`stat_summary()`).
#> Warning: Removed 170 rows containing non-finite outside the scale range
#> (`stat_summary()`).
 time_course %>%
tidyplot(x = day, y = score, color = treatment, dodge_width = 0) %>%
add_mean_line() %>%
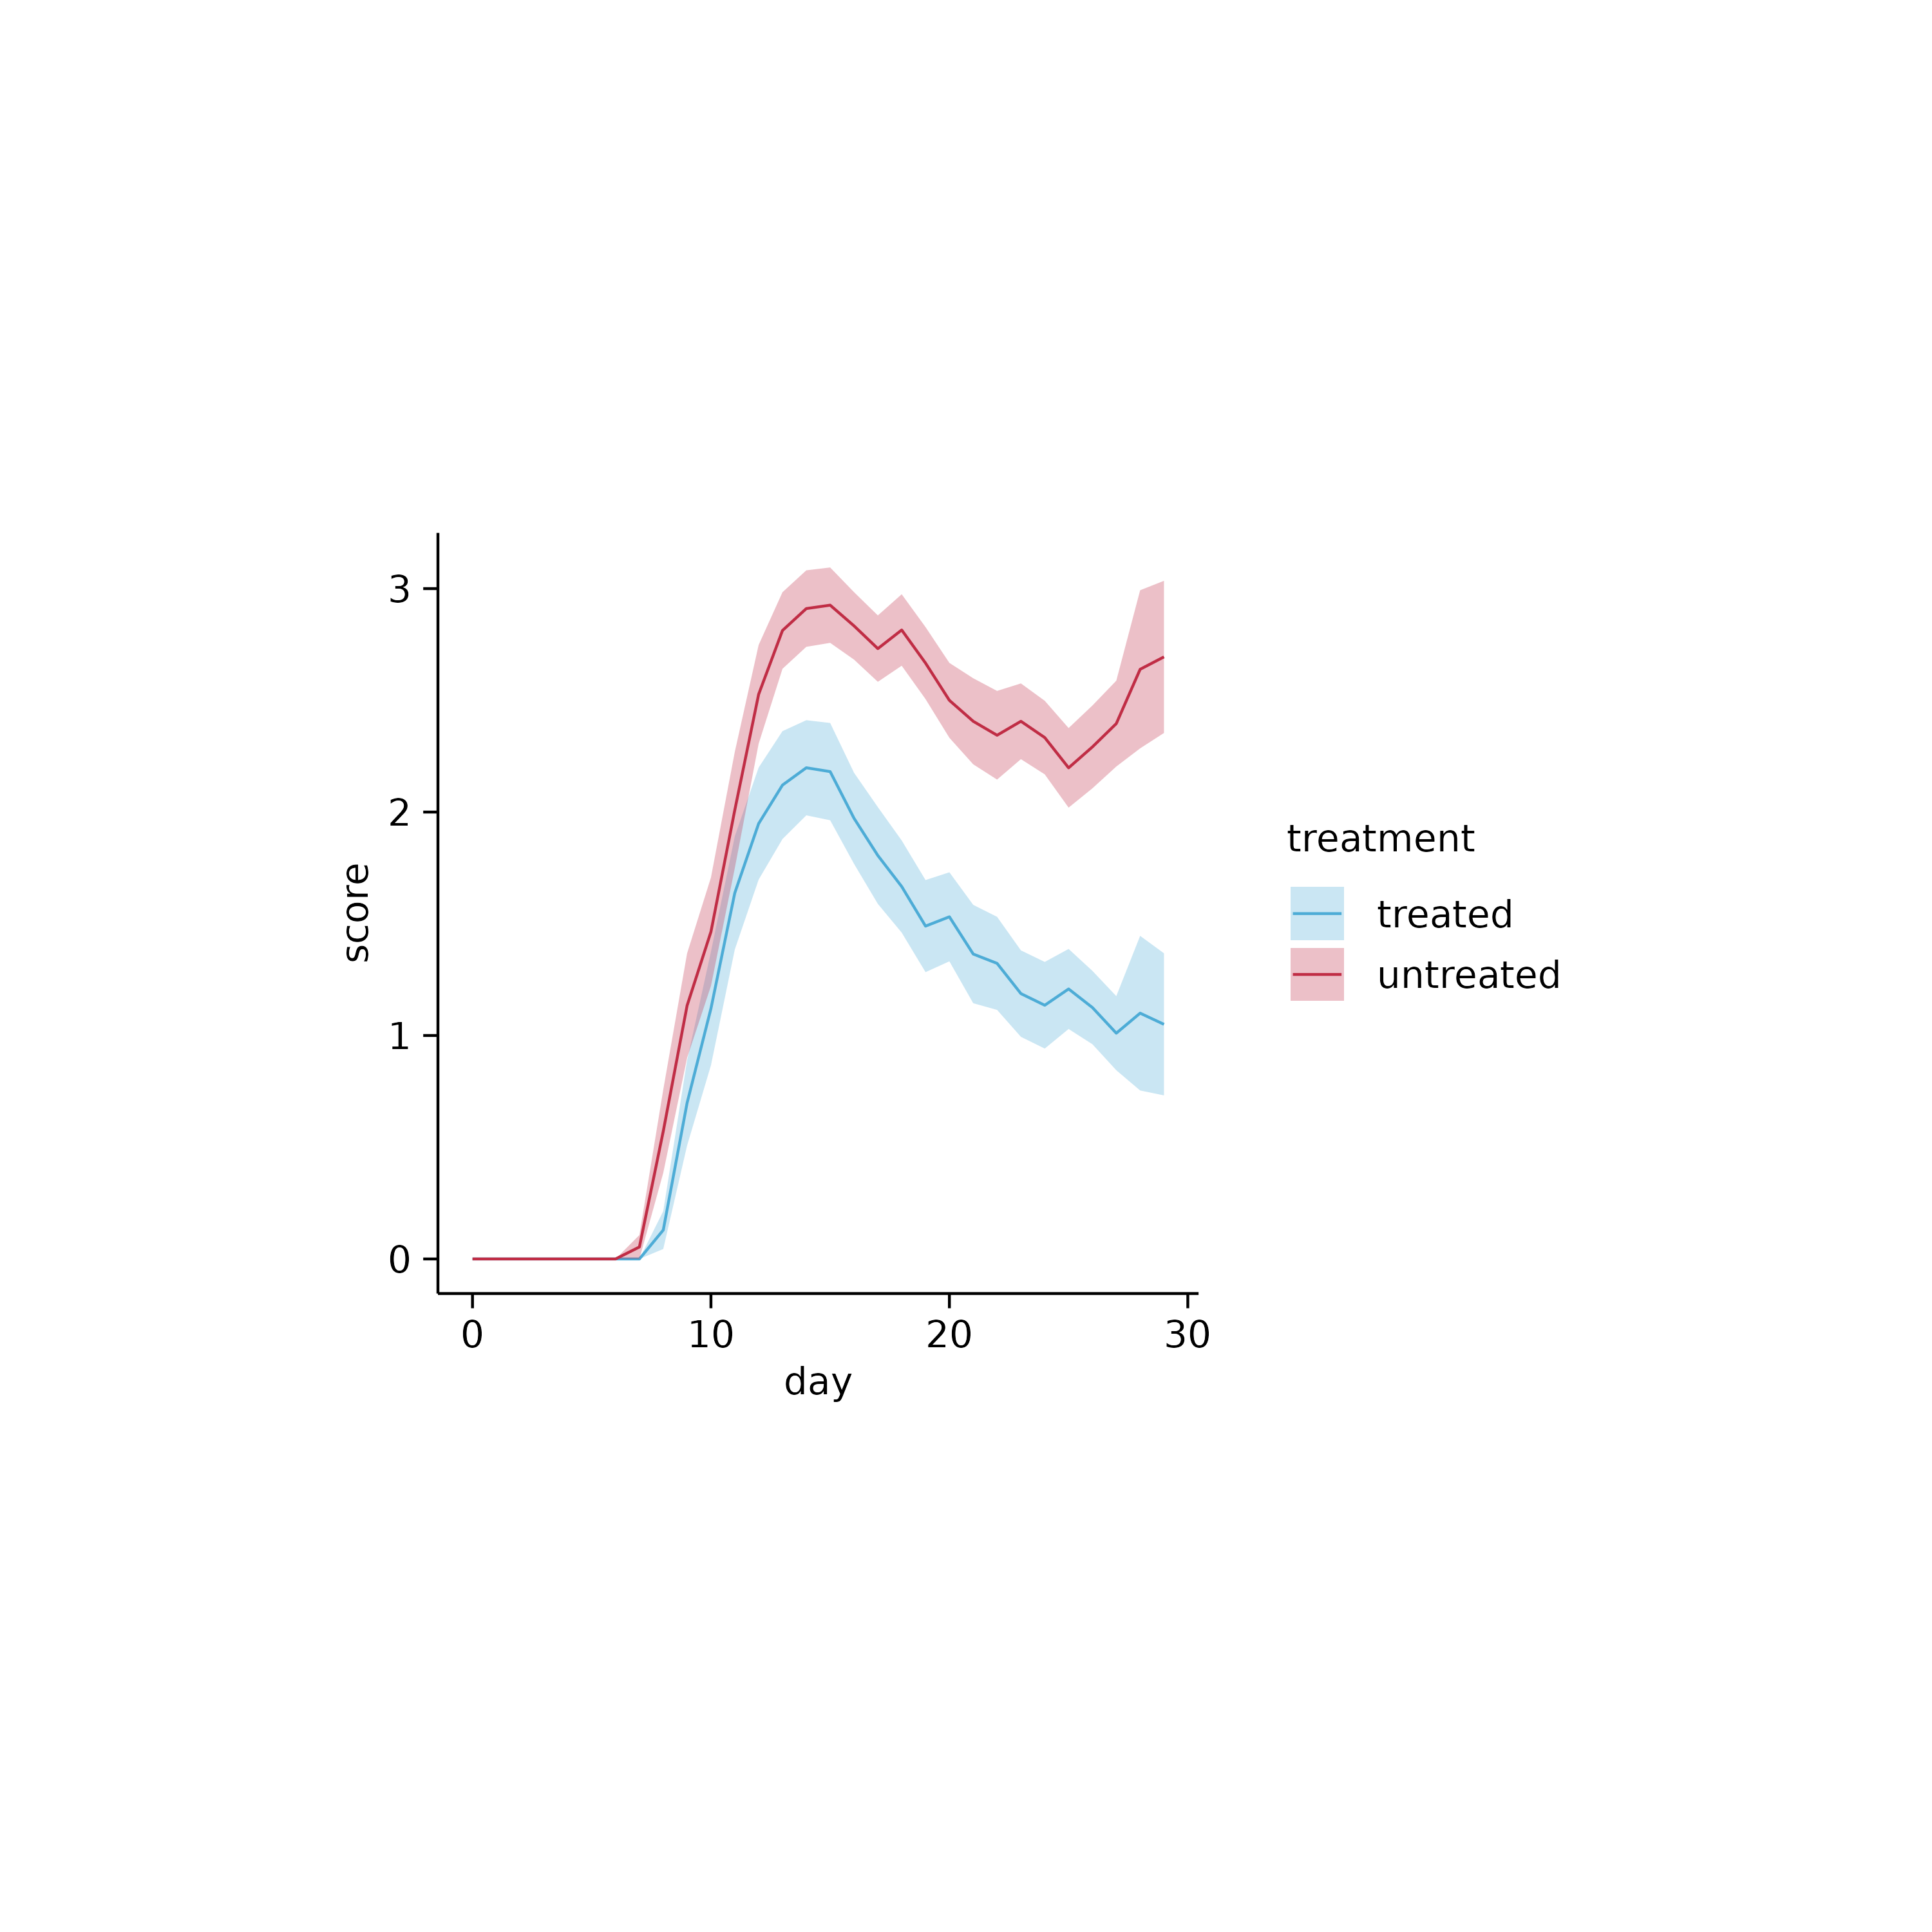
add_ci95_ribbon()
#> ✔ adjust_x_axis: continuous
#> ✔ adjust_y_axis: continuous
#> ℹ adjust_colors: Too many colors. 5 colors provided, but only 2 needed.
#> ✔ adjust_colors: applied discrete color values
#> ✔ adjust_plot_area_size: width = 50 mm, height = 50 mm
#> Warning: Removed 170 rows containing non-finite outside the scale range
#> (`stat_summary()`).
#> Warning: Removed 170 rows containing non-finite outside the scale range
#> (`stat_summary()`).
time_course %>%
tidyplot(x = day, y = score, color = treatment, dodge_width = 0) %>%
add_mean_line() %>%
add_ci95_ribbon()
#> ✔ adjust_x_axis: continuous
#> ✔ adjust_y_axis: continuous
#> ℹ adjust_colors: Too many colors. 5 colors provided, but only 2 needed.
#> ✔ adjust_colors: applied discrete color values
#> ✔ adjust_plot_area_size: width = 50 mm, height = 50 mm
#> Warning: Removed 170 rows containing non-finite outside the scale range
#> (`stat_summary()`).
#> Warning: Removed 170 rows containing non-finite outside the scale range
#> (`stat_summary()`).