add_error_bar()adds the standard error of mean.add_range_bar()adds the range from smallest to largest value.add_sd_bar()adds the standard deviation.add_ci95_bar()adds the 95% confidence interval.
Usage
add_error_bar(
  plot,
  dodge_width = NULL,
  width = 0.4,
  linewidth = 0.25,
  preserve = "total",
  ...
)

add_range_bar(
  plot,
  dodge_width = NULL,
  width = 0.4,
  linewidth = 0.25,
  preserve = "total",
  ...
)

add_sd_bar(
  plot,
  dodge_width = NULL,
  width = 0.4,
  linewidth = 0.25,
  preserve = "total",
  ...
)

add_ci95_bar(
  plot,
  dodge_width = NULL,
  width = 0.4,
  linewidth = 0.25,
  preserve = "total",
  ...
)
Arguments
- plot
A
tidyplotgenerated with the functiontidyplot().- dodge_width
For adjusting the distance between grouped objects.
- width
Horizontal width of the plotted object (bar, error bar, boxplot, violin plot, etc). Typical values range between
0and1.- linewidth
Thickness of the line in points (pt). Typical values range between
0.25and1.- preserve
Should dodging preserve the
"total"width of all elements at a position, or the width of a"single"element?- ...
Arguments passed on to the
geomfunction.
Examples
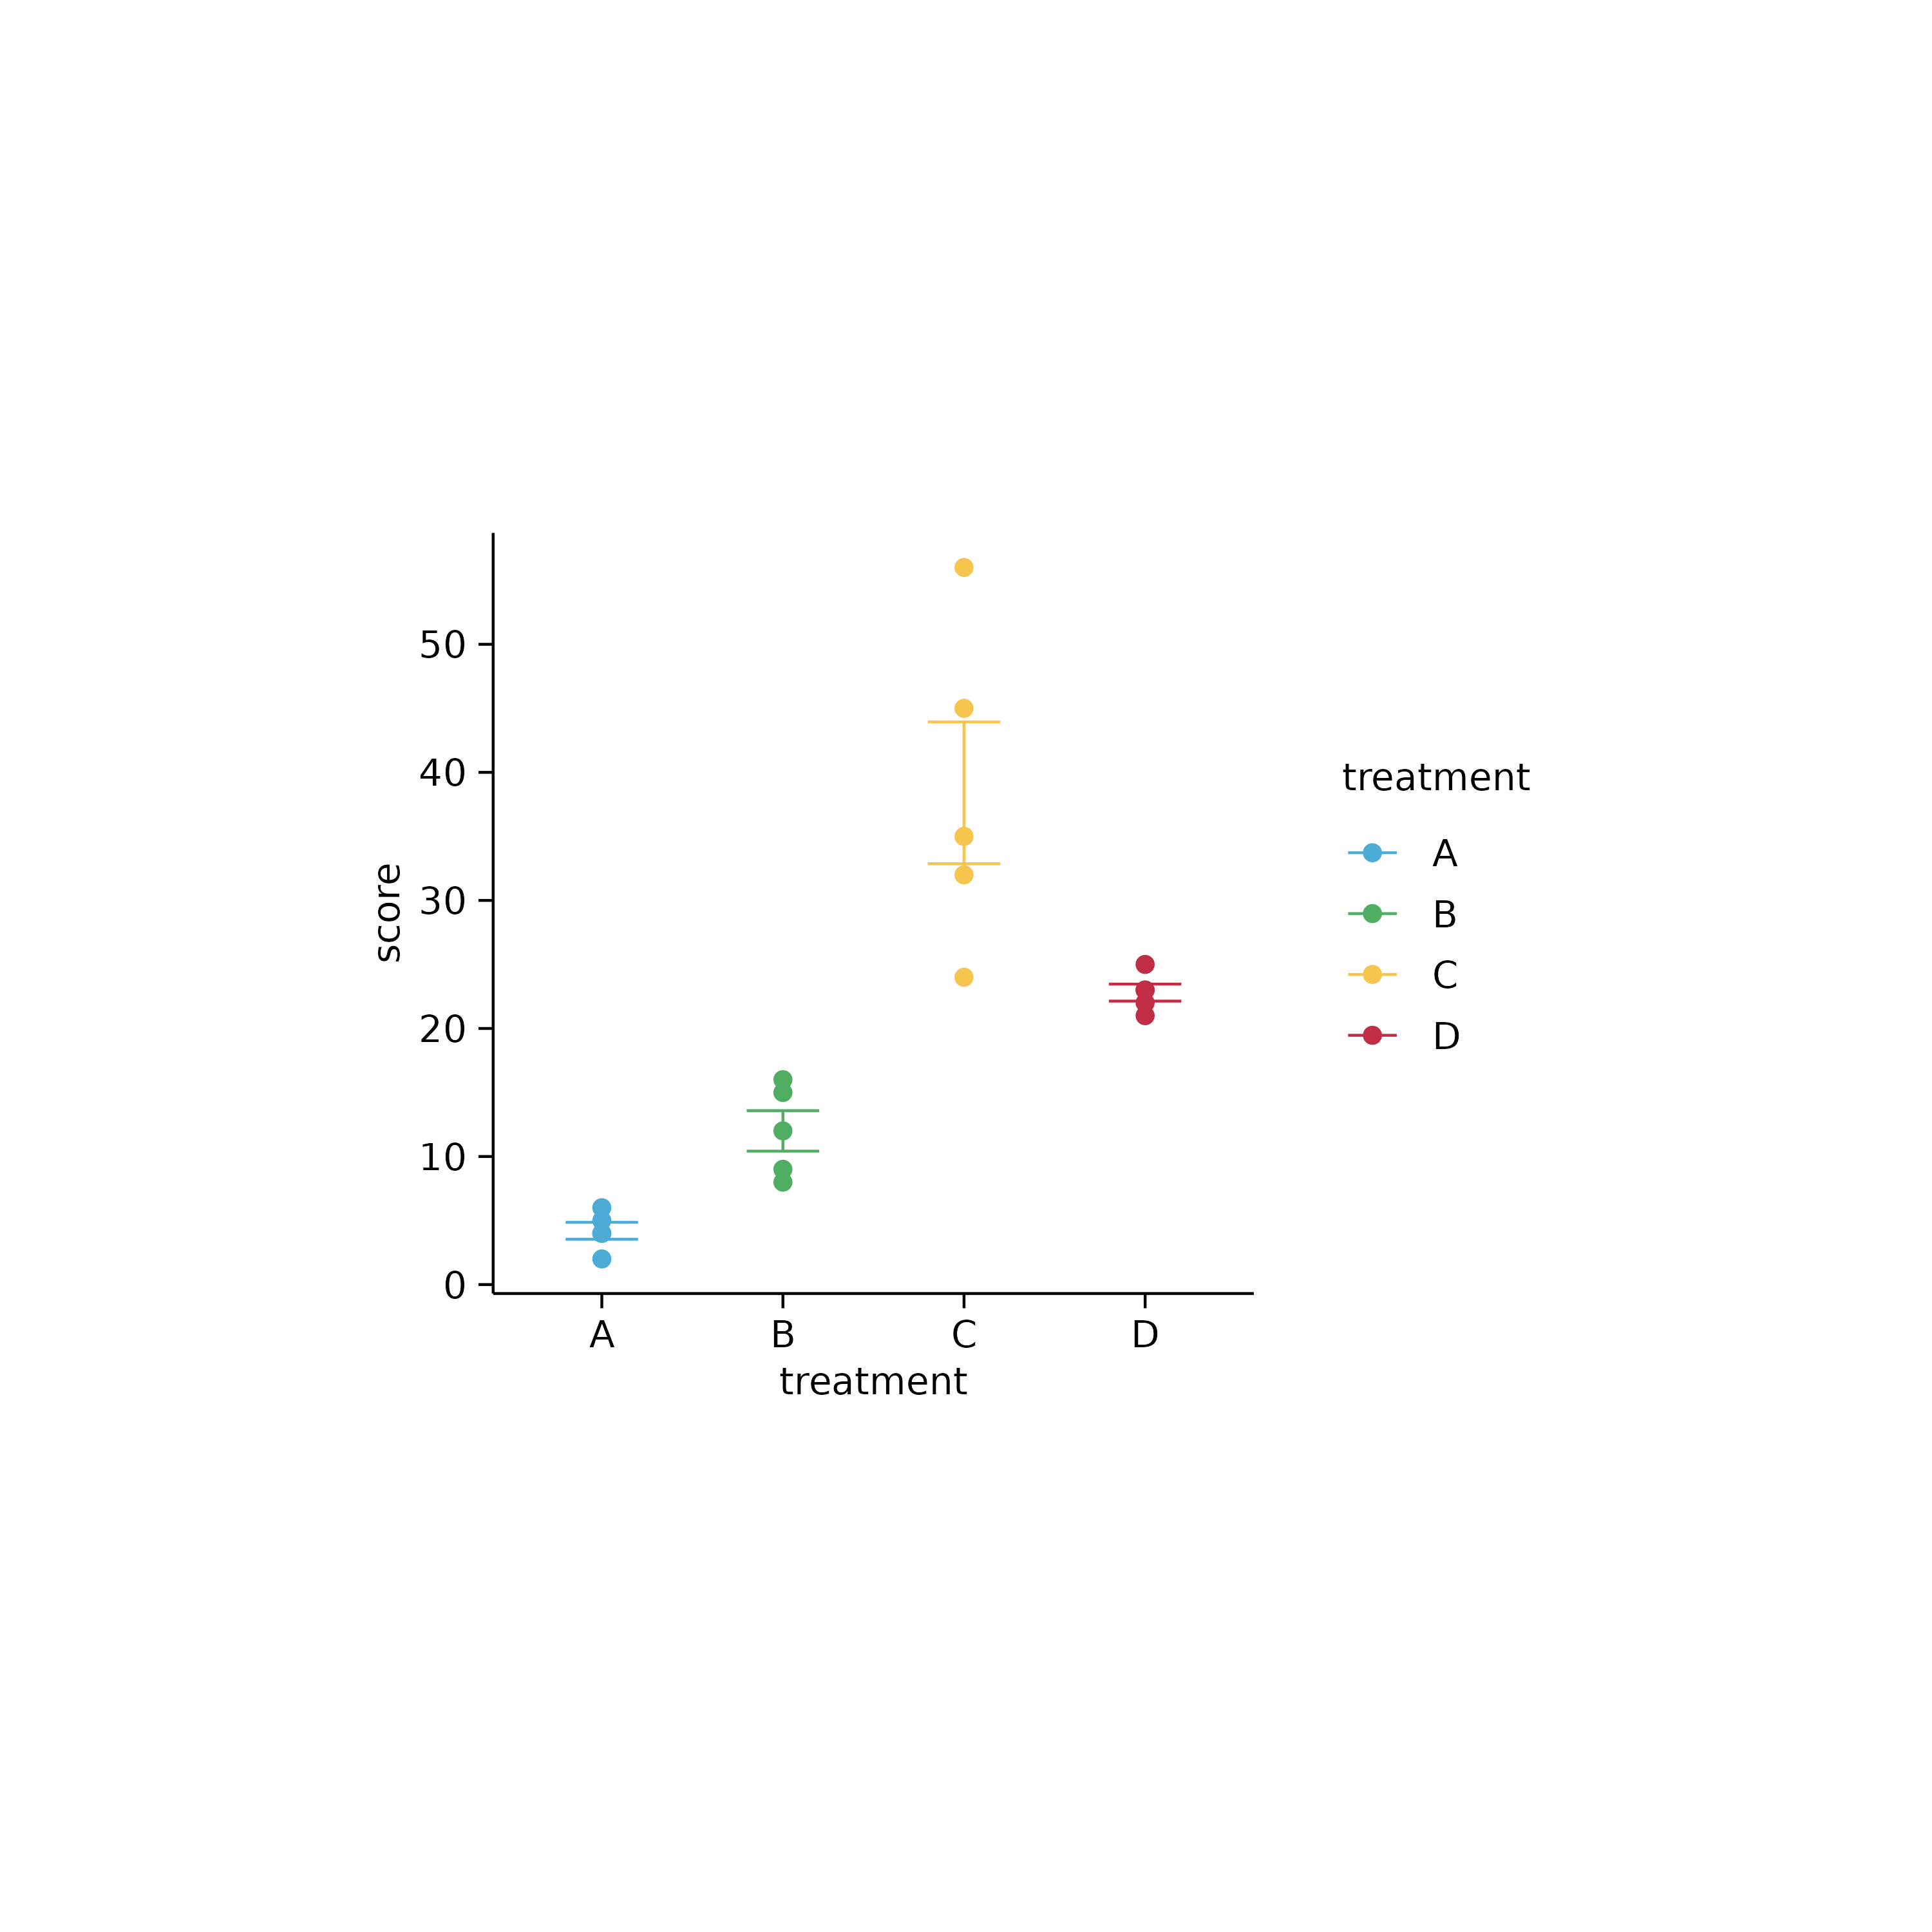
study %>%
tidyplot(x = treatment, y = score, color = treatment) %>%
add_data_points() %>%
add_error_bar()
#> ✔ adjust_x_axis: discrete
#> ✔ adjust_y_axis: continuous
#> ℹ adjust_colors: Too many colors. 5 colors provided, but only 4 needed.
#> ✔ adjust_colors: applied discrete color values
#> ✔ adjust_plot_area_size: width = 50 mm, height = 50 mm
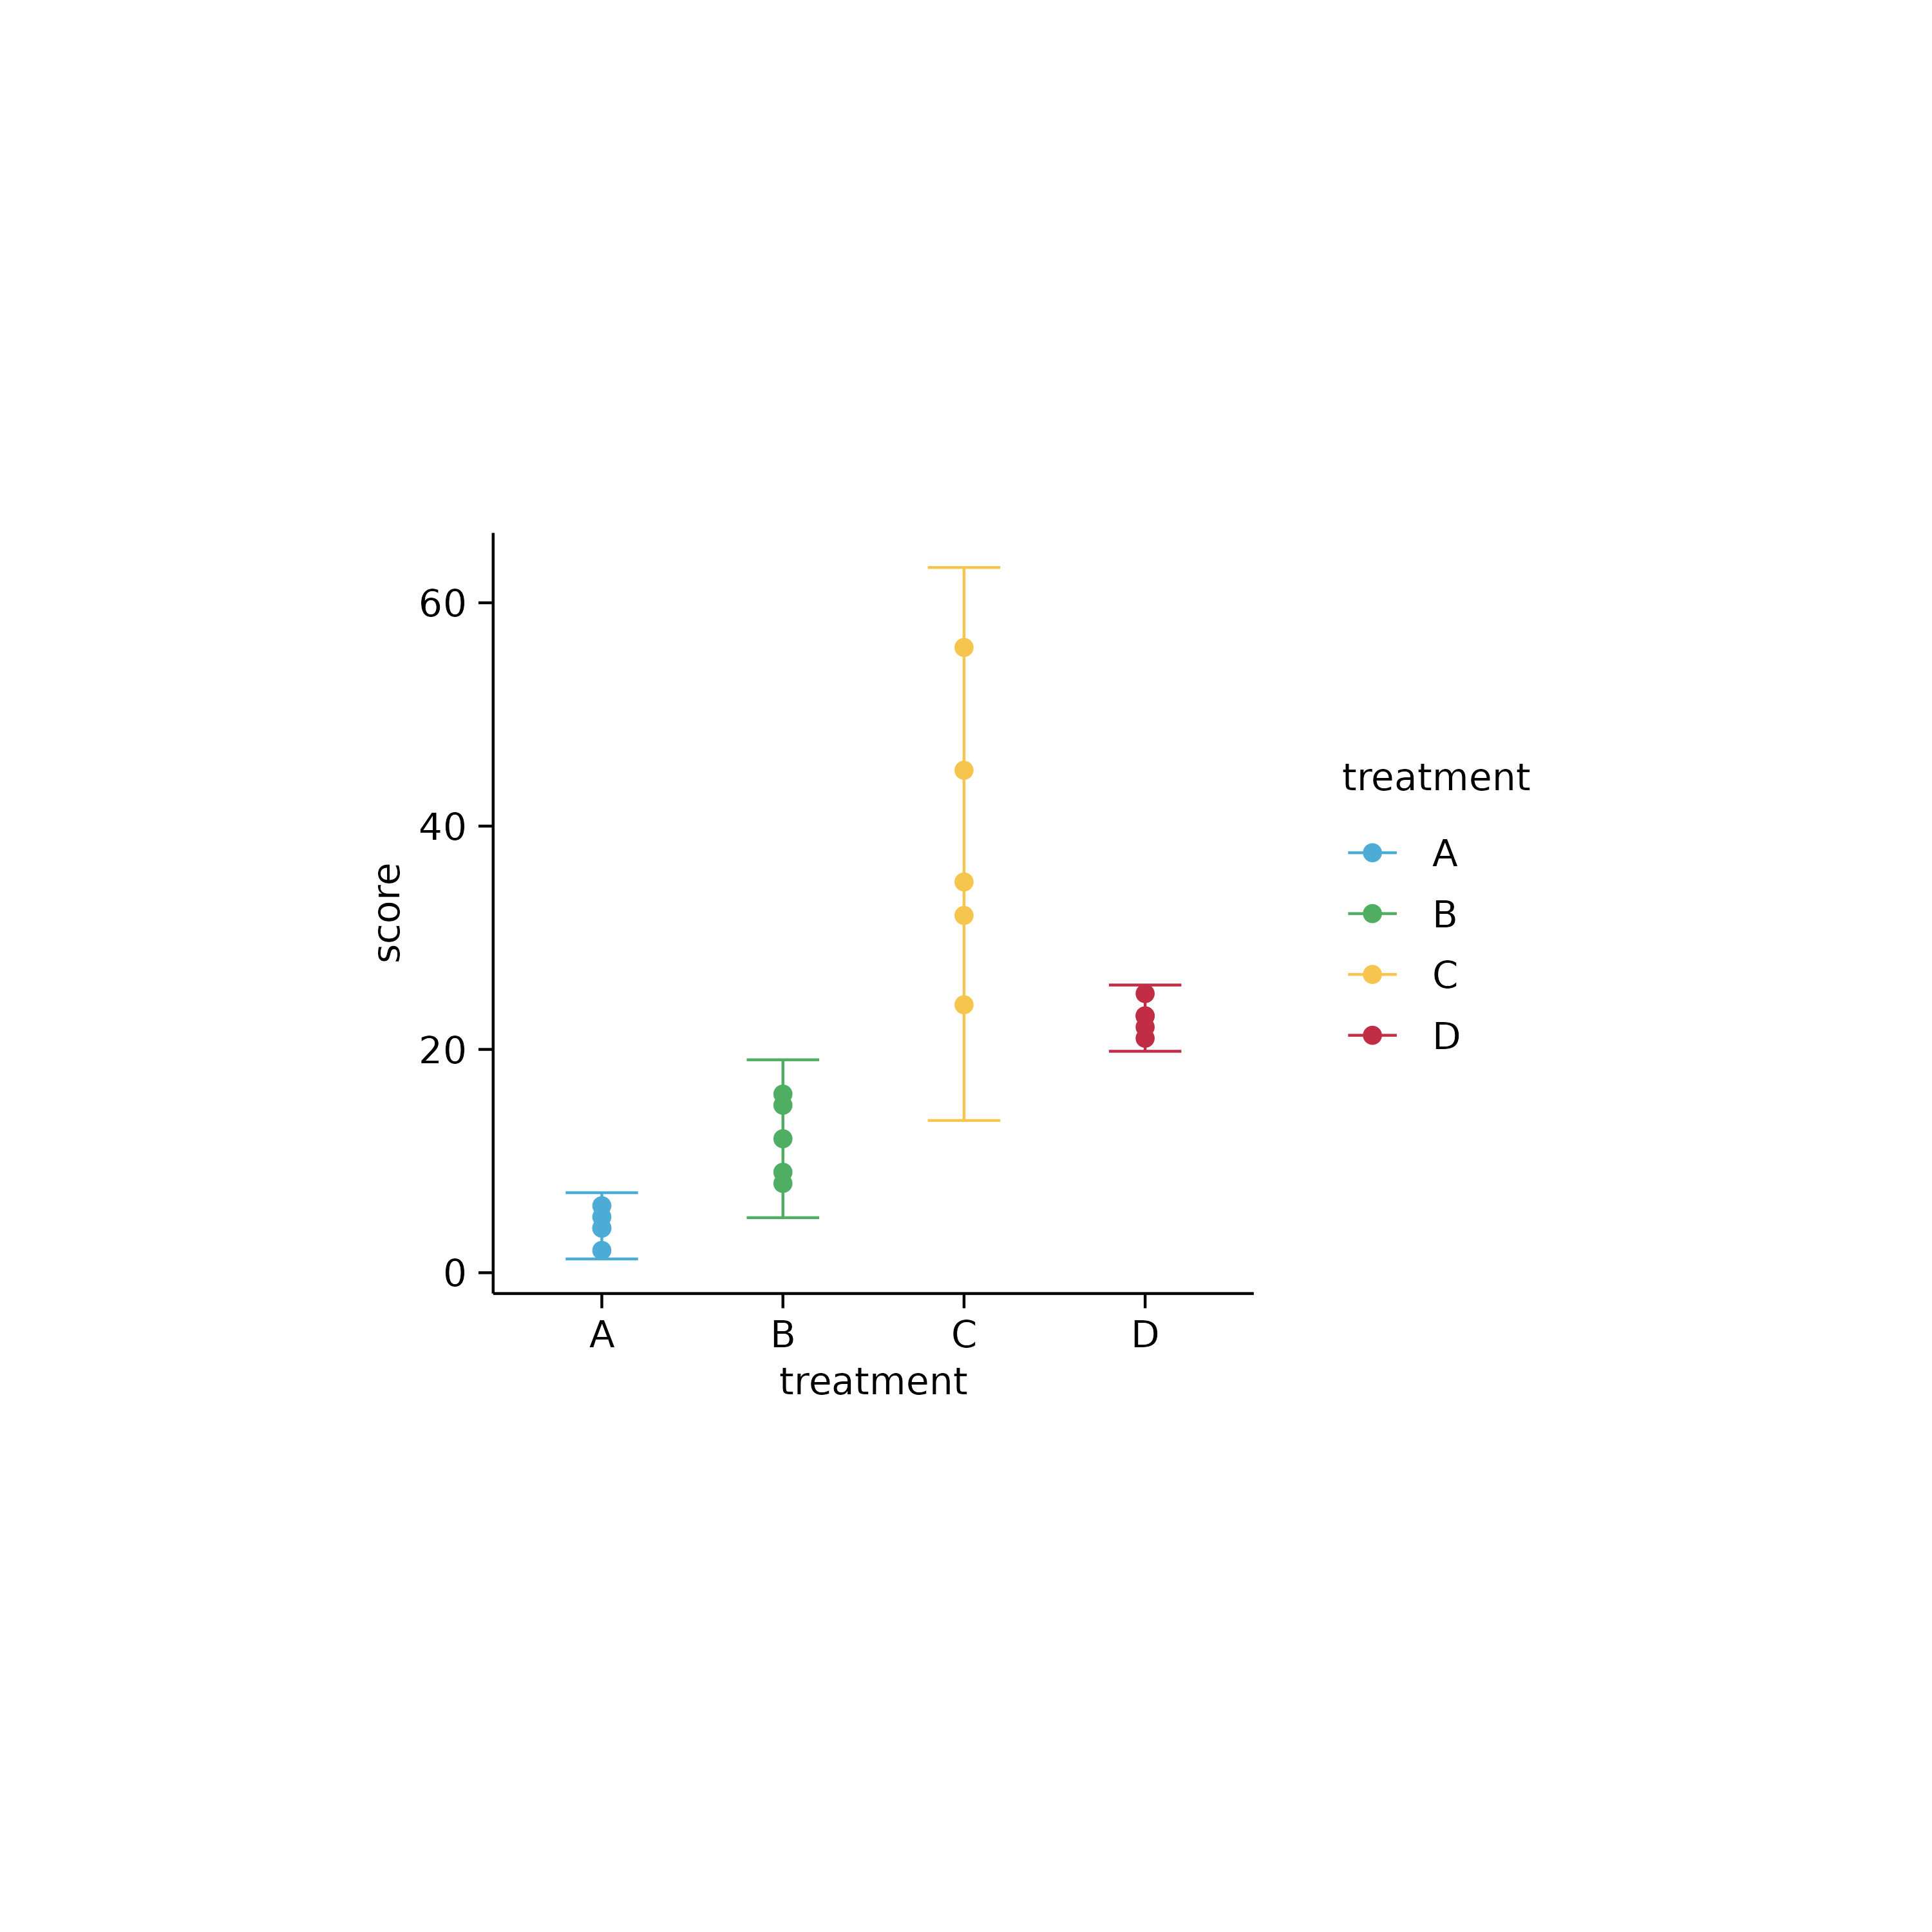
 study %>%
tidyplot(x = treatment, y = score, color = treatment) %>%
add_data_points() %>%
add_range_bar()
#> ✔ adjust_x_axis: discrete
#> ✔ adjust_y_axis: continuous
#> ℹ adjust_colors: Too many colors. 5 colors provided, but only 4 needed.
#> ✔ adjust_colors: applied discrete color values
#> ✔ adjust_plot_area_size: width = 50 mm, height = 50 mm
study %>%
tidyplot(x = treatment, y = score, color = treatment) %>%
add_data_points() %>%
add_range_bar()
#> ✔ adjust_x_axis: discrete
#> ✔ adjust_y_axis: continuous
#> ℹ adjust_colors: Too many colors. 5 colors provided, but only 4 needed.
#> ✔ adjust_colors: applied discrete color values
#> ✔ adjust_plot_area_size: width = 50 mm, height = 50 mm
 study %>%
tidyplot(x = treatment, y = score, color = treatment) %>%
add_data_points() %>%
add_sd_bar()
#> ✔ adjust_x_axis: discrete
#> ✔ adjust_y_axis: continuous
#> ℹ adjust_colors: Too many colors. 5 colors provided, but only 4 needed.
#> ✔ adjust_colors: applied discrete color values
#> ✔ adjust_plot_area_size: width = 50 mm, height = 50 mm
study %>%
tidyplot(x = treatment, y = score, color = treatment) %>%
add_data_points() %>%
add_sd_bar()
#> ✔ adjust_x_axis: discrete
#> ✔ adjust_y_axis: continuous
#> ℹ adjust_colors: Too many colors. 5 colors provided, but only 4 needed.
#> ✔ adjust_colors: applied discrete color values
#> ✔ adjust_plot_area_size: width = 50 mm, height = 50 mm
 study %>%
tidyplot(x = treatment, y = score, color = treatment) %>%
add_data_points() %>%
add_ci95_bar()
#> ✔ adjust_x_axis: discrete
#> ✔ adjust_y_axis: continuous
#> ℹ adjust_colors: Too many colors. 5 colors provided, but only 4 needed.
#> ✔ adjust_colors: applied discrete color values
#> ✔ adjust_plot_area_size: width = 50 mm, height = 50 mm
study %>%
tidyplot(x = treatment, y = score, color = treatment) %>%
add_data_points() %>%
add_ci95_bar()
#> ✔ adjust_x_axis: discrete
#> ✔ adjust_y_axis: continuous
#> ℹ adjust_colors: Too many colors. 5 colors provided, but only 4 needed.
#> ✔ adjust_colors: applied discrete color values
#> ✔ adjust_plot_area_size: width = 50 mm, height = 50 mm
