Add ellipse
Arguments
- plot
A
tidyplotgenerated with the functiontidyplot().- ...
Arguments passed on to
ggplot2::stat_ellipse().
Examples
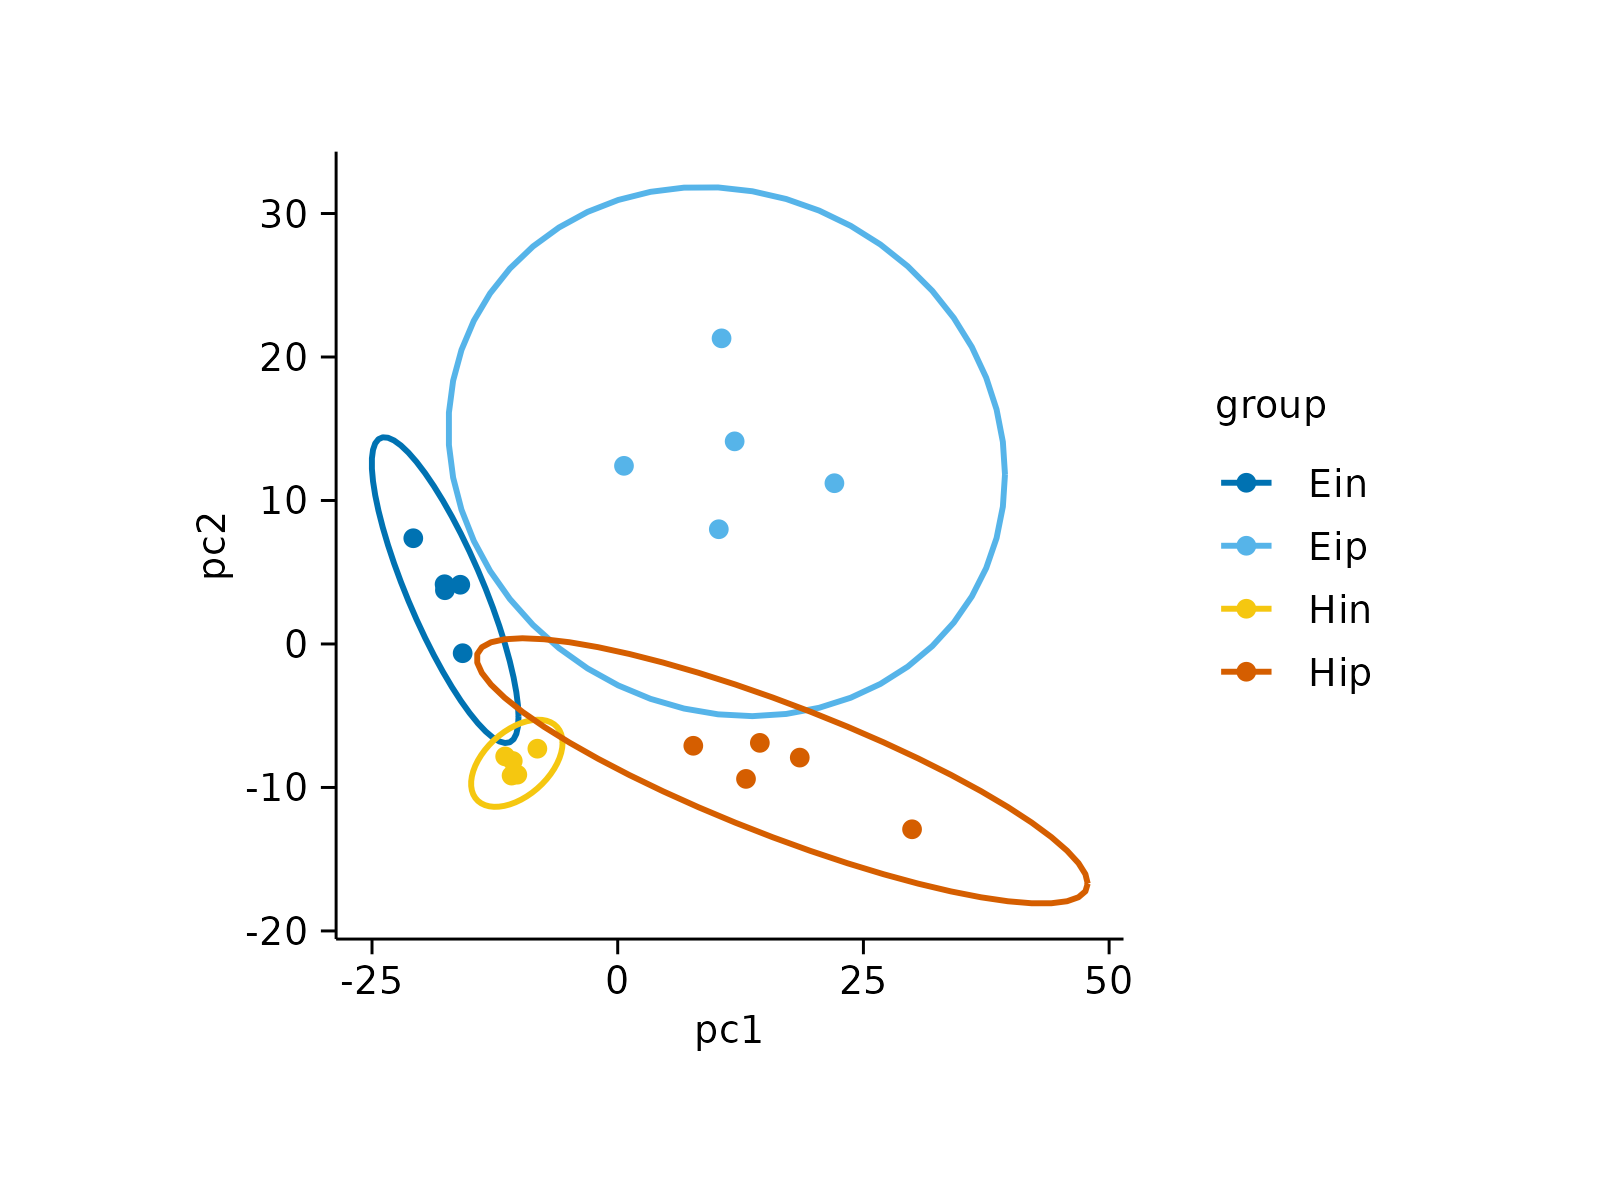
pca |>
tidyplot(x = pc1, y = pc2, color = group) |>
add_data_points() |>
add_ellipse()
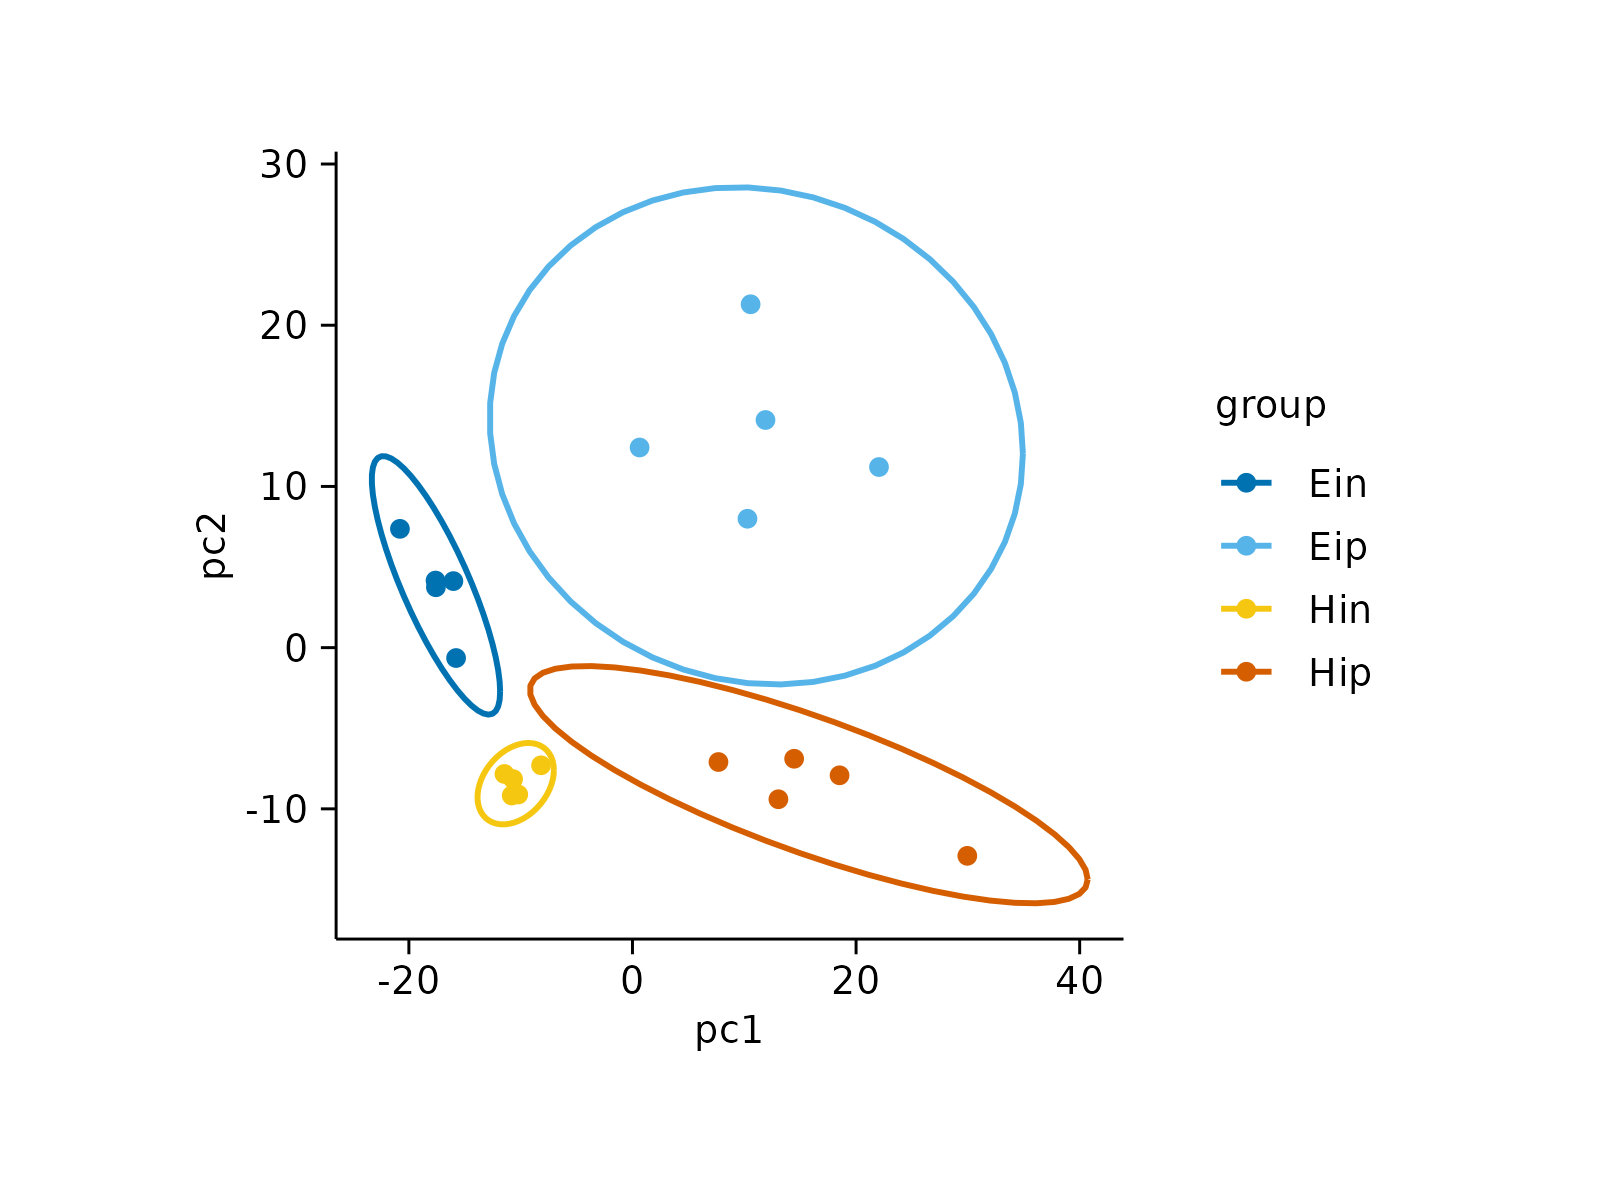 pca |>
tidyplot(x = pc1, y = pc2, color = group) |>
add_data_points() |>
add_ellipse(level = 0.75)
pca |>
tidyplot(x = pc1, y = pc2, color = group) |>
add_data_points() |>
add_ellipse(level = 0.75)
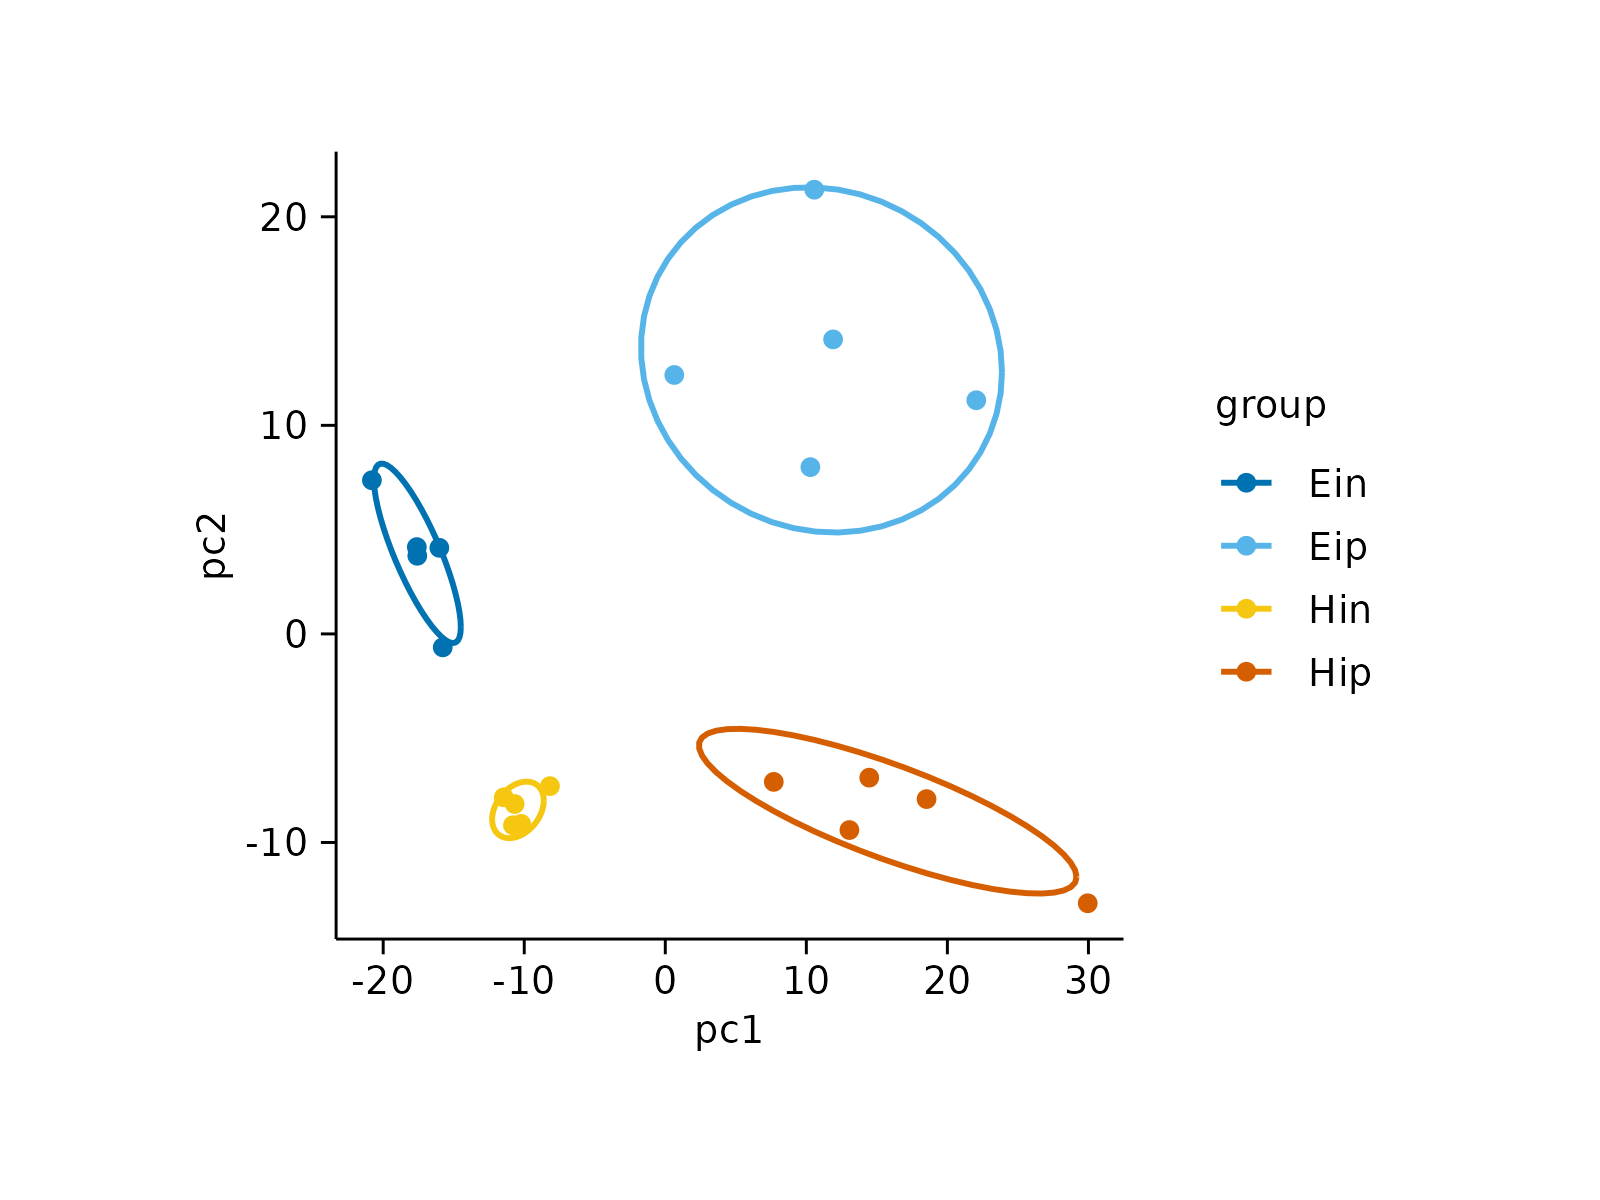 pca |>
tidyplot(x = pc1, y = pc2, color = group) |>
add_data_points() |>
add_ellipse(type = "norm")
pca |>
tidyplot(x = pc1, y = pc2, color = group) |>
add_data_points() |>
add_ellipse(type = "norm")