Remove plot area clipping
Arguments
- plot
A
tidyplotgenerated with the functiontidyplot().
Examples
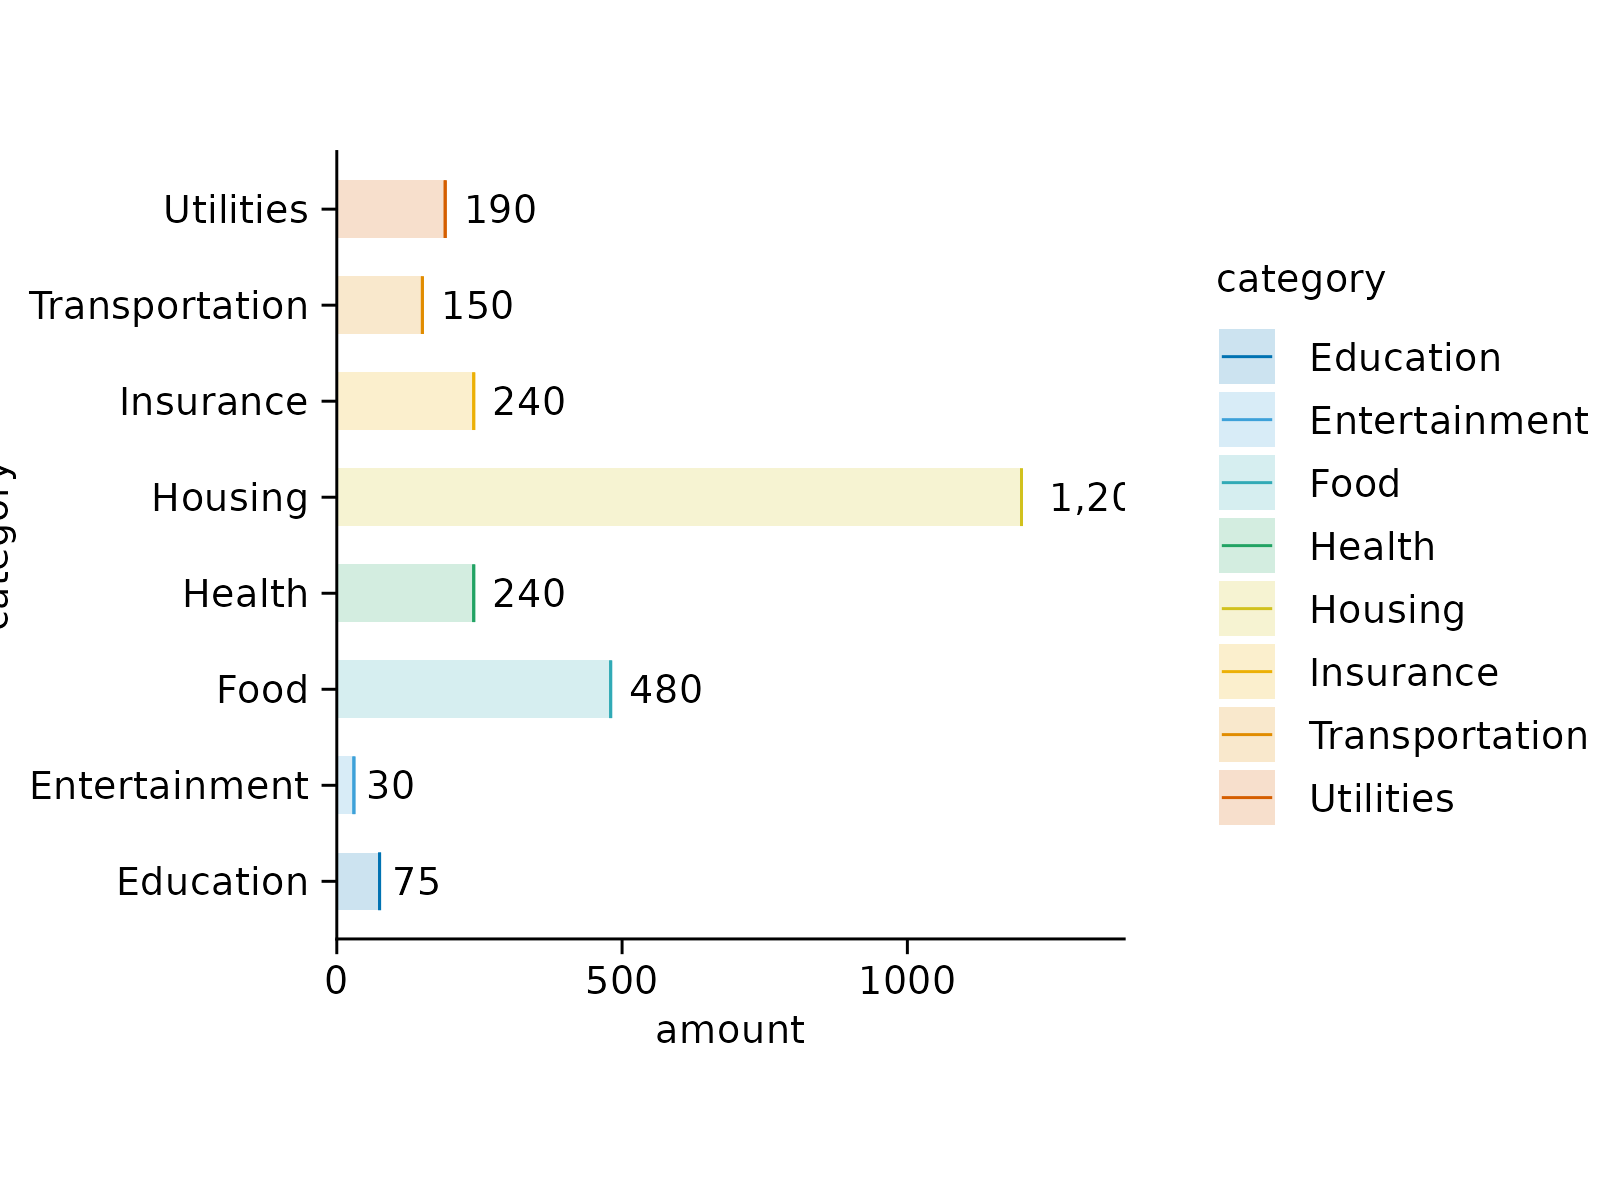
# Before removing
spendings |>
tidyplot(x = amount, y = category, color = category) |>
add_sum_bar(alpha = 0.2) |>
add_sum_dash() |>
add_sum_value(accuracy = 1, color = "black")
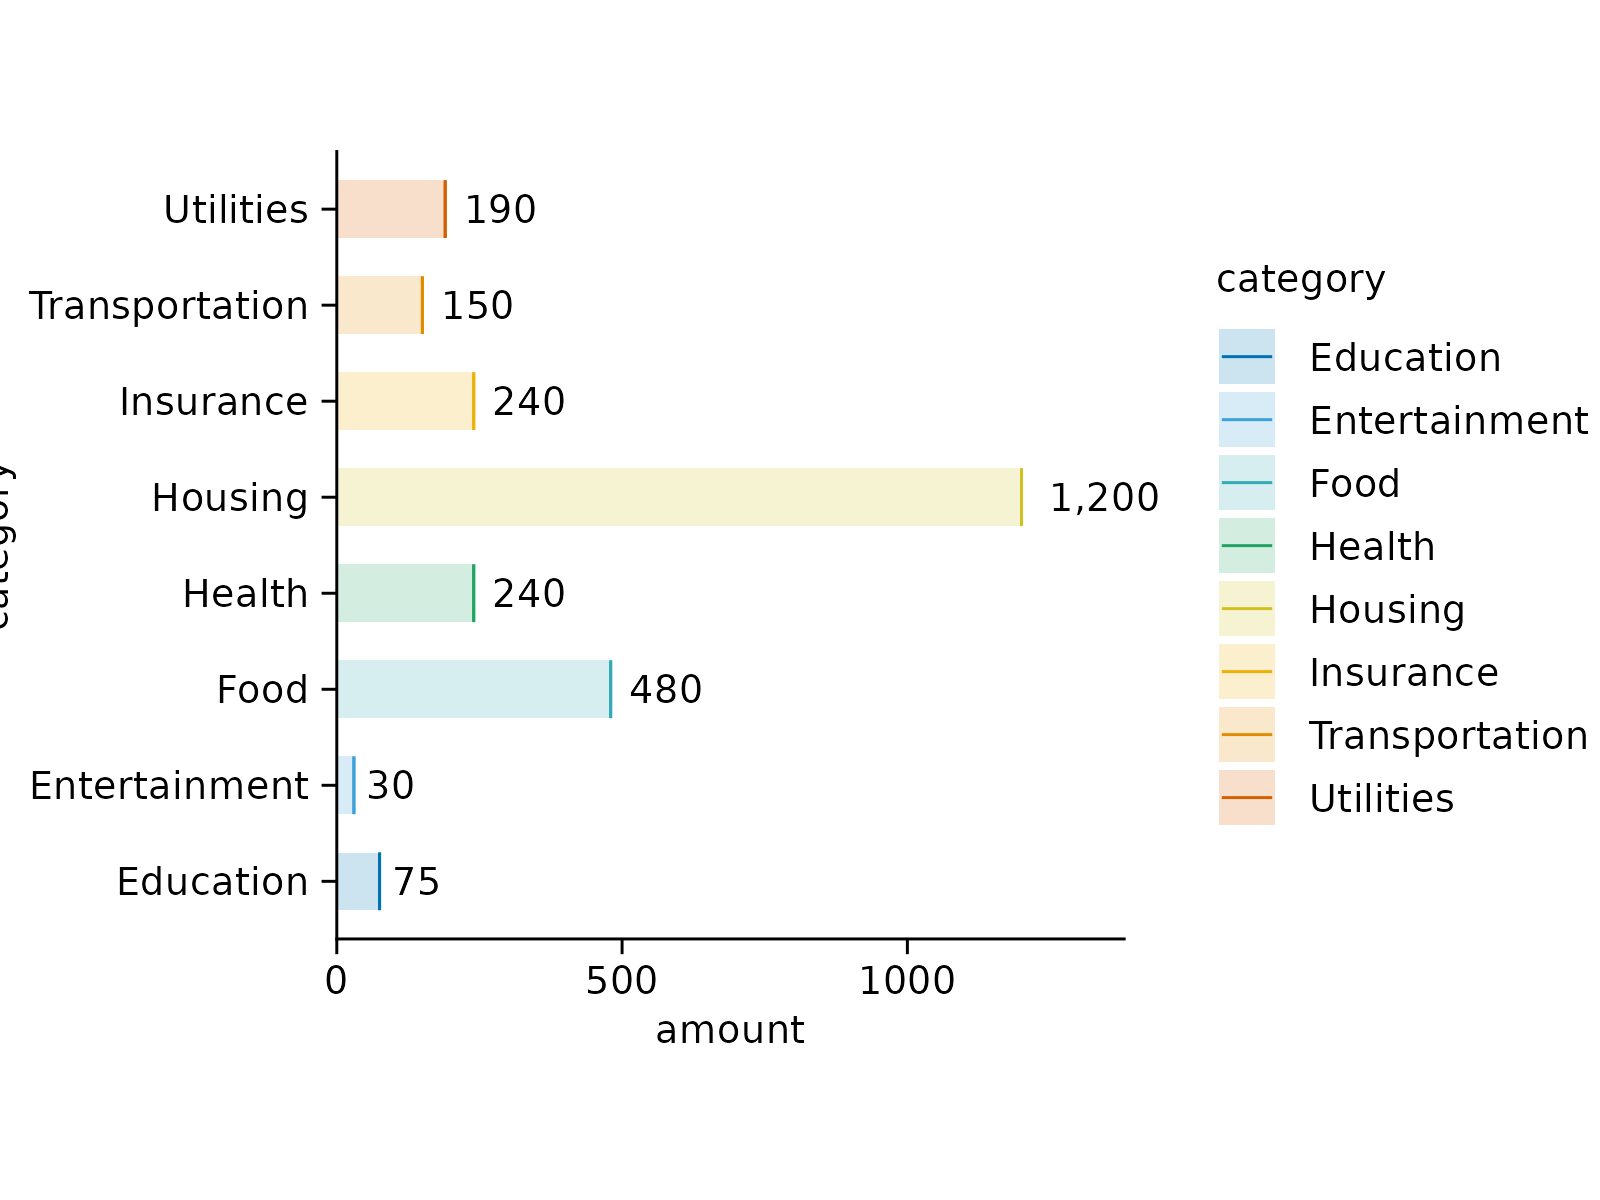
 # After removing
spendings |>
tidyplot(x = amount, y = category, color = category) |>
add_sum_bar(alpha = 0.2) |>
add_sum_dash() |>
add_sum_value(accuracy = 1, color = "black") |>
remove_clipping()
# After removing
spendings |>
tidyplot(x = amount, y = category, color = category) |>
add_sum_bar(alpha = 0.2) |>
add_sum_dash() |>
add_sum_value(accuracy = 1, color = "black") |>
remove_clipping()