Add violin plot
Usage
add_violin(
  plot,
  dodge_width = NULL,
  alpha = 0.3,
  saturation = 1,
  trim = TRUE,
  linewidth = 0.25,
  scale = "width",
  ...
)
Arguments
- plot
A
tidyplotgenerated with the functiontidyplot().- dodge_width
For adjusting the distance between grouped objects. Defaults to
0.8for plots with at least one discrete axis and0for plots with two continuous axes.- alpha
A
numberbetween0and1for the opacity of an object. A value of0is completely transparent,1is completely opaque.- saturation
A
numberbetween0and1for the color saturation of an object. A value of0is completely desaturated (white),1is the original color.- trim
If
TRUE(default), trim the tails of the violins to the range of the data. IfFALSE, don't trim the tails.- linewidth
Thickness of the line in points (pt). Typical values range between
0.25and1.- scale
if "area" (default), all violins have the same area (before trimming the tails). If "count", areas are scaled proportionally to the number of observations. If "width", all violins have the same maximum width.
- ...
Arguments passed on to the
geomfunction.
Examples
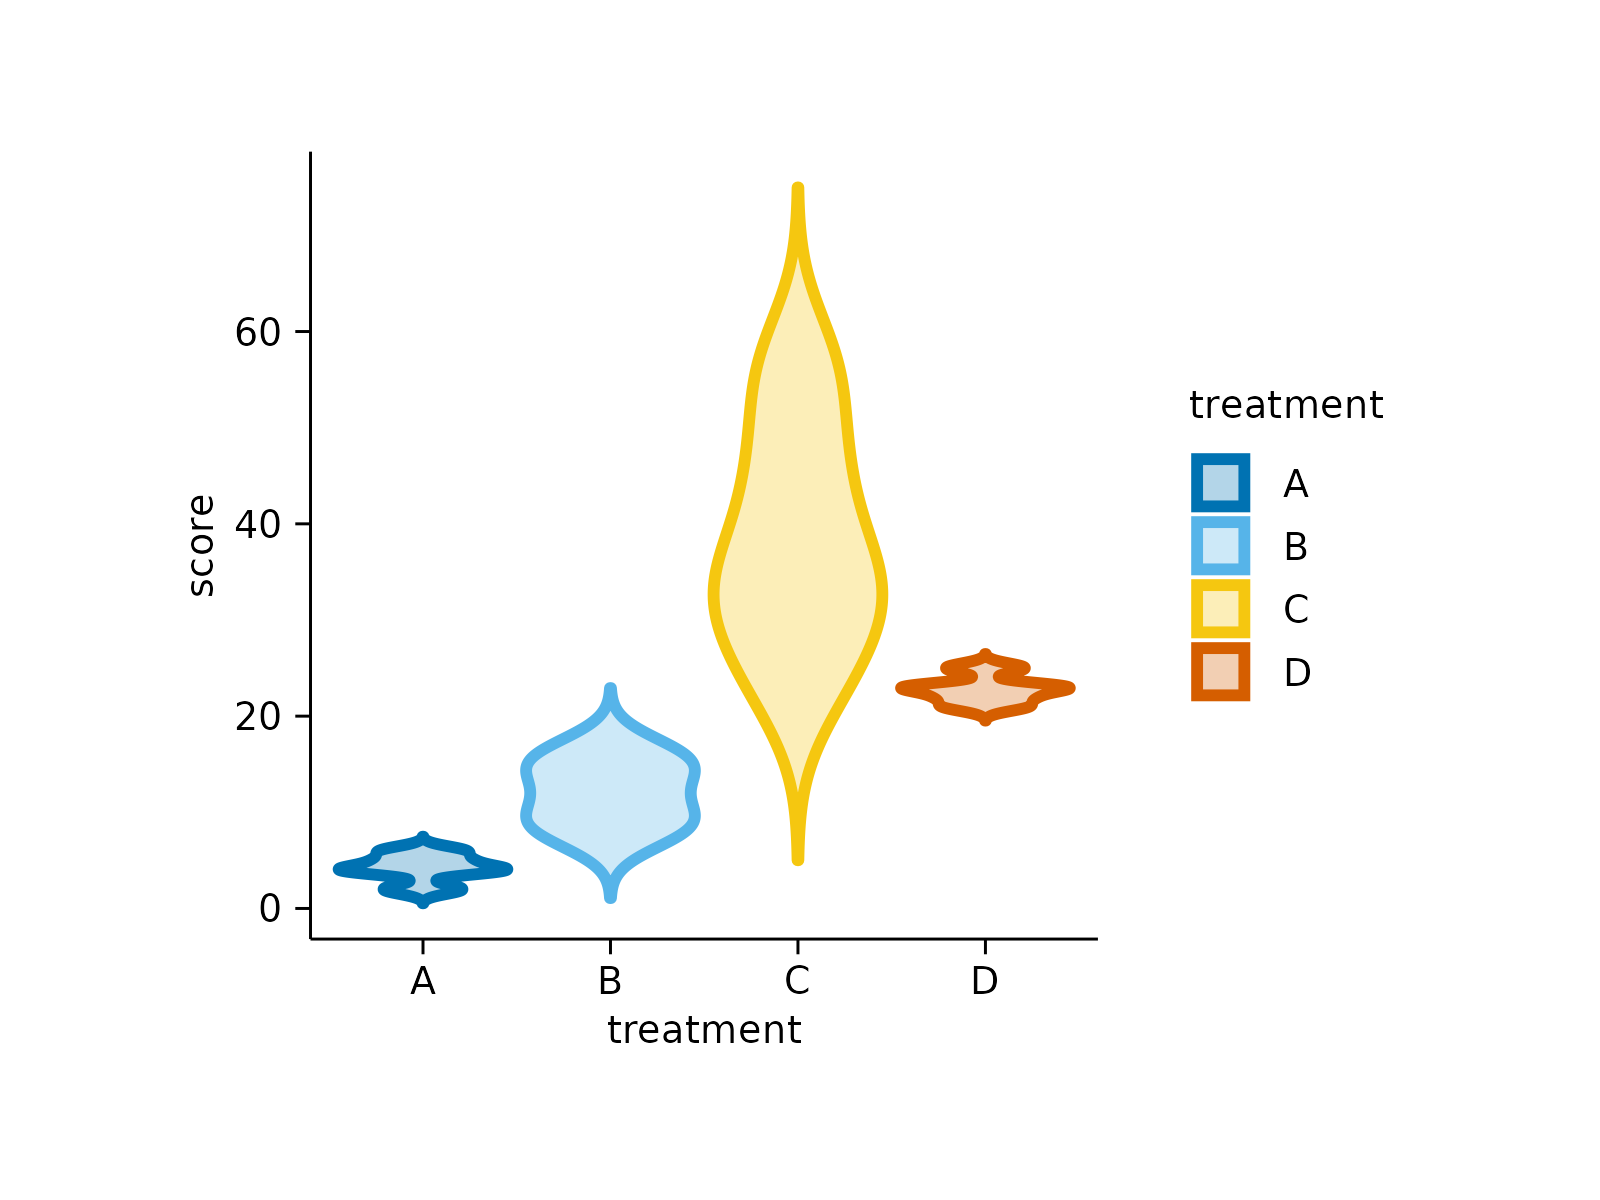
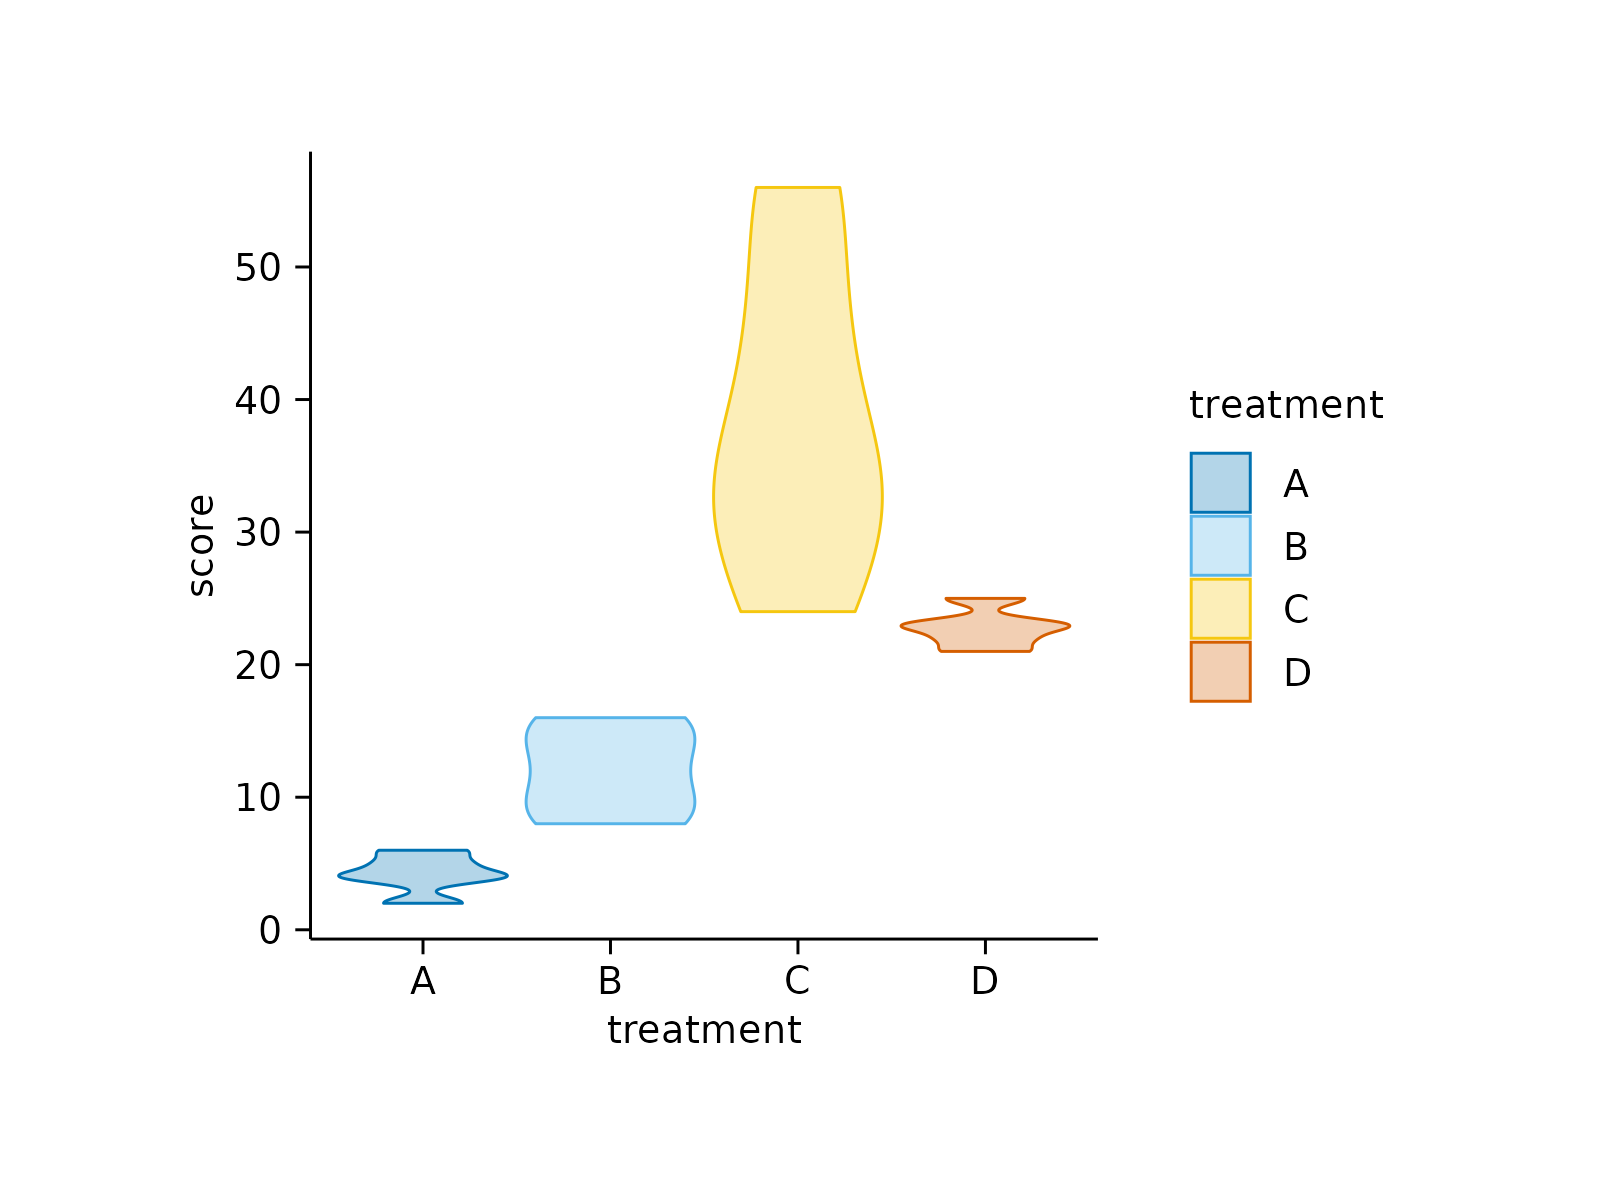
study |>
tidyplot(x = treatment, y = score, color = treatment) |>
add_violin()
 # Changing arguments:
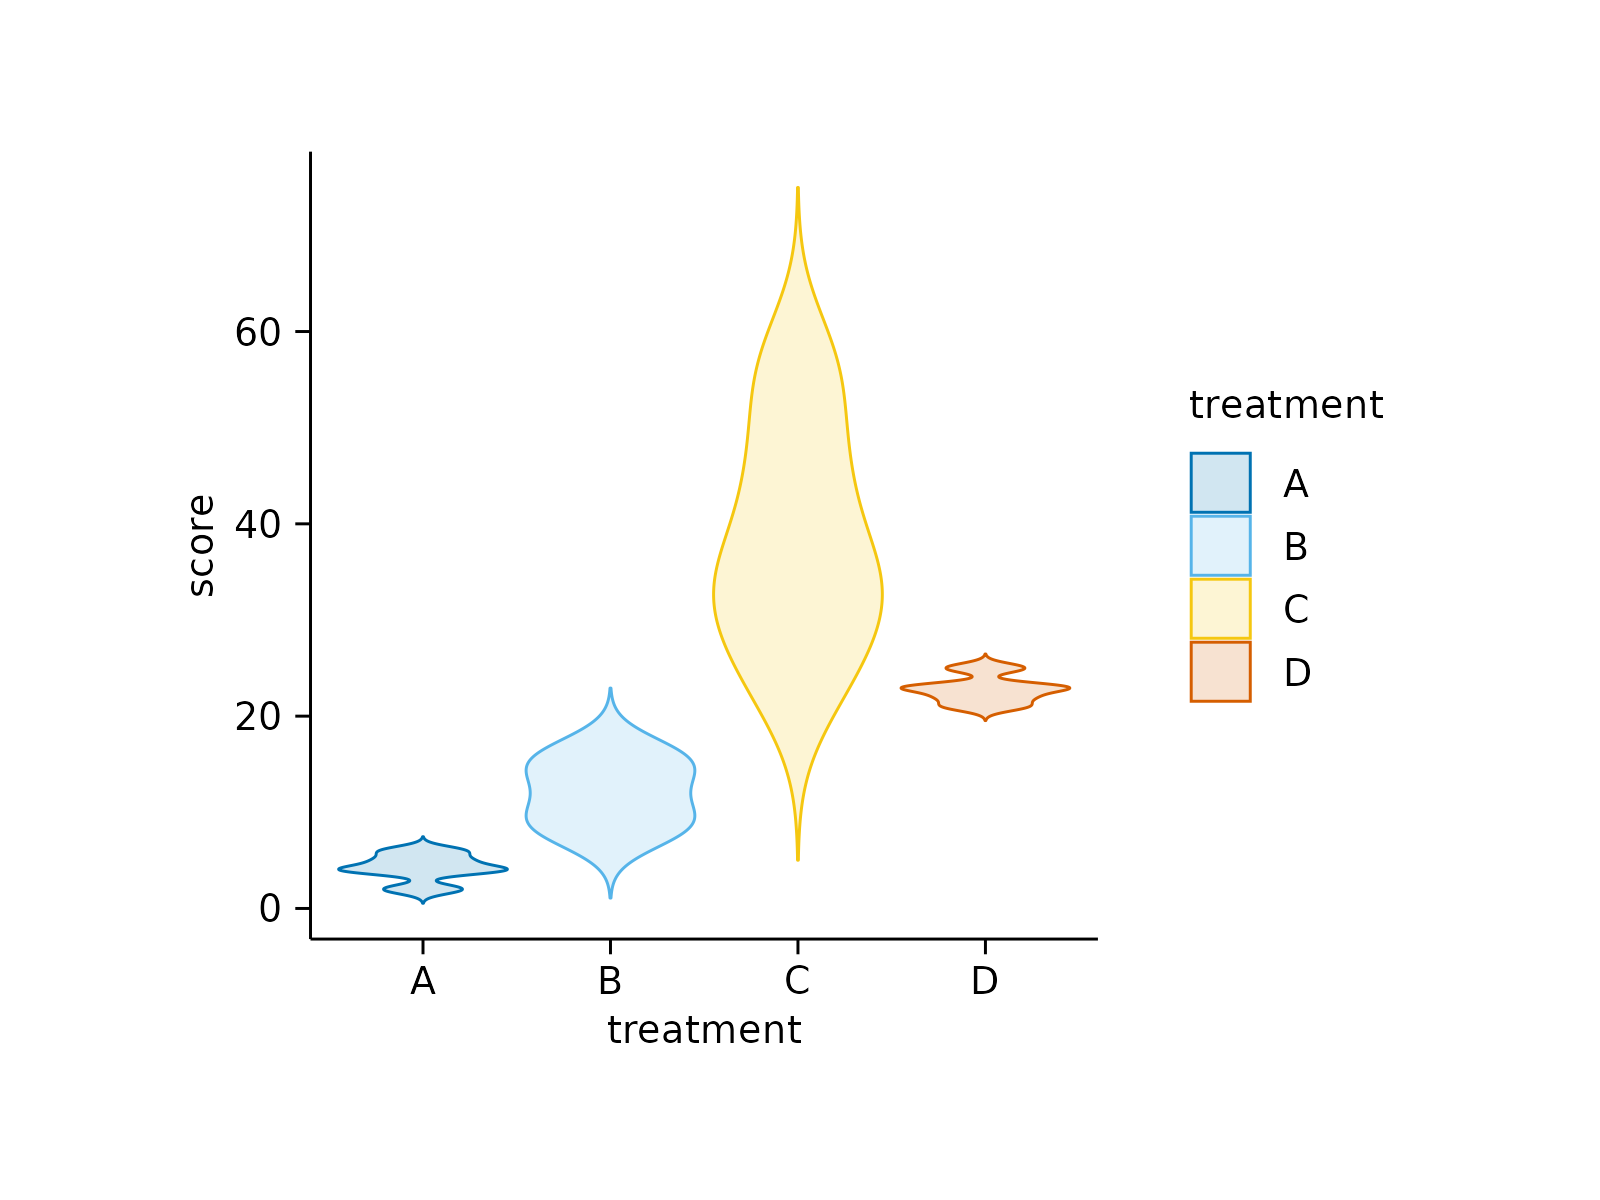
study |>
tidyplot(x = treatment, y = score, color = treatment) |>
add_violin(saturation = 0.6)
# Changing arguments:
study |>
tidyplot(x = treatment, y = score, color = treatment) |>
add_violin(saturation = 0.6)
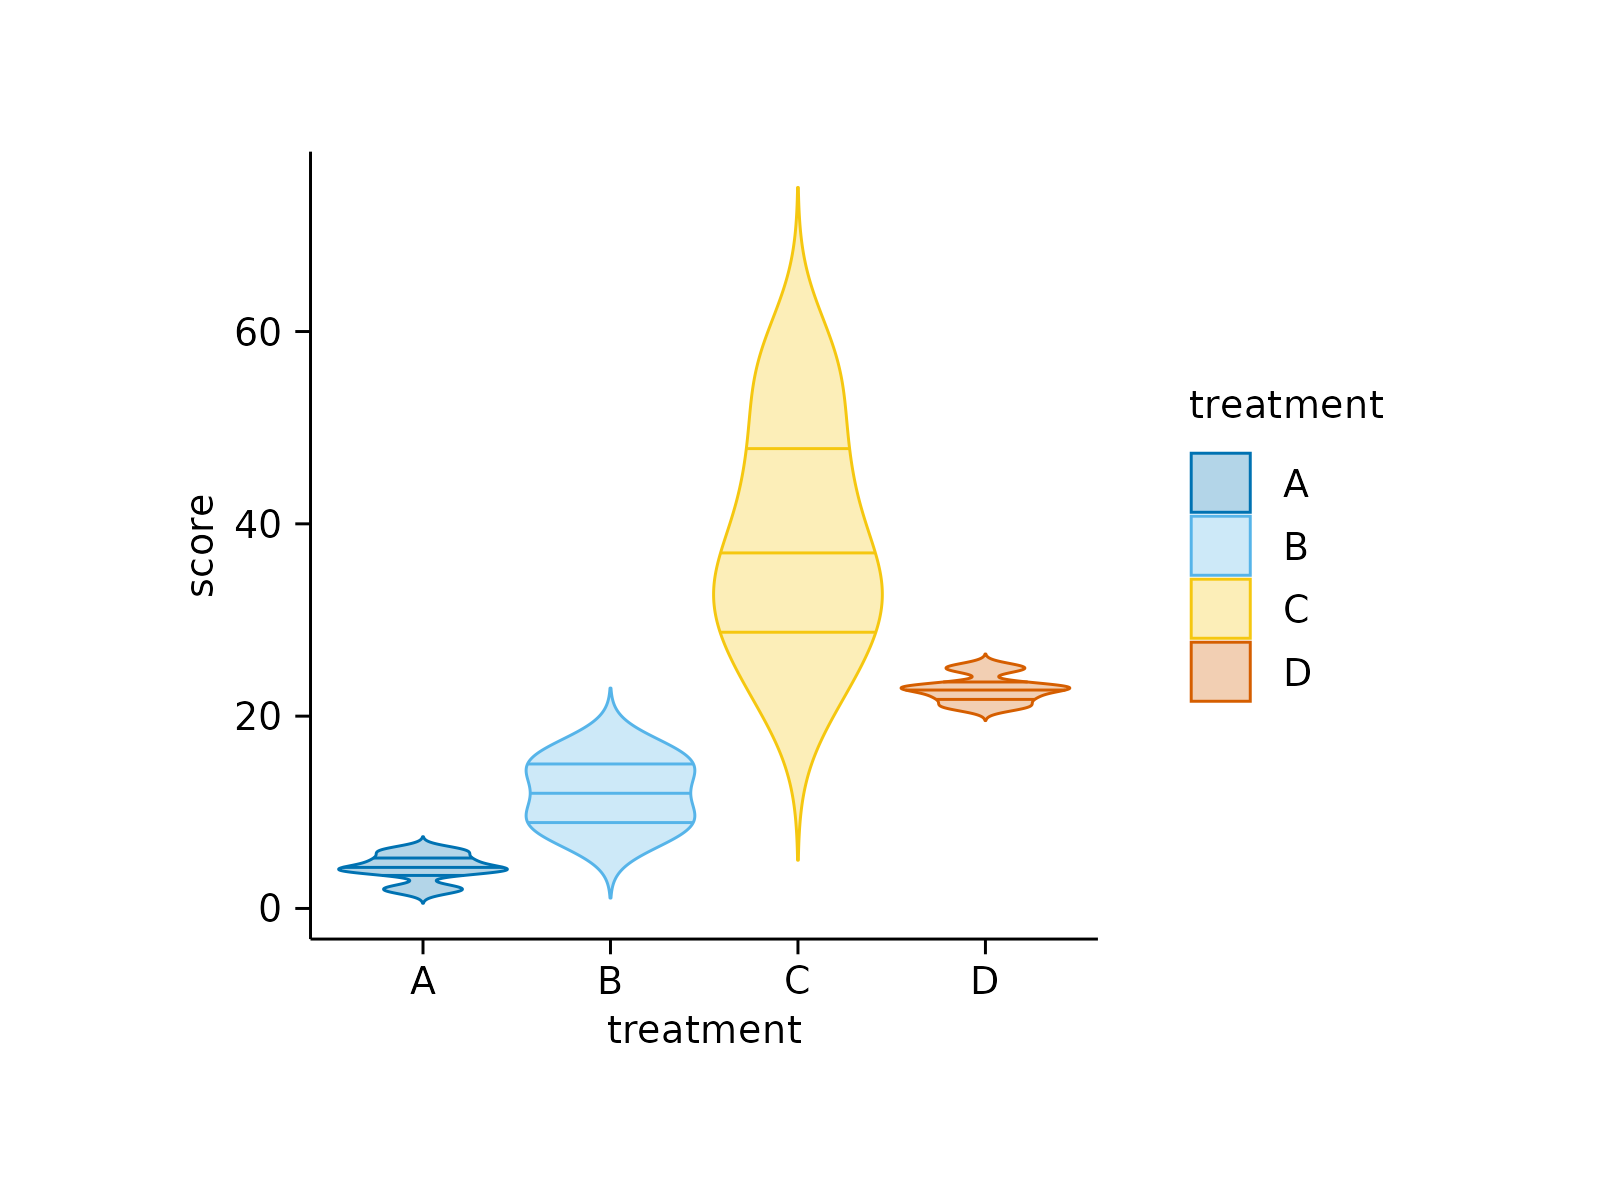
 study |>
tidyplot(x = treatment, y = score, color = treatment) |>
add_violin(draw_quantiles = c(0.25, 0.5, 0.75))
study |>
tidyplot(x = treatment, y = score, color = treatment) |>
add_violin(draw_quantiles = c(0.25, 0.5, 0.75))
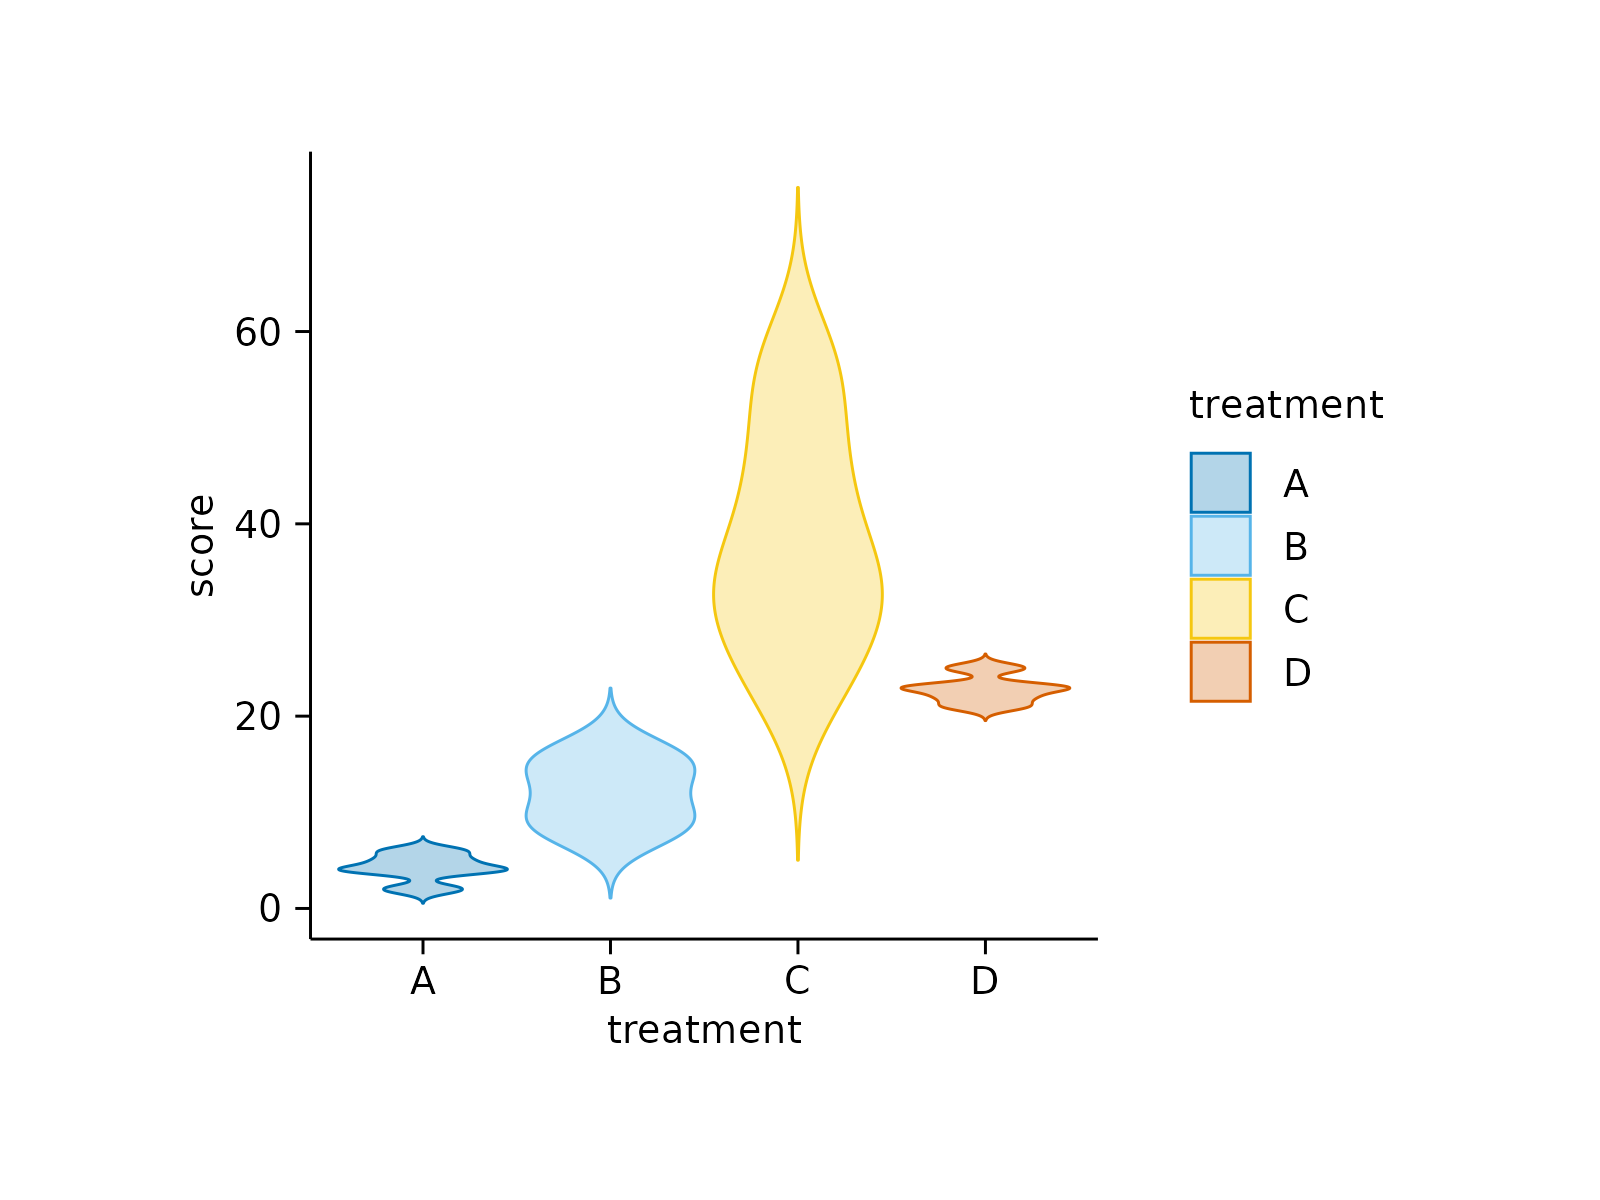
 study |>
tidyplot(x = treatment, y = score, color = treatment) |>
add_violin(trim = FALSE)
study |>
tidyplot(x = treatment, y = score, color = treatment) |>
add_violin(trim = FALSE)
 study |>
tidyplot(x = treatment, y = score, color = treatment) |>
add_violin(linewidth = 1)
study |>
tidyplot(x = treatment, y = score, color = treatment) |>
add_violin(linewidth = 1)