Add histogram
Arguments
- plot
A
tidyplotgenerated with the functiontidyplot().- binwidth
The width of the bins. Can be specified as a numeric value or as a function that takes x after scale transformation as input and returns a single numeric value. When specifying a function along with a grouping structure, the function will be called once per group. The default is to use the number of bins in
bins, covering the range of the data. You should always override this value, exploring multiple widths to find the best to illustrate the stories in your data.The bin width of a date variable is the number of days in each time; the bin width of a time variable is the number of seconds.
- bins
Number of bins. Overridden by
binwidth. Defaults to 30.- ...
Arguments passed on to the
geomfunction.
Examples
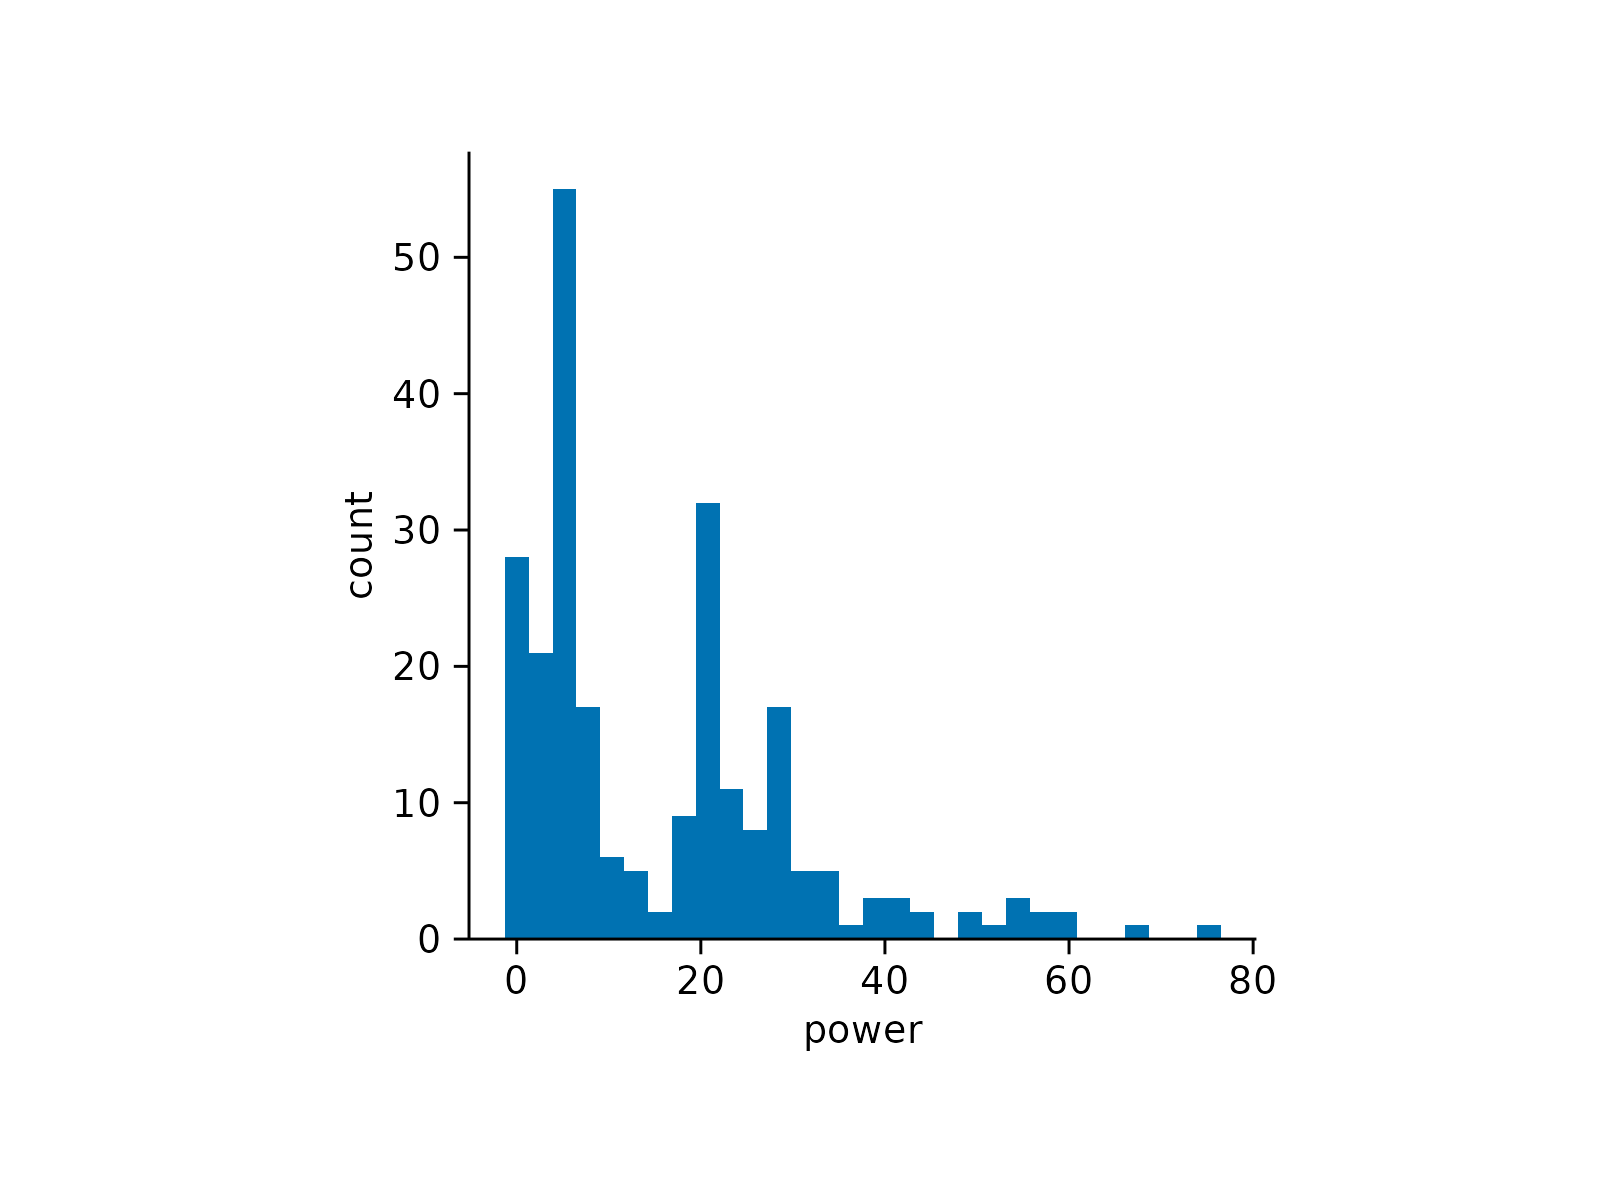
energy |>
tidyplot(x = energy) |>
add_histogram()
#> `stat_bin()` using `bins = 30`. Pick better value `binwidth`.
#> `stat_bin()` using `bins = 30`. Pick better value `binwidth`.
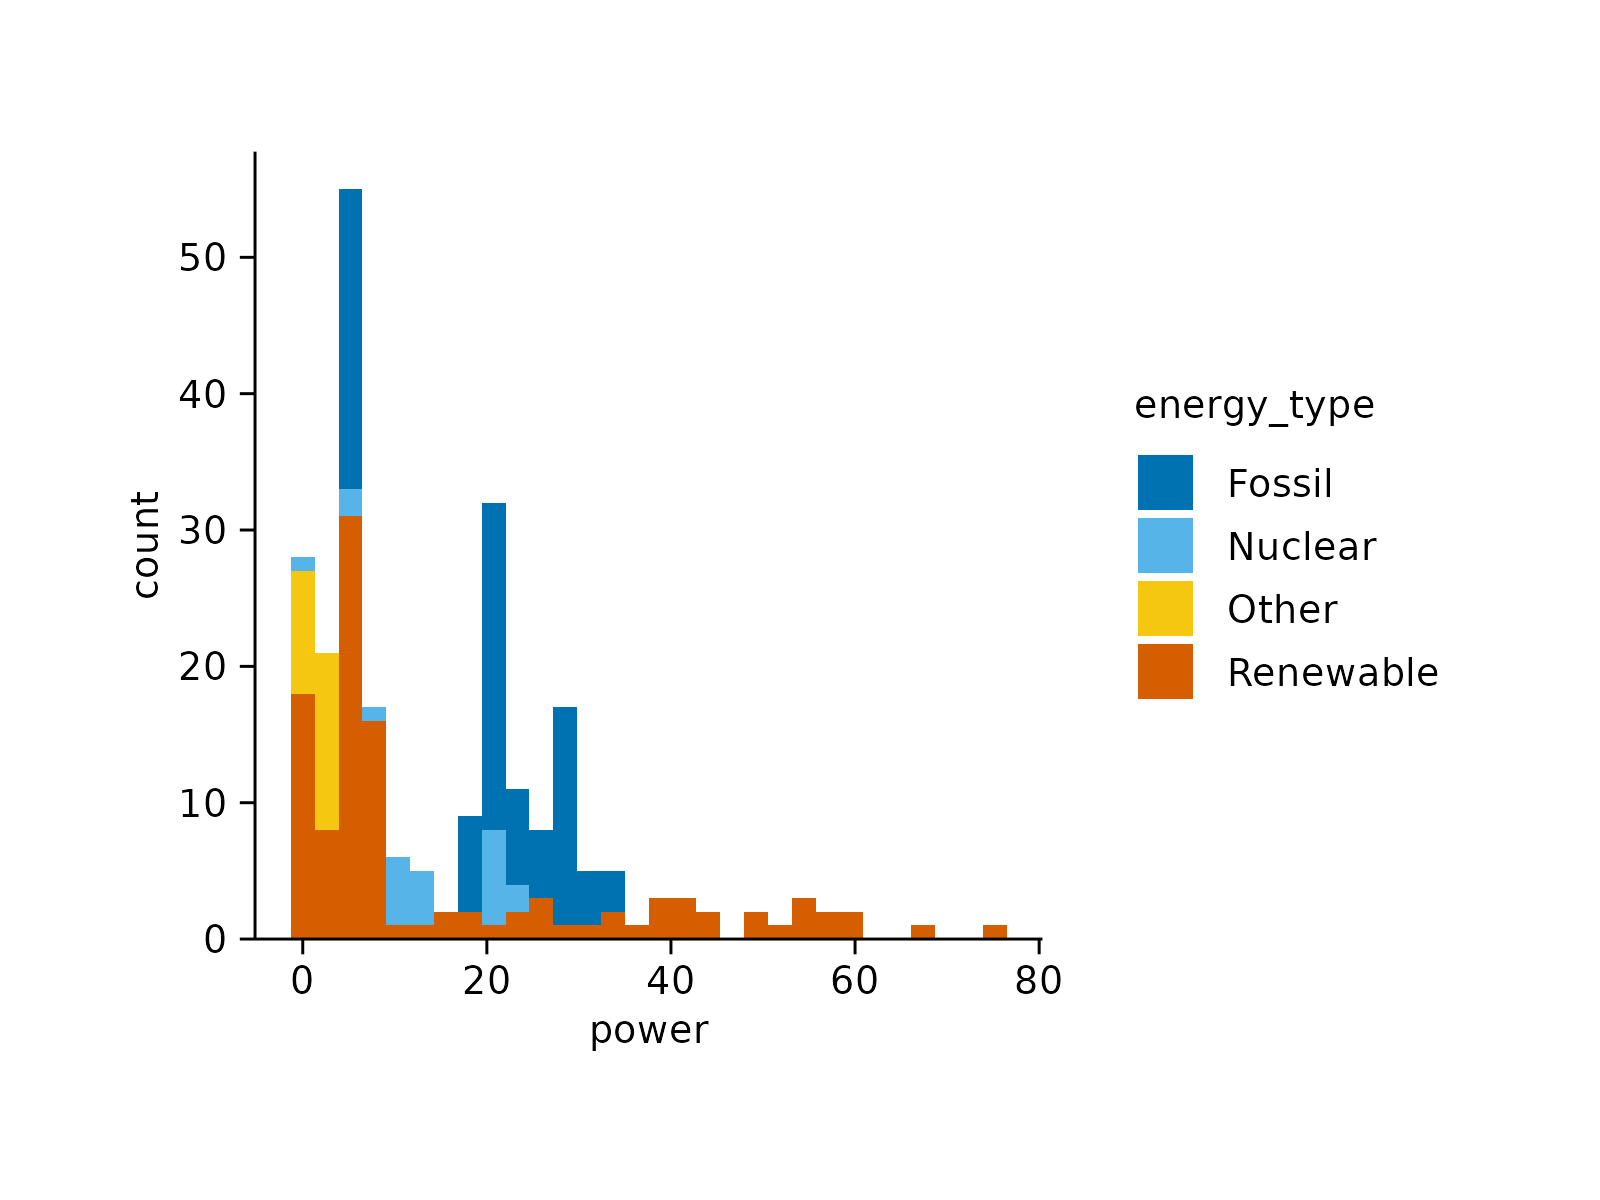
 energy |>
tidyplot(x = energy, color = energy_type) |>
add_histogram()
#> `stat_bin()` using `bins = 30`. Pick better value `binwidth`.
#> `stat_bin()` using `bins = 30`. Pick better value `binwidth`.
energy |>
tidyplot(x = energy, color = energy_type) |>
add_histogram()
#> `stat_bin()` using `bins = 30`. Pick better value `binwidth`.
#> `stat_bin()` using `bins = 30`. Pick better value `binwidth`.