Add curve fit
Usage
add_curve_fit(
  plot,
  dodge_width = NULL,
  method = "loess",
  linewidth = 0.25,
  alpha = 0.4,
  preserve = "total",
  ...
)
Arguments
- plot
A
tidyplotgenerated with the functiontidyplot().- dodge_width
For adjusting the distance between grouped objects. Defaults to
0.8for plots with at least one discrete axis and0for plots with two continuous axes.- method
Smoothing method (function) to use, accepts either
NULLor a character vector, e.g."lm","glm","gam","loess"or a function, e.g.MASS::rlmormgcv::gam,stats::lm, orstats::loess."auto"is also accepted for backwards compatibility. It is equivalent toNULL.For
method = NULLthe smoothing method is chosen based on the size of the largest group (across all panels).stats::loess()is used for less than 1,000 observations; otherwisemgcv::gam()is used withformula = y ~ s(x, bs = "cs")withmethod = "REML". Somewhat anecdotally,loessgives a better appearance, but is \(O(N^{2})\) in memory, so does not work for larger datasets.If you have fewer than 1,000 observations but want to use the same
gam()model thatmethod = NULLwould use, then setmethod = "gam", formula = y ~ s(x, bs = "cs").- linewidth
Thickness of the line in points (pt). Typical values range between
0.25and1.- alpha
A
numberbetween0and1for the opacity of an object. A value of0is completely transparent,1is completely opaque.- preserve
Should dodging preserve the
"total"width of all elements at a position, or the width of a"single"element?- ...
Arguments passed on to
ggplot2::geom_smooth().
Examples
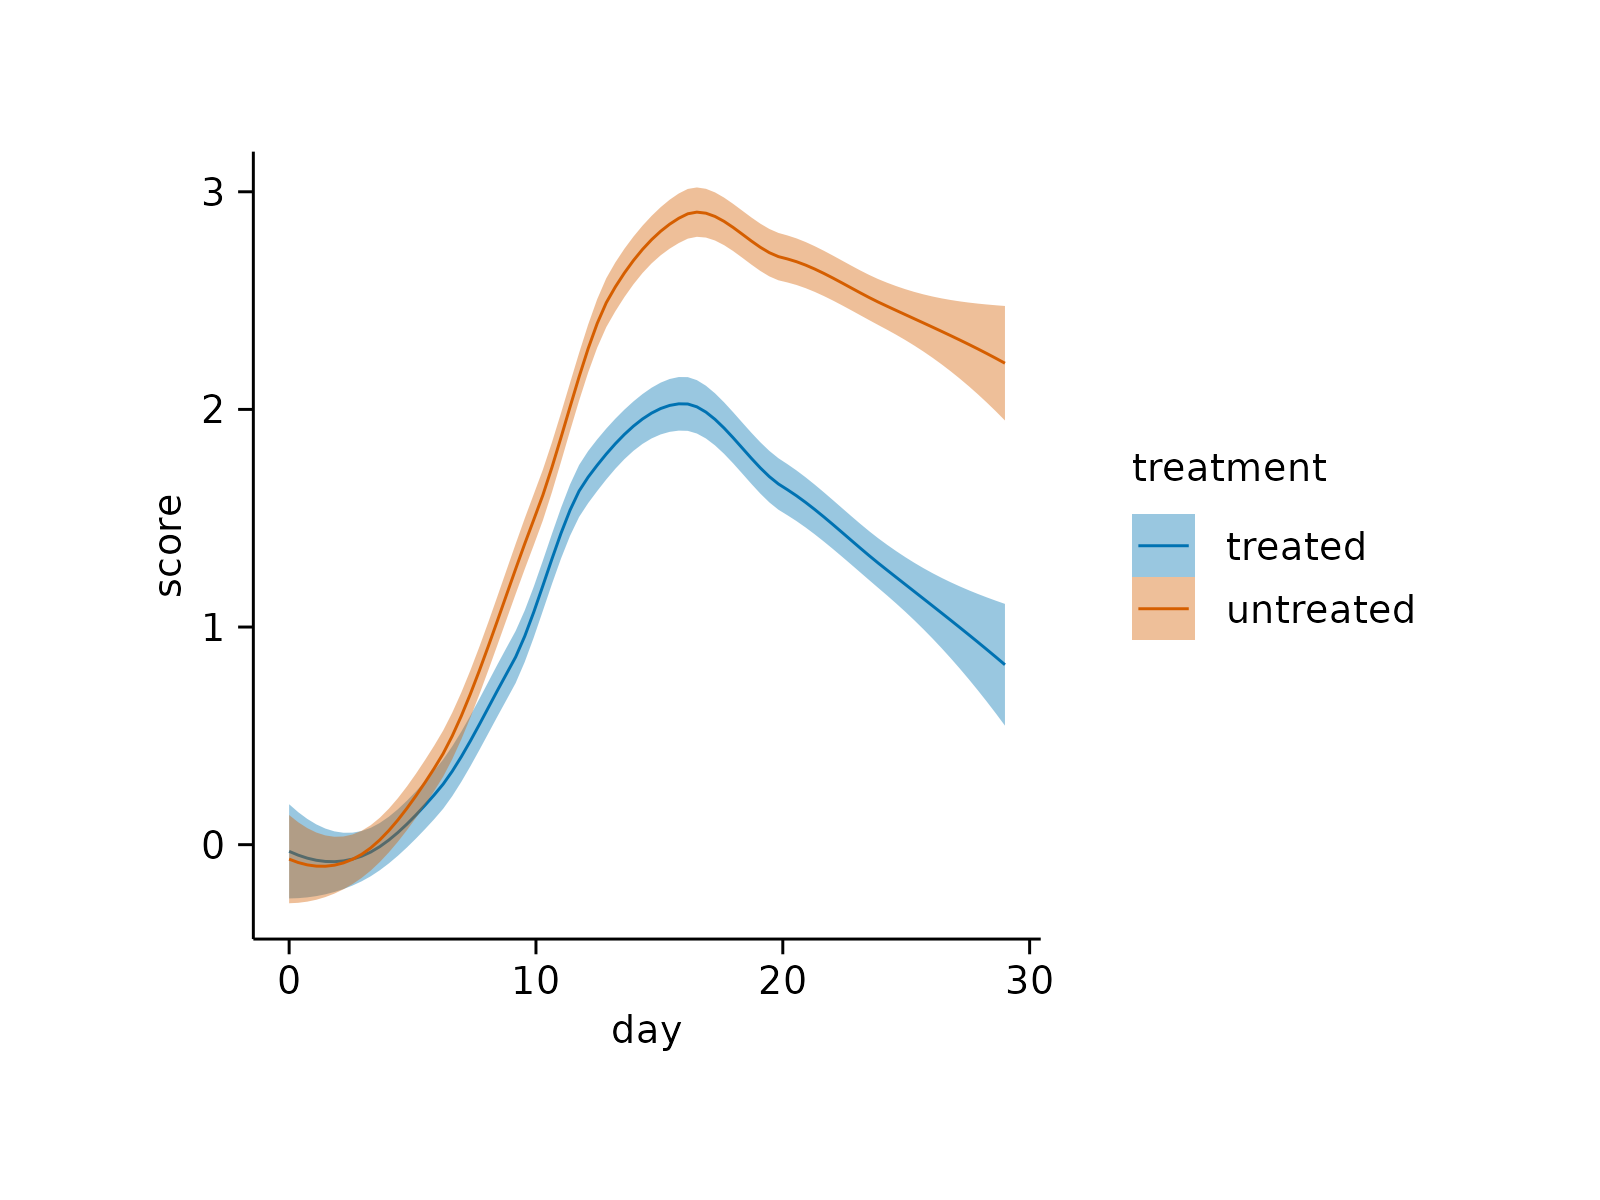
time_course |>
tidyplot(x = day, y = score, color = treatment) |>
add_curve_fit()
#> `geom_smooth()` using formula = 'y ~ x'
#> Warning: Removed 170 rows containing non-finite outside the scale range
#> (`stat_smooth()`).
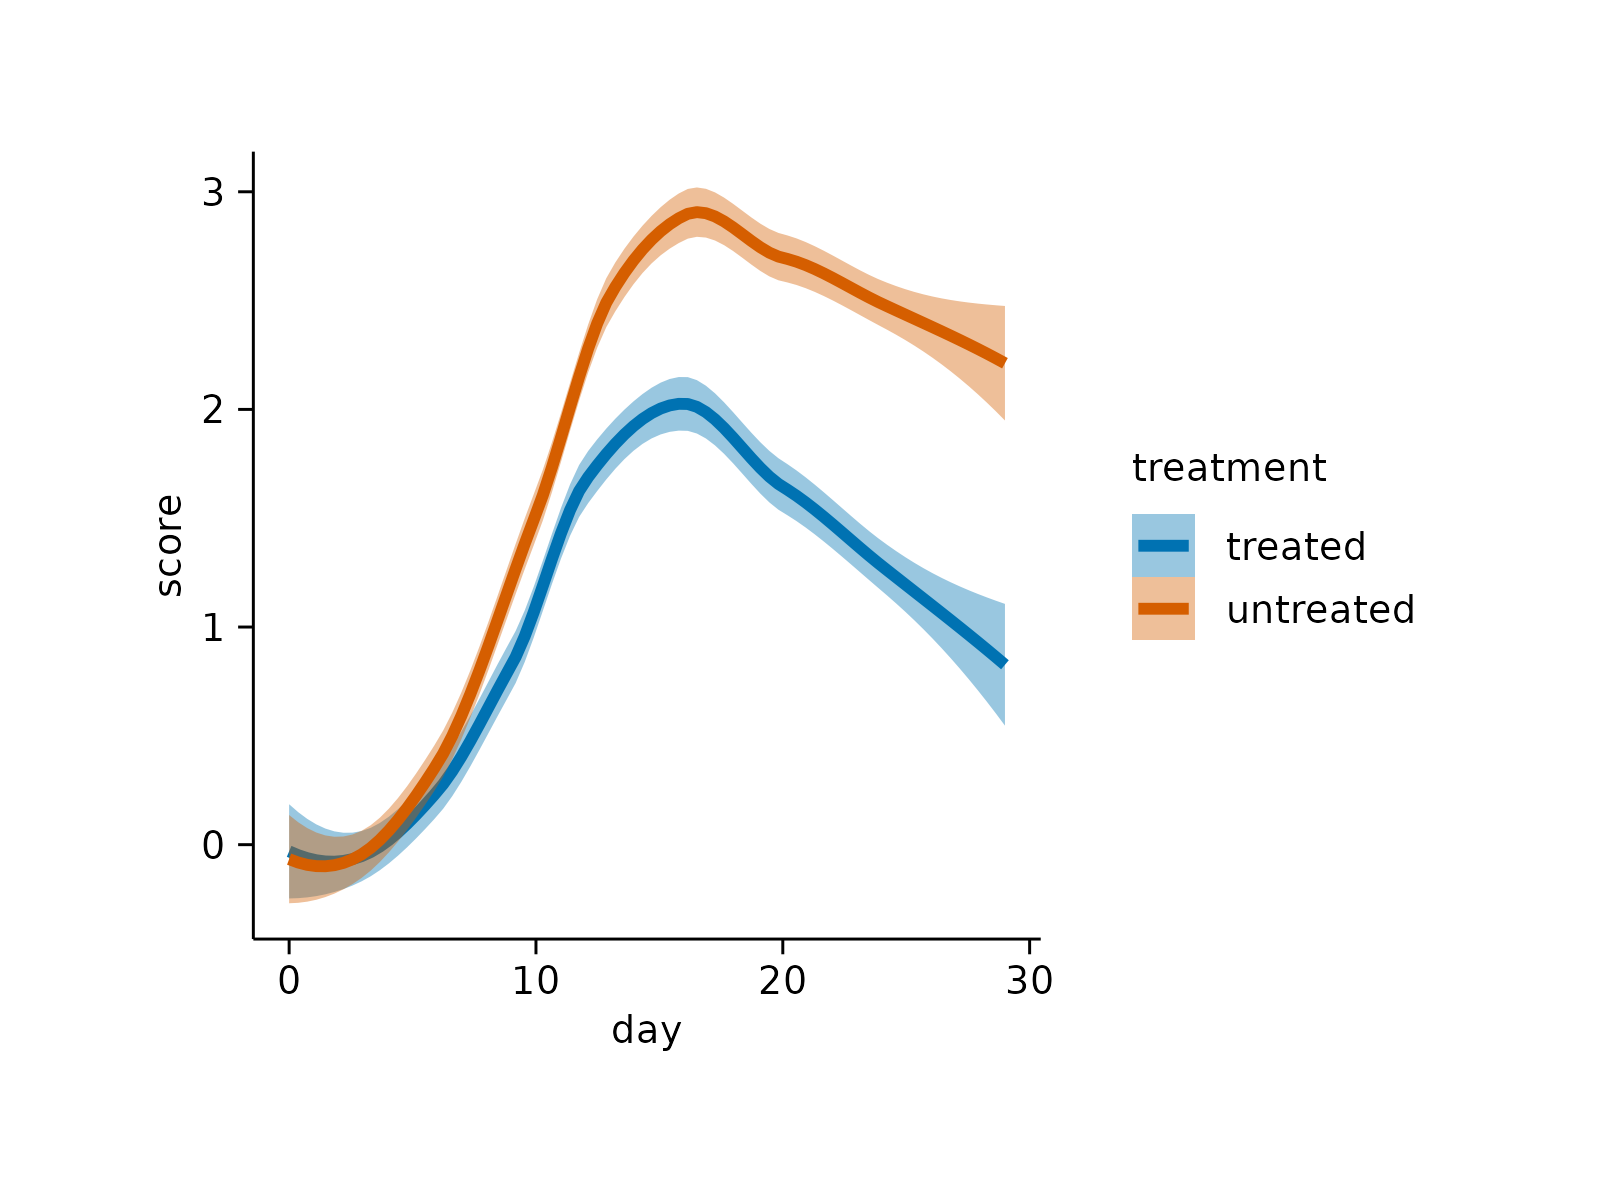
 # Changing arguments
time_course |>
tidyplot(x = day, y = score, color = treatment) |>
add_curve_fit(linewidth = 1)
#> `geom_smooth()` using formula = 'y ~ x'
#> Warning: Removed 170 rows containing non-finite outside the scale range
#> (`stat_smooth()`).
# Changing arguments
time_course |>
tidyplot(x = day, y = score, color = treatment) |>
add_curve_fit(linewidth = 1)
#> `geom_smooth()` using formula = 'y ~ x'
#> Warning: Removed 170 rows containing non-finite outside the scale range
#> (`stat_smooth()`).
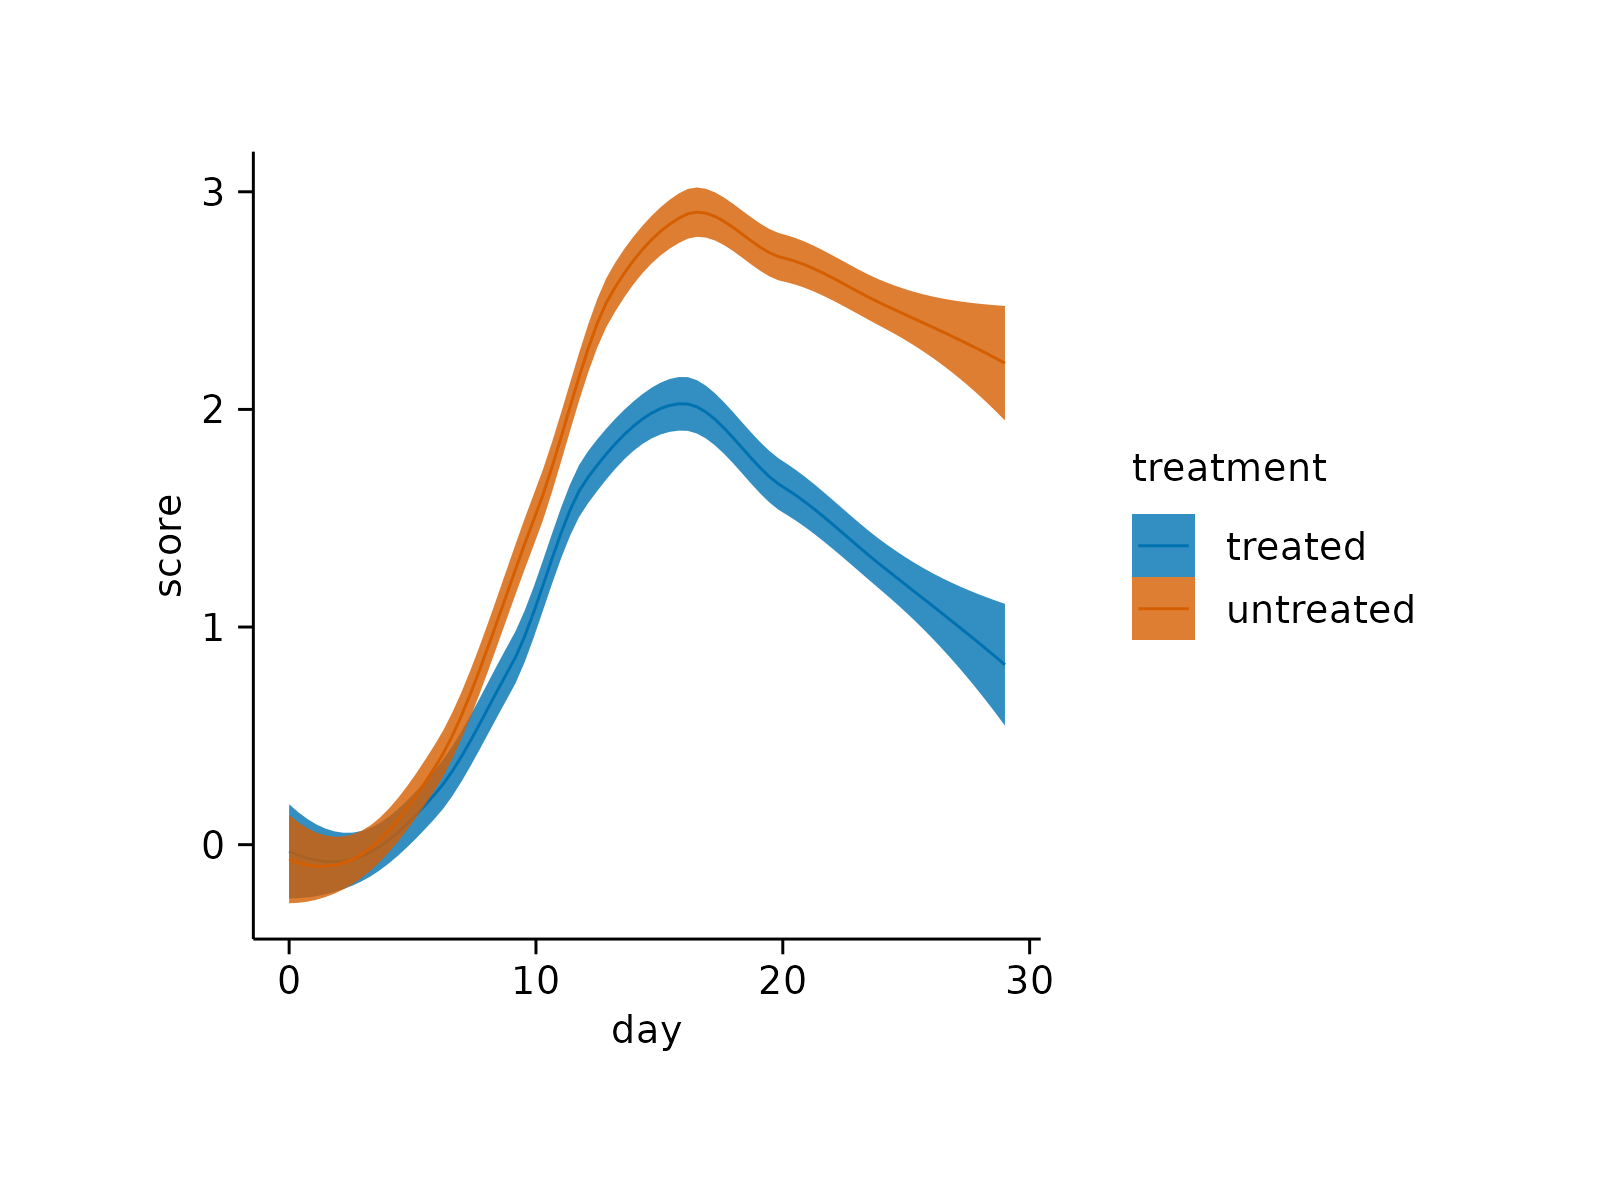
 time_course |>
tidyplot(x = day, y = score, color = treatment) |>
add_curve_fit(alpha = 0.8)
#> `geom_smooth()` using formula = 'y ~ x'
#> Warning: Removed 170 rows containing non-finite outside the scale range
#> (`stat_smooth()`).
time_course |>
tidyplot(x = day, y = score, color = treatment) |>
add_curve_fit(alpha = 0.8)
#> `geom_smooth()` using formula = 'y ~ x'
#> Warning: Removed 170 rows containing non-finite outside the scale range
#> (`stat_smooth()`).
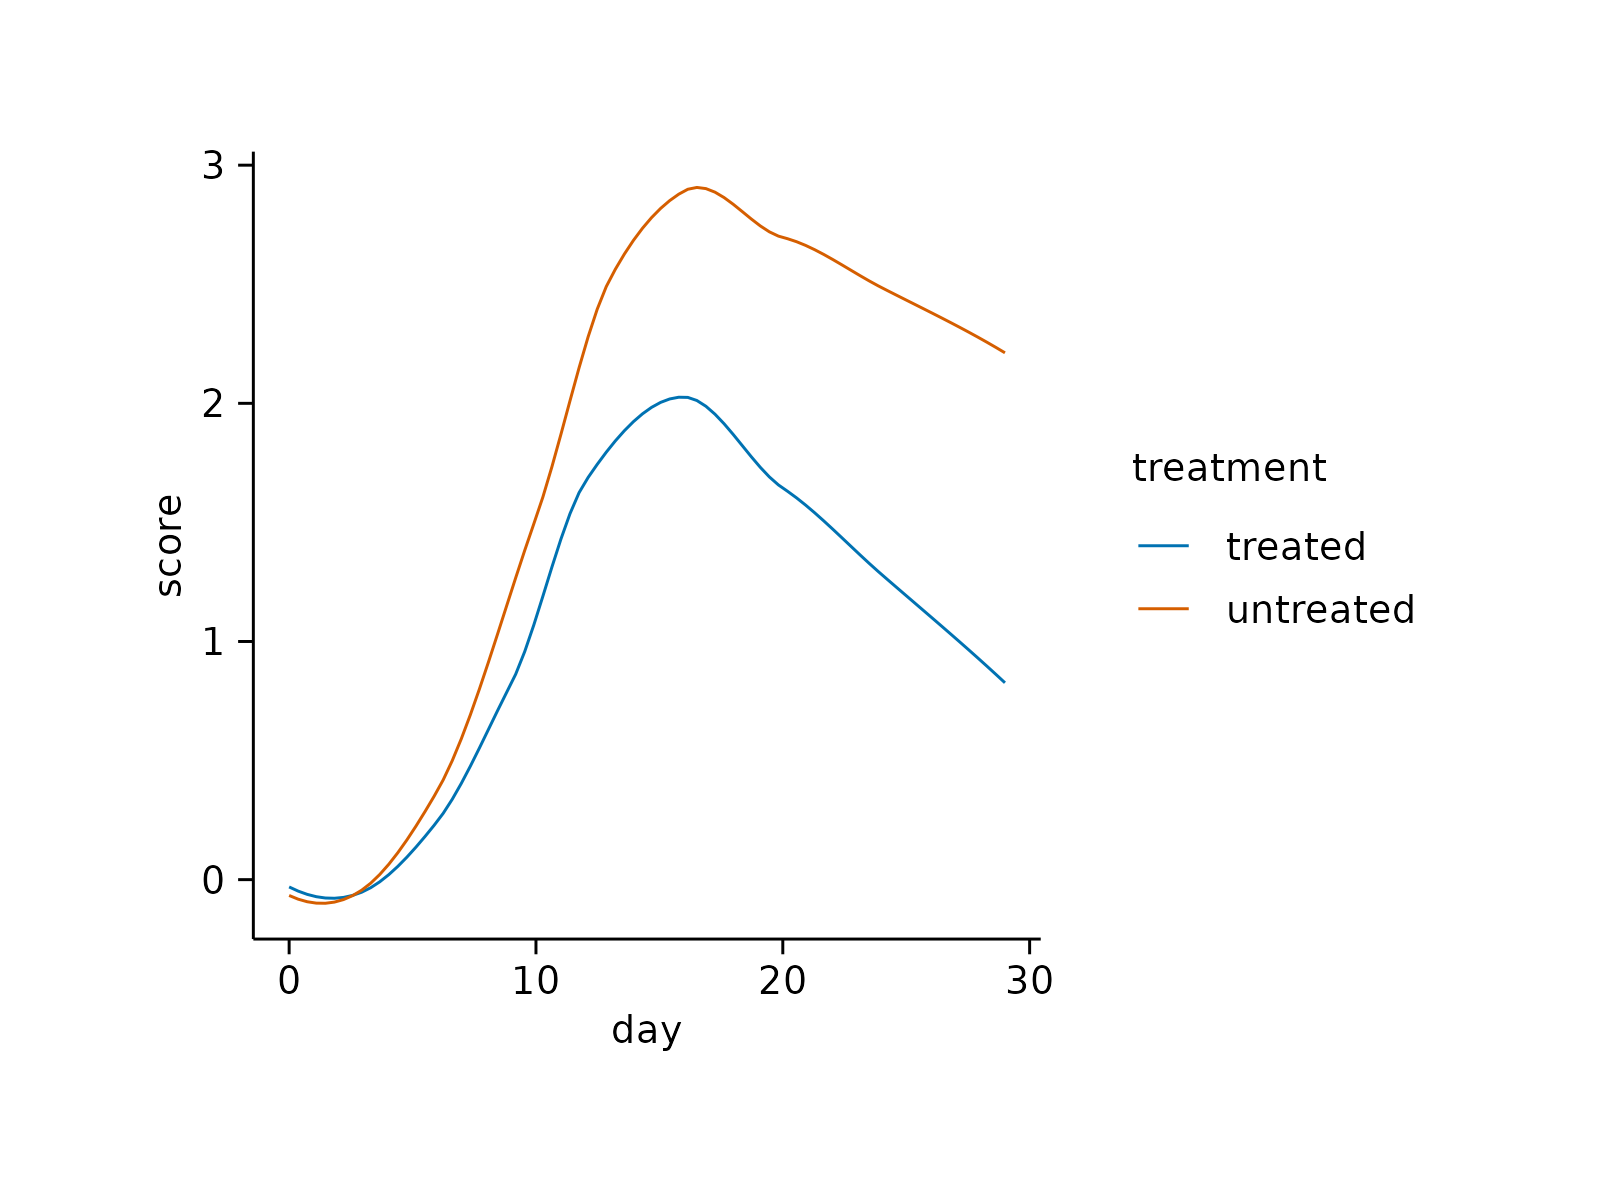
 # Remove confidence interval
time_course |>
tidyplot(x = day, y = score, color = treatment) |>
add_curve_fit(se = FALSE)
#> `geom_smooth()` using formula = 'y ~ x'
#> Warning: Removed 170 rows containing non-finite outside the scale range
#> (`stat_smooth()`).
# Remove confidence interval
time_course |>
tidyplot(x = day, y = score, color = treatment) |>
add_curve_fit(se = FALSE)
#> `geom_smooth()` using formula = 'y ~ x'
#> Warning: Removed 170 rows containing non-finite outside the scale range
#> (`stat_smooth()`).